 Meter Dashboard
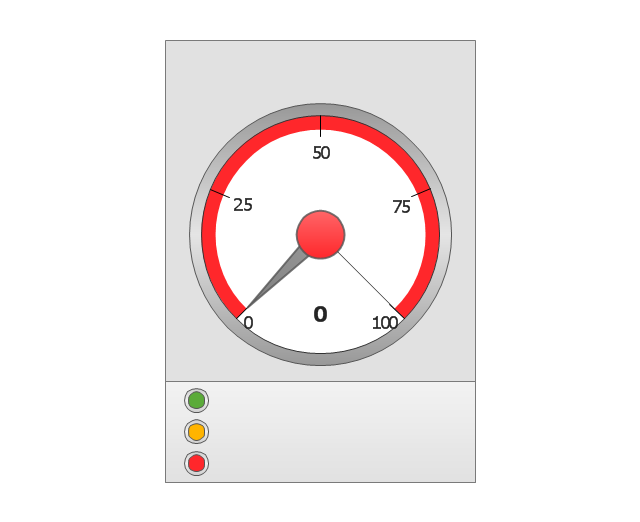
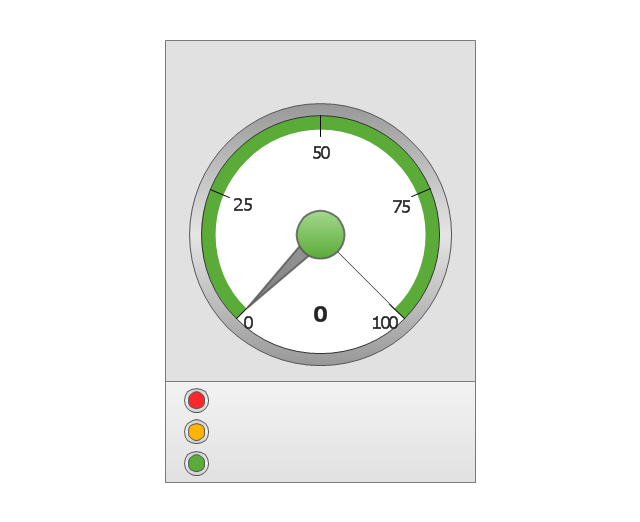
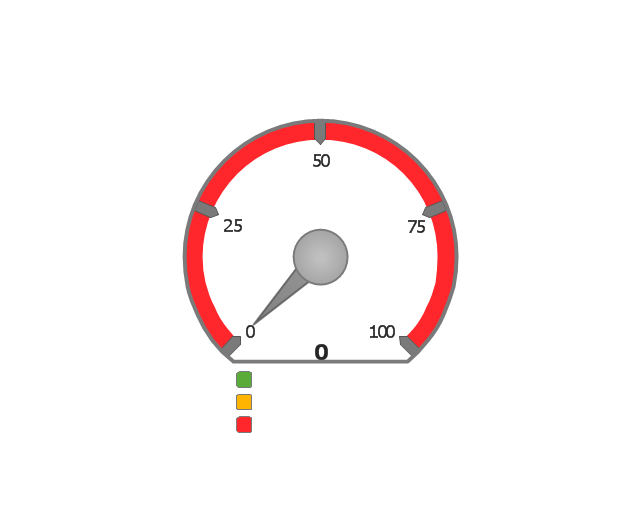
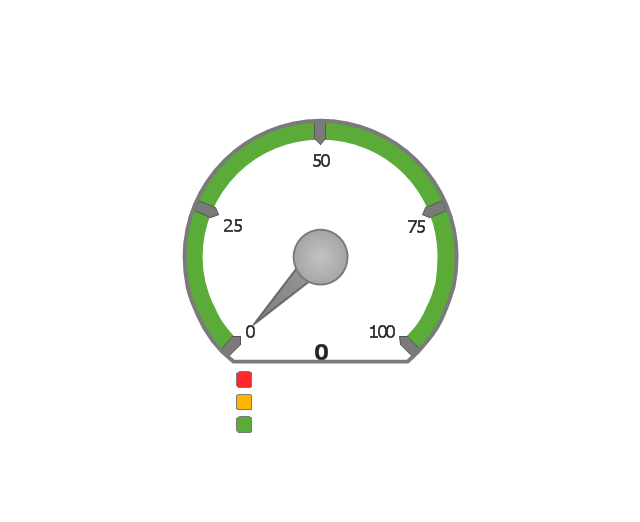
Meter dashboard solution extends ConceptDraw PRO software with templates, samples and vector stencils library with meter indicators for drawing visual dashboards showing quantitative data.
The vector stencils library "Meter indicators" contains 29 Live Objects: speedometer gauge, dial, bullet, slider and level meter visual indicators.
The Live Objects designed to display actual measures of performance metrics from external data source files. Some of them also display comparative measures, and colored zones of qualitative ranges with legend.
Use this library to create visual dashboards in the ConceptDraw PRO diagramming and vector drawing software extended with the Meter Dashboard solution from the area "What is a Dashboard" of ConceptDraw Solution Park.
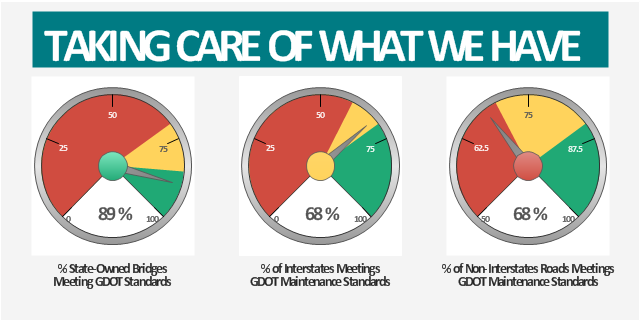
This example was created on the base of the Georgia DOT Performance Management Dashboard from the Georgia Department of Transportation website.
[dot.ga.gov/ informationcenter/ statistics/ performance/ Pages/ default.aspx]
"Performance management (PM) includes activities which ensure that goals are consistently being met in an effective and efficient manner. Performance management can focus on the performance of an organization, a department, employee, or even the processes to build a product of service, as well as many other areas.
PM is also known as a process by which organizations align their resources, systems and employees to strategic objectives and priorities.
Performance management originated as a broad term coined by Dr. Aubrey Daniels in the late 1970s to describe a technology (i.e. science imbedded in applications methods) for managing both behavior and results, two critical elements of what is known as performance. A formal definition of performance management, according to Daniels' is "a scientifically based, data-oriented management system. It consists of three primary elements-measurement, feedback and positive reinforcement."" [Performance management. Wikipedia]
The meter dashboard example "Georgia DOT Performance Management" was created using the ConceptDraw PRO diagramming and vector drawing software extended with the Meter Dashboard solution from the area "What is a Dashboard" of ConceptDraw Solution Park.
 Sales Dashboard
Sales Dashboard solution extends ConceptDraw PRO software with templates, samples and library of vector stencils for drawing the visual dashboards of sale metrics and key performance indicators (KPI).
Performance Indicators
ConceptDraw PRO diagramming and vector drawing software offers the useful tools of the Sales Dashboard solution from the Marketing area for easy creating professional looking live dashboards which allow to track the business sales activity and progress thanks to representing the Key Performance Indicators (KPIs) on them.- Meter Dashboard | Design elements - Sales dashboard | Sales ...
- Electrical Symbols, Electrical Diagram Symbols | Electrical Symbols ...
- Design elements - Meter indicators | Meter Dashboard | Sales ...
- Symbol Of Water Meter Enginering Drawing
- Electrical Symbols, Electrical Diagram Symbols | Electrical Symbols ...
- Ring Network Topology | Design elements - Meter indicators | IP ...
- Design elements - Sales KPIs and metrics | Performance Indicators ...
- EPN Frame-Relay and Dial-up Network. Computer and Network ...
- Flow Diagram Thermometer Symbol
- Electrical Symbols, Electrical Diagram Symbols | Design elements ...
- Instruments - Vector stencils library | Thermometer Pid Symbol
- Design elements - Instruments | Electrical Symbols, Electrical ...
- Meter Dashboard | What is a Dashboard Area | Sale dashboard ...
- Design elements - Android switches and sliders | Design elements ...
- Design elements - Meter indicators
- Types of Flowcharts | Design elements - Meter indicators | Ansoff ...
- KPIs and Metrics | Business Intelligence Dashboard | The Facts and ...
- KPIs and Metrics | What is a KPI? | Sales KPIs and Metrics - Vector ...
- Sales metrics and KPIs - Visual dashboard | Sales KPIs ...
- Gauges Chart Software
