 Visio Exchange
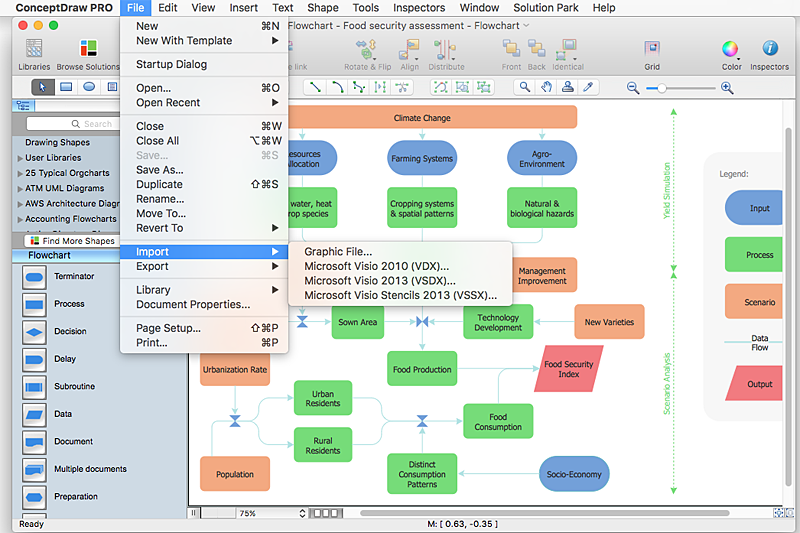
Our Visio Exchange tool allows you to Import and export native MS Visio 2013 files that are in the new MS Visio drawing (VSDX) format introduced in the most recent Visio iteration. In addition, ConceptDraw PRO v10 supports the import and export of MS Visio 2007-2010 XML. (VDX) files more accurately then previous versions of ConceptDraw PRO. If you have the older MS Visio 2007-2010.
HelpDesk
How to Open MS Visio® 2013/2016 Files on a Mac® Using ConceptDraw PRO v10
Powerful business graphics and diagramming tools are the norm and not the exception for today’s businesses. For years the de facto standard file format for business has been Microsoft Visio™. Many people involved in visual communication need software tools that will read and write using the Visio file format. With the introduction of Visio 2013 Microsoft has changed the native file format used in earlier versions of Microsoft Visio. ConceptDraw PRO v10 file import and export works round-trip with the new Visio VSDX file format.HelpDesk
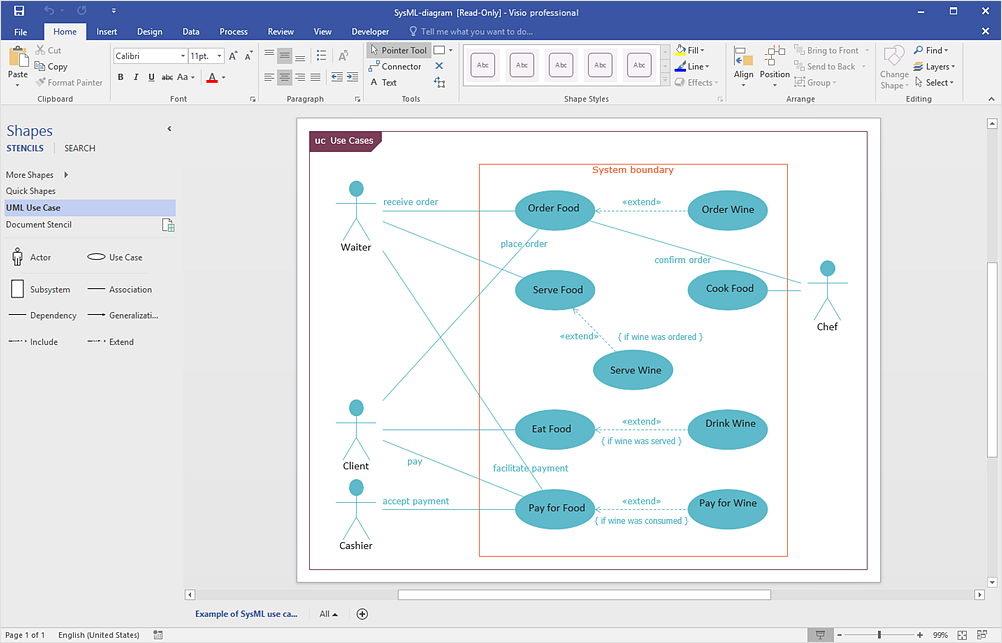
How to Open MS Visio® 2007-2010 Files on Mac®
The ConceptDraw PRO has slve the problem for those who need to share MS Visio documents between users of different operation systems. ConceptDraw Visio File Conversion is a free web service, that is available to anyone who has a requirement to open Visio (VSD) documents in ConceptDraw PRO. This service was created for Mac OS X users , who need to open visual documents saved in Visio(VSD) file format. If you have heard from many people that they frequently faced difficulties with sharing their MS Visio documents between Windows and Mac OS X users, be sure that there were no ConceptDraw PRO users among them.HelpDesk
How to Convert ConceptDraw PRO file into MS Visio 2010 format
Many people use the MS Visio as a business graphic creation program. It is a powerful application with advanced ability to support complex solutions. The native file format for Visio 2010 and earlier files is VSD. ConceptDraw PRO supports export to Visio XML files (VDX). The transfer process is very simple. You can easily share your ConceptDraw Documents with MS Visio 2007/2010 users. changing software products, you can keep all your documents, created in MS Visio. Using ConceptDraw PRO, the same as using MS Visio , you will have an opportunity to work with powerful content, provided by Solution Park . You can create various documents with no need to look for the necessary elements for your diagrams in other software products.HelpDesk
How to Insert a Mind Map into Microsoft Word Document
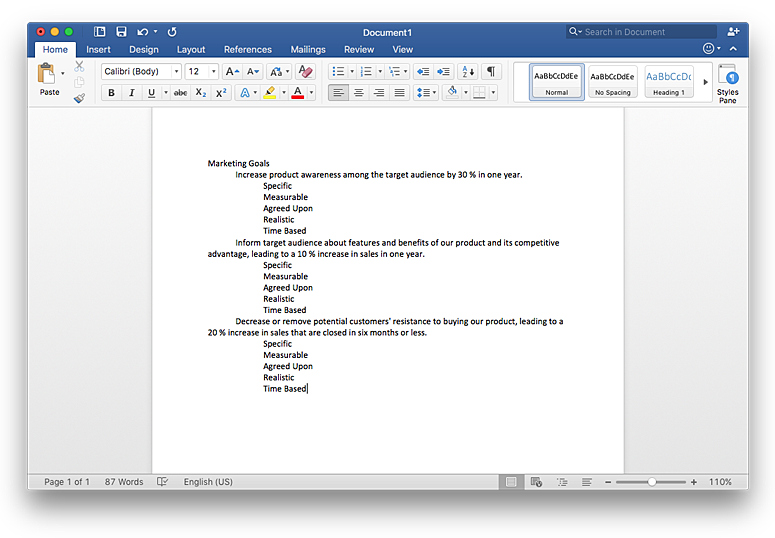
ConceptDraw MINDMAP offers several options of converting your mind map to MS Word document. You can choose the proper format that meets your needs to communicate content of your mind maps. Generate text, presentations, images or web pages that are pertinent to your work. Primary, you can export a mind map to MS Word. This method allows stylizing the document by using a custom MS Word templates. If you need to combine text and hierarchically structured information in a single document, the best solution is to incorporate a mind map into the MS Word document using the copy-paste capabilities of ConceptDraw MINDMAP.
 Pie Charts
Pie Charts are extensively used in statistics and business for explaining data and work results, in mass media for comparison (i.e. to visualize the percentage for the parts of one total), and in many other fields. The Pie Charts solution for ConceptDraw PRO v10 offers powerful drawing tools, varied templates, samples, and a library of vector stencils for simple construction and design of Pie Charts, Donut Chart, and Pie Graph Worksheets.
 Event-driven Process Chain Diagrams
Event-driven Process Chain (EPC) Diagram is a type of flowchart widely used for modeling in business engineering and reengineering, business process improvement, and analysis. EPC method was developed within the Architecture of Integrated Information Systems (ARIS) framework.
 Line Graphs
How to draw a Line Graph with ease? The Line Graphs solution extends the capabilities of ConceptDraw PRO v10 with professionally designed templates, samples, and a library of vector stencils for drawing perfect Line Graphs.
 Picture Graphs
Typically, a Picture Graph has very broad usage. They many times used successfully in marketing, management, and manufacturing. The Picture Graphs Solution extends the capabilities of ConceptDraw PRO v10 with templates, samples, and a library of professionally developed vector stencils for designing Picture Graphs.
- Office Visio 2007
- Microsoft Office Visio 2007
- Microsoft Office Visio Professional 2007
- Design elements - Azure architecture - Microsoft products | Microsoft ...
- How to Open MS Visio ® 2013/2016 Files on a Mac® Using ...
- Microsoft Office 2013 With Visio
- Microsoft Office Visio 2007 Free Download
- It Microsoft Office
- ConceptDraw PRO Compatibility with MS Visio | How to Convert MS ...
- How to Open Visio ® VDX File Using ConceptDraw PRO | How to ...
- In searching of alternative to MS Visio for MAC and PC with ...
- How to Convert MS Visio ® 2010 VSD File to ConceptDraw PRO v10 ...
- Microsoft Office Visio Save As Pictures
- Project Exchange | ConceptDraw PRO Compatibility with MS Visio ...
- Microsoft Office Visio Viewer
- Microsoft Office Visio Free Download
- How to Convert ConceptDraw PRO file into MS Visio 2010 format ...
- Microsoft Office Visio Online
- Microsoft Visio Office


