IDEF3 Standard
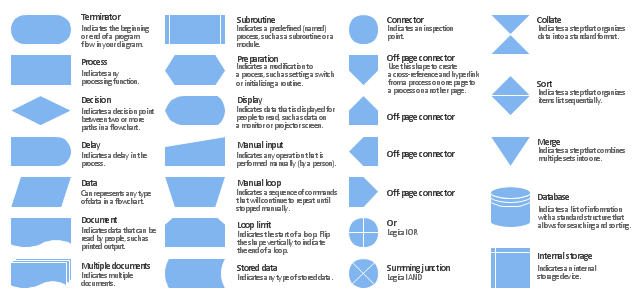
Use Case Diagrams technology. IDEF3 Standard is intended for description and further analysis of technological processes of an enterprise. Using IDEF3 standard it is possible to examine and model scenarios of technological processes.The vector stencils library "Flowchart" contains 26 symbols for drawing the flow charts using the ConceptDraw PRO diagramming and vector drawing software.
"Flowcharts are used in designing and documenting complex processes or programs. Like other types of diagrams, they help visualize what is going on and thereby help the viewer to understand a process, and perhaps also find flaws, bottlenecks, and other less-obvious features within it. There are many different types of flowcharts, and each type has its own repertoire of boxes and notational conventions. The two most common types of boxes in a flowchart are:
(1) a processing step, usually called activity, and denoted as a rectangular box;
(2) a decision, usually denoted as a diamond.
A flowchart is described as "cross-functional" when the page is divided into different swimlanes describing the control of different organizational units. A symbol appearing in a particular "lane" is within the control of that organizational unit. This technique allows the author to locate the responsibility for performing an action or making a decision correctly, showing the responsibility of each organizational unit for different parts of a single process. ...
Common alternate names include: flowchart, process flowchart, functional flowchart, process map, process chart, functional process chart, business process model, process model, process flow diagram, work flow diagram, business flow diagram. The terms "flowchart" and "flow chart" are used interchangeably." [Flowchart. Wikipedia]
The example "Design elements - Flowchart" is included in the Flowcharts solution from the area "What is a Diagram" of ConceptDraw Solution Park.
HelpDesk
How to Draw the Different Types of Pie Charts
Using the Pie Chart, you can visually estimate the relative contribution that different data categories contribute to a whole value. The pie chart displays the statistics in a visual format. The main use of pie charts to show comparisons. The larger piece of the pie, the more the value of this value compared to the rest. Various applications of pie charts can be found in business and education. For business, pie charts can be used to compare the success or failure of the goods or services. They may also be used to display the business market share.- Types of Flowcharts | Types of Flowchart - Overview | Basic ...
- Explain The Two Types Of Flow Charts
- Two Types Of Flowchart
- What Are Two Types Of Flowchart
- Types of Flowcharts | Basic Flowchart Symbols and Meaning ...
- Define Various Types Of Boxes In Flow Chart And Their Uses
- Names Of Different Types Of Boxes In Flow Chart
- List And Explain The Type Of Flow Chart
- Various Types Of Boxes Used In The Flow Chart What Are There
- Various Types Of Box Used In Flow Chart Every Box With Explain
- List And And Explain Types Of Flowchart We Have
- Name The Various Types Of Resources With Flow Chart
- Types of Flowchart - Overview | Basic Flowchart Symbols and ...
- Flowchart Two Options
- Euclidean algorithm - Flowchart | Basic Flowchart Symbols and ...
- Swim Lane Diagrams | Cross-Functional Flowchart (Swim Lanes ...
- 4 Level pyramid model diagram - Information systems types | 5 Level ...
- Diffrent Types Of Flow Chart
- Basic Flowchart Symbols and Meaning | Flowchart design ...


