HelpDesk
How to Make Network Diagram
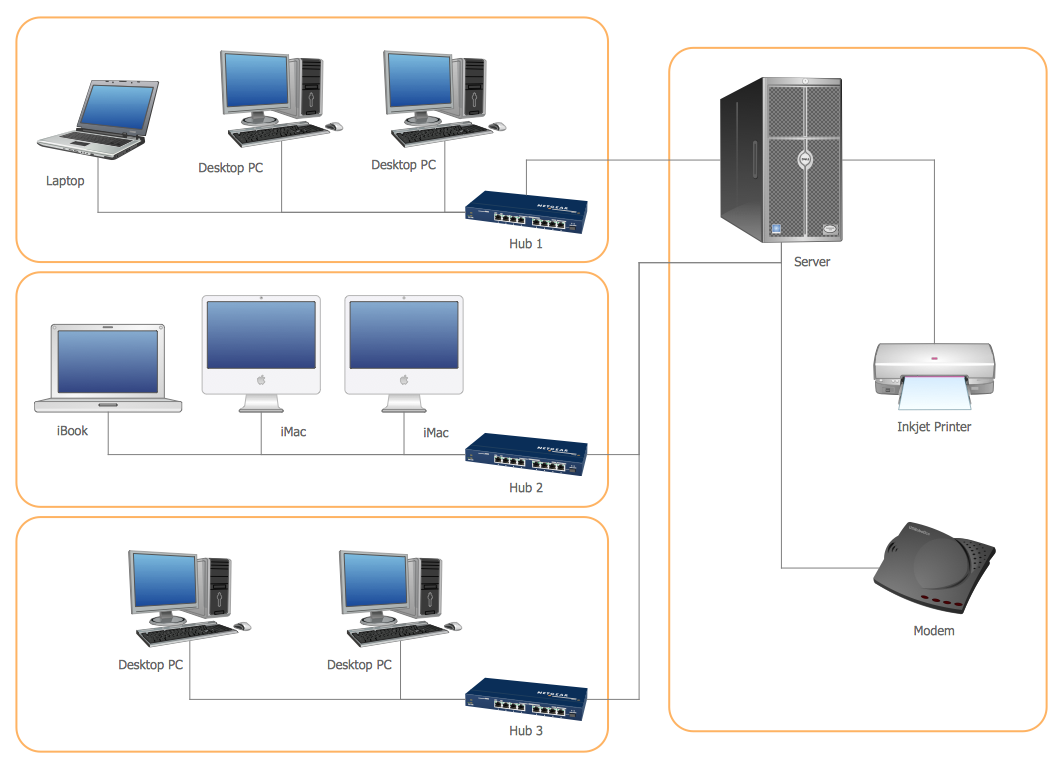
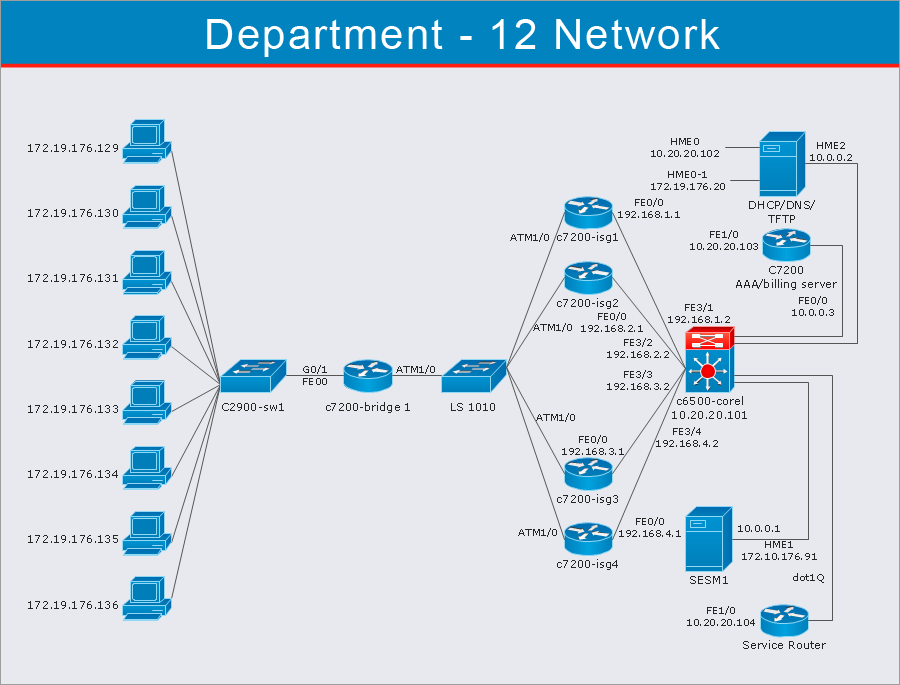
ConceptDraw PRO allows you to represent and communicate network architecture, topology, and design to engineers, stakeholders and end-users.
 ConceptDraw Solution Park
ConceptDraw Solution Park collects graphic extensions, examples and learning materials
HelpDesk
How to Add conceptdraw.com Domain to Custom Safe Senders List
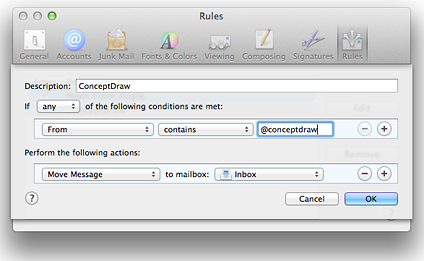
Instruction on how to add the csodessa to your safe senders list in order to help ensure that you receive CS Odessa email that confirms your successful registration.HelpDesk
How to Draw a Chemical Process Flow Diagram
Process Flow Diagram widely used in modeling of processes in the chemical industry. A Chemical Process Flow diagram (PFD) is a specialized type of flowchart. With the help of Chemical Process Flow Diagram engineers can easily specify the general scheme of the processes and chemical plant equipment. Chemical Process Flow Diagram displays the real scheme of the chemical process, the relationship between the equipment and the technical characteristics of the process. Chemical Process Flow Diagram illustrates the connections between the basic equipment as well as the overall structure of pipelines and other supporting equipment. The purpose of the PFD is to build the image of the basic idea of the chemical process. ConceptDraw PRO together with its Chemical and Process Engineering solution delivers the possibility to design Chemical Process Flow diagrams. It is designed for chemical industry engineers and designers.HelpDesk
How to Manage a Multiple Project Participants Responsibilities with To-Do Mind Maps
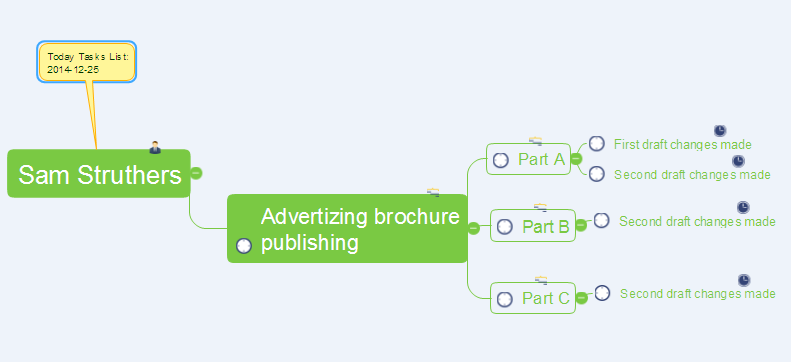
All project participants are kept informed of their responsibilities in projects and can detail their tasks in a creative mind map format.HelpDesk
How to Edit a Project Task List
A list of a project tasks is core to any project plan. It is the basic part of a project schedule. The project task list should include all of the work associated with fulfilling the project on time. Having an entire and complete task list, the project manager will be able to estimate the costs and resources, necessary to implement the project. The project task list creation is a key piece of project management. The list of project tasks have include activities, should be performed, and the sequence in which tasks need to be completed.HelpDesk
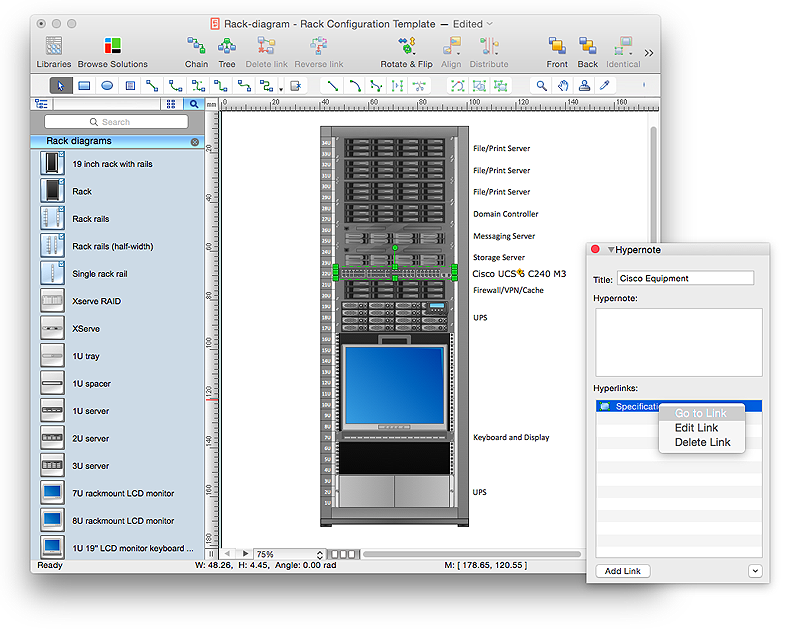
How to Create a Rack Diagram in ConceptDraw PRO
A Rack Diagram represents the rack mounting of network and computer equipment that is installed as a server. Rack diagrams are used by system administrators and network architectors when making a decision regarding the purchase of network equipment. It is used to show how a particular server configuration can be composed, without making its physical installation. ConceptDraw PRO enhanced with the Rack Diagrams Solution can be successfully used for making various rack diagrams. It's important that the solution used to create a rack diagram contains templates that stick to industry standards, and supplies a big selection of device icons to cover multiple types of equipment for a number of network configurations.Network Diagram Software
ConceptDraw Network Diagram Software - Network design software for network drawings with abundant examples and templates. Create computer network designs, diagrams and schematics using ConceptDraw.
Design Element: Basic Network for Network Diagrams
ConceptDraw PRO is perfect for software designers and software developers who need to draw Basic Network Diagrams.
HelpDesk
How to Determine what Information to be Displayed in the Project Resource List
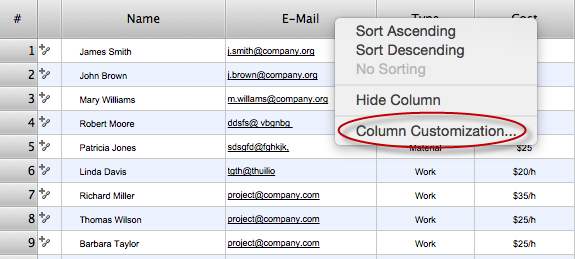
After you create a project task list it is necessary move to resource planning. You need to determine and assign resources on each task. There are several types of resources defined in ConceptDraw PROJECT: work, material, cost and equipment. The columns of a project Resource List in ConceptDraw PROJECT displays the information you need to capture about each resource in your project.
HelpDesk
What Information to be Displayed in the ConceptDraw PROJECT Gantt Chart View
What information can can contain the project task list? Gantt Chart view is a graphical representation of a project outline that allows one to allocate tasks.You can customize a project’s tasks list view to include the columns you need to meet your information requirements. The columns of the ConceptDraw PROJECT Gantt view contain the information you want to capture about each task in your project. The following article details what information can be contained in the columns of a project outline:<
HelpDesk
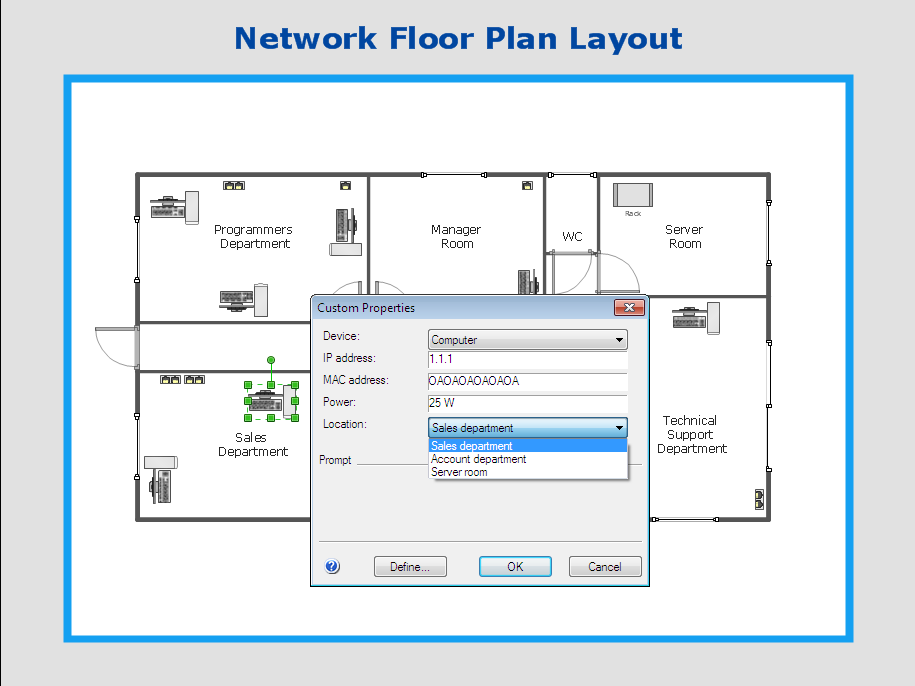
How to Work with Custom Properties in ConceptDraw PRO on PC
ConceptDraw PRO can store additional, user-defined data that can be assigned to a particular shape. This data is stored in the Custom Properties options.HelpDesk
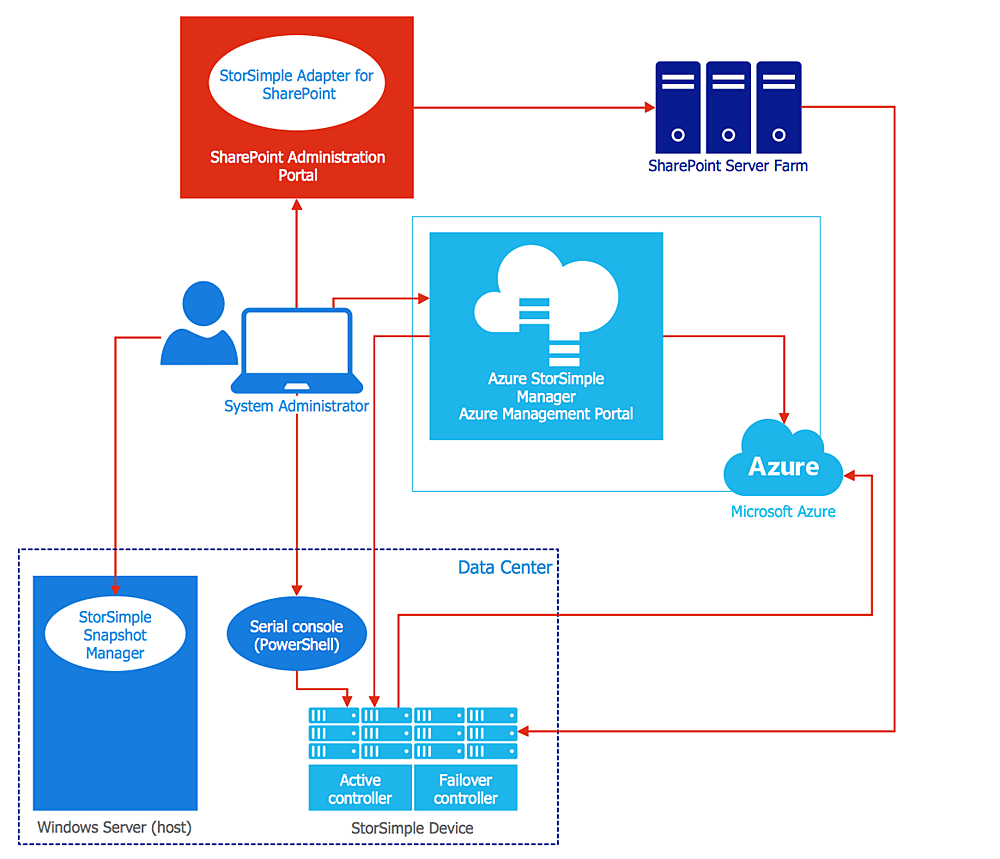
How to Create an Azure Architecture Diagram Using ConceptDraw PRO
Microsoft Azure is an open cloud computing platform, designed by Microsoft. It provides the ability to develop and launch applications and to store data on servers in distributed data centers. Microsoft Azure cloud offers two models - platform as a service (PaaS) and infrastructure as a service (IaaS). The efficiency of the Windows Azure platform is supported by a global network of Microsoft data centers. Developers use Azure Architecture diagrams to visualize and document the architecture of applications bases on Microsoft Azure services. Using the ConceptDraw Azure Architecture solution makes much easier the work on documenting the Microsoft Azure architecture.HelpDesk
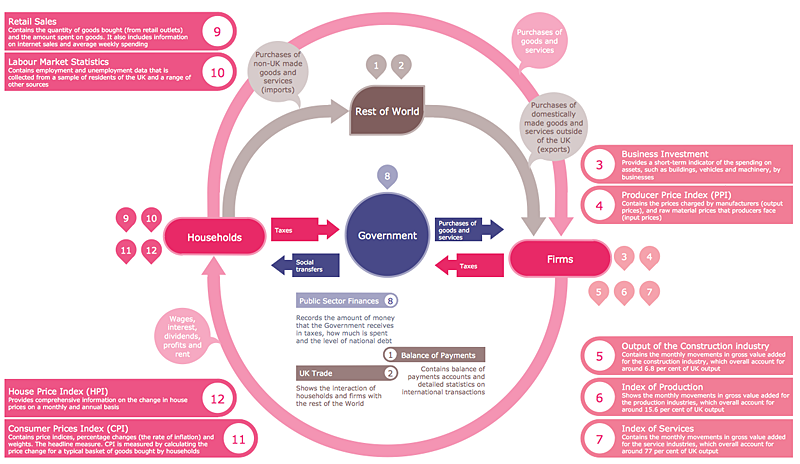
How to Create a Typography Infographic Using ConceptDraw PRO
Infographics are a good way to visually share knowledge , to communicate information and illustrate a message. Typography Infographics can help to present at a glance a large pack of complex information in a clear and vivid manner. Designers use the elements of typography Infographics to compose a graphic presentation of an information that is intended to depict the information behind the numbers in a creative and interesting visual way. Each infographic element is used to depict and explain an idea of the current portion of information. Each infographic element must inform its message clearly. ConceptDraw PRO provides the ability to design different kinds of typography infographics. You can use ConceptDraw Typography Infographics solution to create typography infographics effortlessly and quickly using the special set of vector stencils libraries.HelpDesk
How to Create SWOT Analysis Template Using ConceptDraw PRO
SWOT-analysis is used to develop a marketing strategy. SWOT-analysis includes determining the strengths and weaknesses in the company's activity, potential external threats and opportunities and assesses their relative strategic competitors. ConceptDraw SWOT and TOWS Matrix Diagrams solution provide a set of SWOT matrix in which should be recorded and then compared the strengths and weaknesses of the enterprise and the market opportunities and threats. This comparison allows you to determine what steps can be taken for the development of your company and what problems need to be addressed urgently.HelpDesk
How to Create a Mechanical Diagram
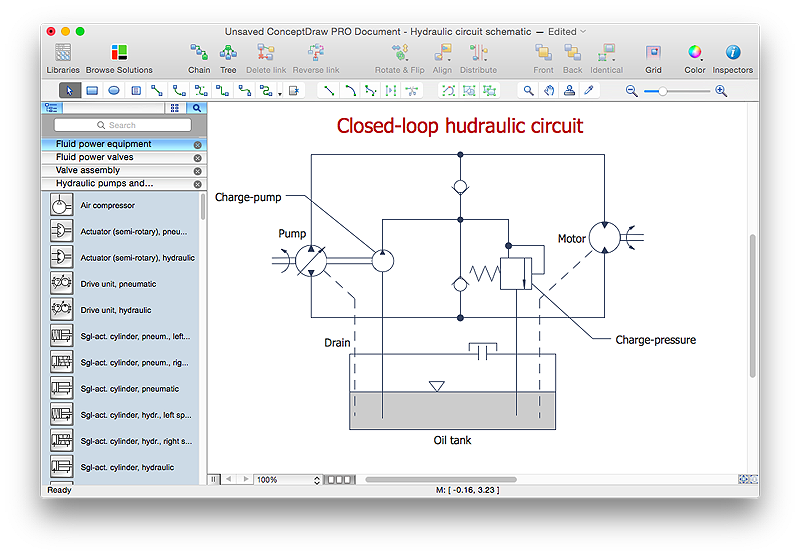
Mechanical Engineering drawing is a type of technical drawing that helps analyze complex engineering systems. Mechanical Engineering diagrams are often a set of detailed drawings used for engineering or construction projects. Making Mechanical Engineering diagram involves many different elements that can be managed using ConceptDraw PRO. You can design elements for drawing parts, assembly, pneumatic, and hydraulic systems for mechanical engineering. With ConceptDraw PRO you can easily create and communicate the Mechanical Engineering diagram of any complexity.- Computer Networking Tools List | Design elements - Network layout ...
- Computer Networking Tools List | Cisco network diagram template ...
- Computer Networking Tools List | Seven Management and Planning ...
- Computer Networking Tools List | ConceptDraw PRO Network ...
- Computer Networking Tools List | Computer and Networks Area ...
- Computer Networking Tools List | ConceptDraw Solution Park ...
- Computer Networking Tools List | How to Make Network Diagram ...
- Computer Networking Tools List | Personal area (PAN) networks ...
- Computer Networking Tools List | ConceptDraw Solution Park ...
- Computer Networking Tools List | ConceptDraw Solution Park ...
- Computer Networking Tools List | Find out what amount and type of ...
- Computer Networking Tools List | Active Directory Diagram ...
- Computer Networking Tools List | Network Diagramming Software ...
- Computer Networking Tools List
- Computer Networking Tools List | UML Use Case Diagram Example ...
- ConceptDraw PRO Network Diagram Tool | Network Diagramming ...
- UML Diagram Types List | UML Notation | UML Diagrams with ...
- Cisco Network Diagrams | Cisco Network Topology. Cisco icons ...
- Networking Tools And Uses
- Cisco Design | How to Make Network Diagram | Active Directory ...


.png)
