Soccer (Football) Formation
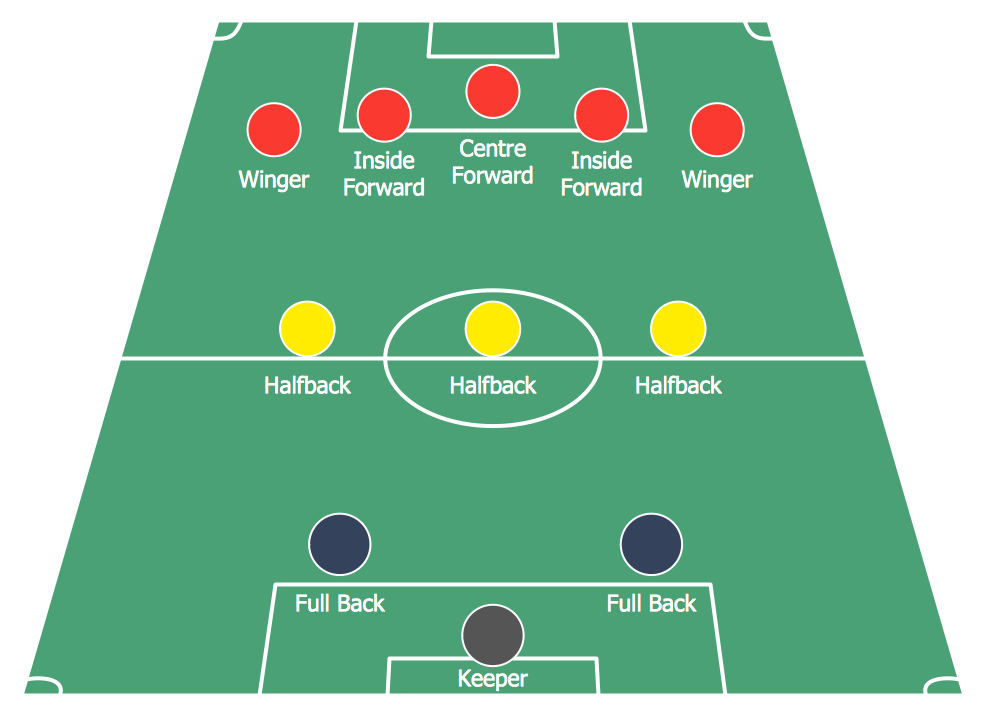
Using diagrams is the easiest way to explain the soccer formations. The Soccer solution from the Sport area of ConceptDraw Solution Park is designed as a tool that helps you produce the soccer diagrams in a few minutes. The predesigned samples of the Soccer solution for ConceptDraw PRO depict the most popular formation diagrams.Football – 2014 FIFA World Cup Standings Group
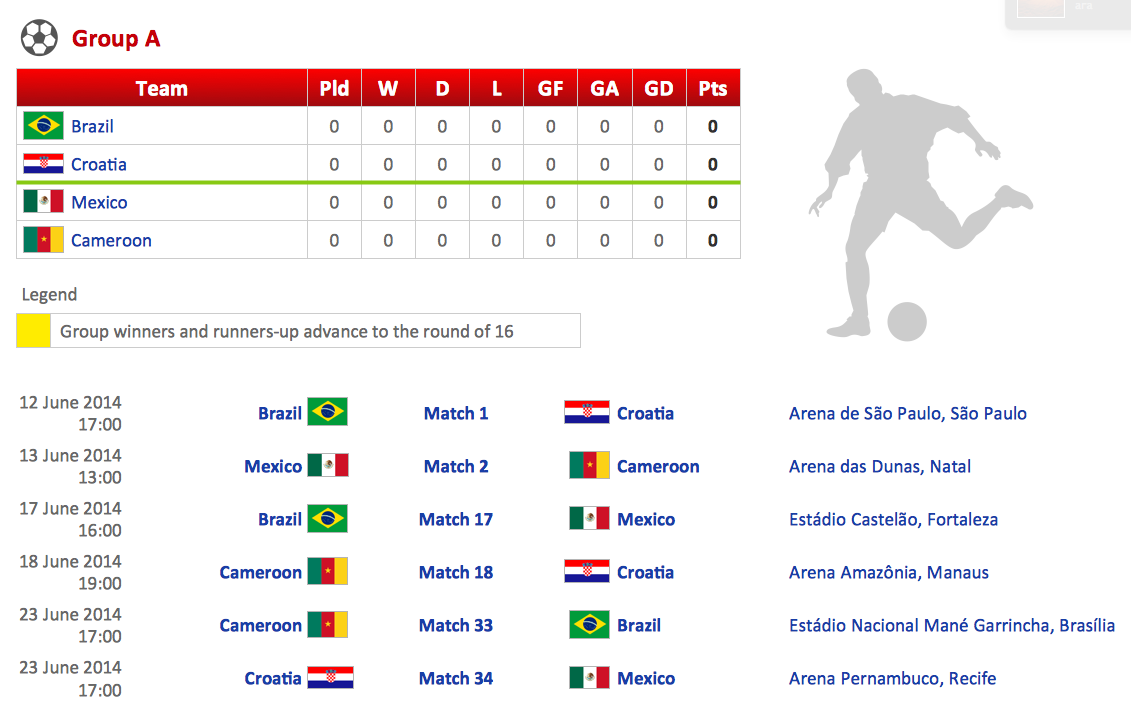
You can see the samples representing the 2014 FIFA World Cup schedules and tournament tables for each of eight groups. These samples was created in ConceptDraw PRO using the “FIFA World Cup 2014 team flags”, “Soccer pictograms” and “Soccer silhouettes” libraries from the Soccer solution from the Sport area of ConceptDraw Solution Park.Soccer (Football) Positions
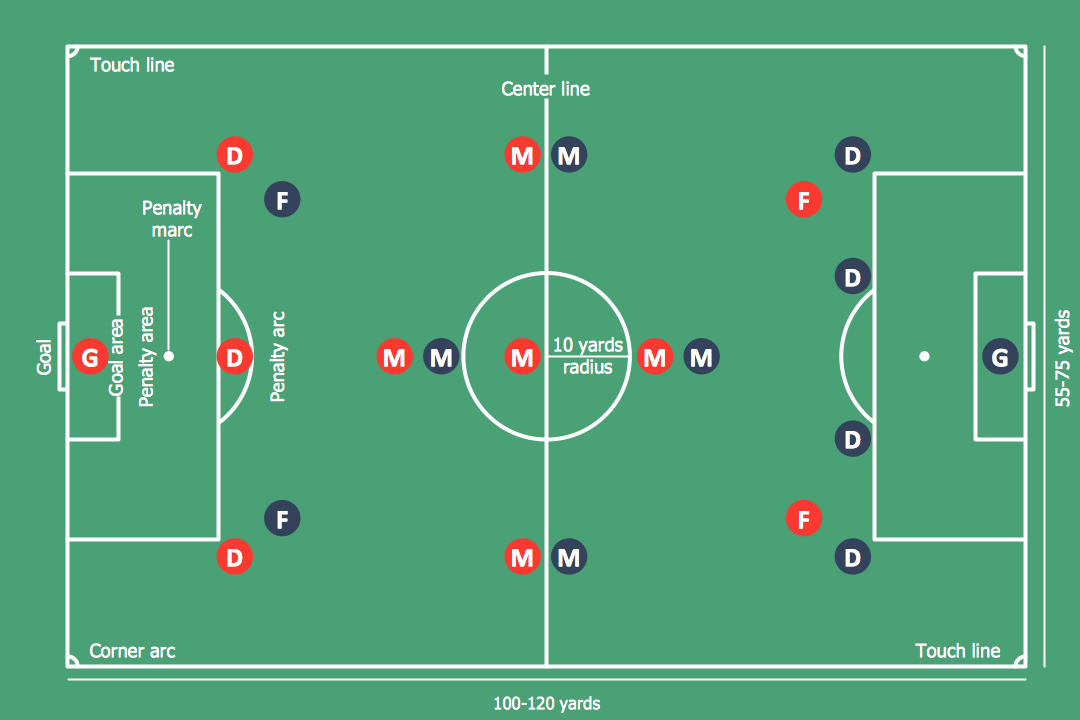
Explaining soccer positions becomes much more easier and time saving with visual drawings. ConceptDraw PRO software extended with the Soccer solution from the Sport area of ConceptDraw Solution Park is very useful tool that will help you design the soccer-related drawings of any complexity in minutes.HelpDesk
How to Draw a Pie Chart Using ConceptDraw PRO
A pie chart represents data, in a clear and easy to read round (pie) form. A circular pie chart is divided into sections (slice). Each "slice" depicts the It reflects the proportion of each component in the whole "pie". This type of chart is most often used for the visualization of statistical data. That is why pie charts are widely used in marketing. As pie charts show proportional proportional parts of a whole, they are good for various visual comparisons. For example, it is difficult to imagine a more intuitive way to show segmentation and market share. ConceptDraw PRO allows you to draw a simple and clear Pie Chart using the Pie Charts solution.
 Soccer
The Soccer (Football) Solution extends ConceptDraw PRO v9.5 (or later) software with samples, templates, and libraries of vector objects for drawing soccer (football) diagrams, plays schemas, and illustrations. It can be used to make professional looking
HelpDesk
How to Use ConceptDraw Sales Dashboard Solution
The interactive visual dashboard is a valuable tool for any sales team. Sales dashboard allows you to view and monitor sales indicators that are important for manager and sales staff . It helps to use the timely and reliable information to improve the quality of sales performance and increase sales revenues. ConceptDraw Sales Dashboard solution is a tool for both: sales manager and sales team. It provides the visualization of key performance indicators that are critical to the entire sales organization. The custom sales dashboard displays the real-time information on sales performance KPIs with the help of intuitive and easy-to-understand diagrams and charts. Sales Dashboard helps the entire team see where they are, and what needs to be done. With ConceptDraw PRO you can easily create a visual Sales Dashboard using Live Objects Technology.
HelpDesk
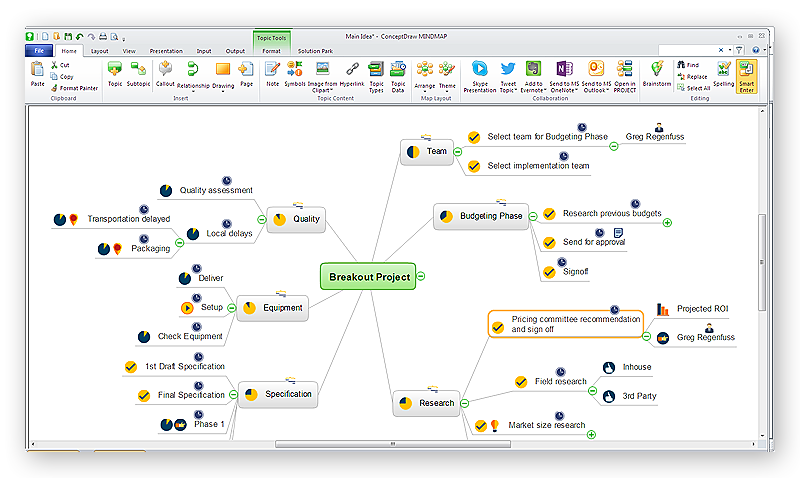
How to Create an Effective Mind Map Using Topic Types
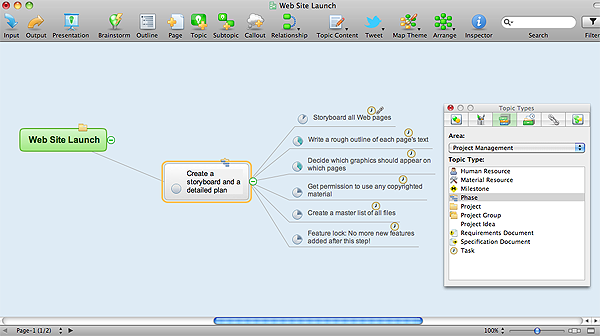
Tips on how to increase mind map effectiveness using Topic Types functionality, delivered with ConceptDraw MINDMAP.
HelpDesk
How to Draw the Different Types of Pie Charts
Using the Pie Chart, you can visually estimate the relative contribution that different data categories contribute to a whole value. The pie chart displays the statistics in a visual format. The main use of pie charts to show comparisons. The larger piece of the pie, the more the value of this value compared to the rest. Various applications of pie charts can be found in business and education. For business, pie charts can be used to compare the success or failure of the goods or services. They may also be used to display the business market share.
 Universal Diagramming Area
This area collects solutions for drawing diagrams, charts, graphs, matrices, geographic and road maps for education, science, engineering, business.
HelpDesk
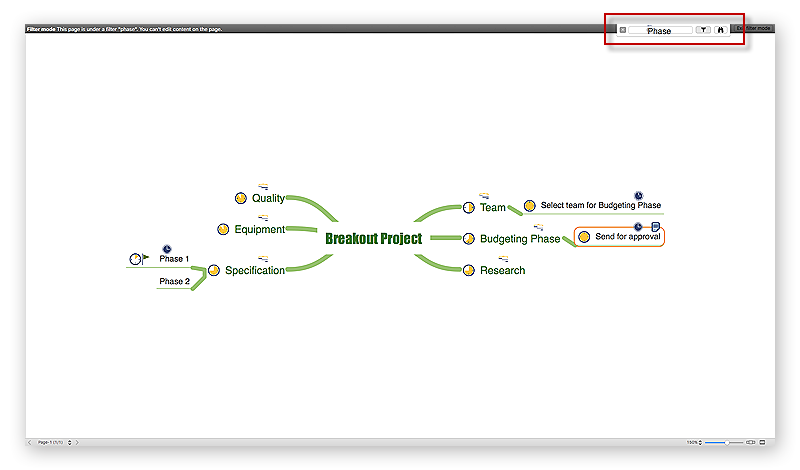
How to Use Mind Map Filtering in ConceptDraw MINDMAP
Many of us use mind maps for organizing, structuring or compiling our ideas or projects. Making mind map is the ability to take existing ideas and combine them in new ways. This is much easier to do when you can see all the ideas in front of you. Using mind maps for organizing and structuring information as the volume of data grows and the map expands can be a challenge. ConceptDraw MINDMAP allows you to sort and filter your mind map content even on the Full Screen.
 Ice Hockey
The Ice Hockey Solution extends the capabilities of ConceptDraw PRO v9.5 (or later) with samples, templates, and libraries of vector objects for drawing hockey diagrams, plays schemas, and illustrations. The Ice Hockey Solution can be used to make polishe
 ConceptDraw Solution Park
ConceptDraw Solution Park collects graphic extensions, examples and learning materials
 Histograms
How to make a Histogram? Making a Histogram is an incredibly easy process when it is done with ConceptDraw PRO. The Histograms Solution enhances ConceptDraw PRO v10 functionality with extensive drawing tools, numerous samples, and examples; also a quick-start template and library of ready vector stencils for visualization the data and professional drawing Histograms.
HelpDesk
How to Draw a Mind Map on PC Using ConceptDraw MINDMAP
Mind maps are useful forcapturing ideas, organizing and structuring information in a visual form, that is easier to understand, and easier to explain to others. Mind map consists of a general Main Idea surrounded by other related topics and subtopics, which are displayed in a radial hierarchical structure. Read this step-by-step guide on how to create a mind map using ConceptDraw MINDMAP for Windows.
- Soccer (Football) Formation | Association football ( soccer ) formation ...
- Website traffic dashboard | Website metrics - Visual dashboard ...
- How ONS statistics explain the UK economy Feb 2012 | Flowchart ...
- Functional Flow Block Diagram | How to Create an Event-driven ...
- Concept Draw Metrics
- Design Pictorial Infographics. Design Infographics | Design ...
- Diagramming | Data Flow Diagramm | ConceptDraw.com
- Baseball positions - Vector stencils library | General window ...
- ER Diagram Tool | Entity-Relationship Diagram (ERD) | Entity ...
- ConceptDraw Arrows10 Technology | How To Successfully Hold a ...
- Design elements - Composition charts and indicators | Composition ...
- Entity Relationship Diagram Software Engineering | Process ...
- UML activity diagram
- UML activity diagram - Template
- Professions - Vector stencils library | Basketball Field in the Vector ...
- Free-body diagram
- Spatial infographics Design Elements: Location Map | Design ...
- Pyramid Chart Examples | How to Draw a Pyramid Diagram in ...
- Ice Hockey Diagram – Defensive Strategy – Neutral Zone Trap ...
