Winter Sports. Olympic Games Infographics. Medal Table
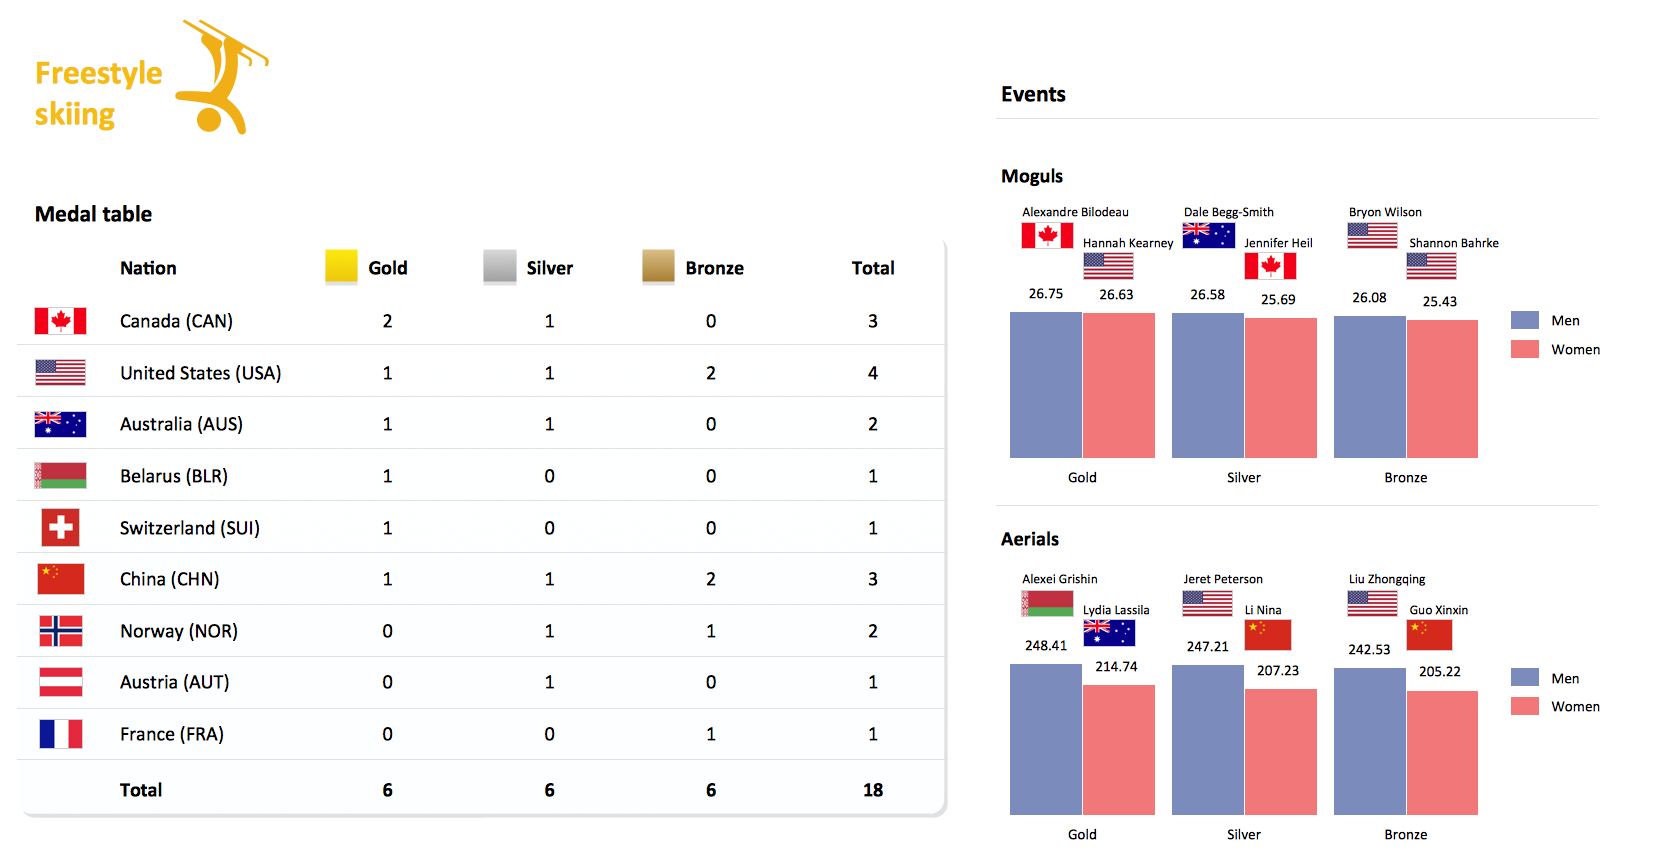
Visualizing data in infographics format is a modern way to represent any statistics related to global sporting events, such as Winter Olympic Games. ConceptDraw DIAGRAM software extended with the Winter Sports solution delivers a rich set of samples and templates helps you produce all kind of sporting information, such as tournament schedule or medal table.Winter Sports. Olympic Games Illustrations. Medal Summary
Do you like infographics and data visualization? Creating infographics is super-easy with ConceptDraw.
 Winter Sports
The Winter Sports solution from Sport area of ConceptDraw Solution Park contains winter sports illustration examples, templates and vector clipart libraries.
Winter Sports Vector Clipart. Medal Map. Spatial Infographics
Tracking Olympic results in visual format is the most modern way to deliver statistics to a broad audience. This is a good example of an illustrated table you may easily modify, print, or publish on web from ConceptDraw Winter Sports solution.Winter Sports. Using Winter Sports Design Elements Producing Infographics
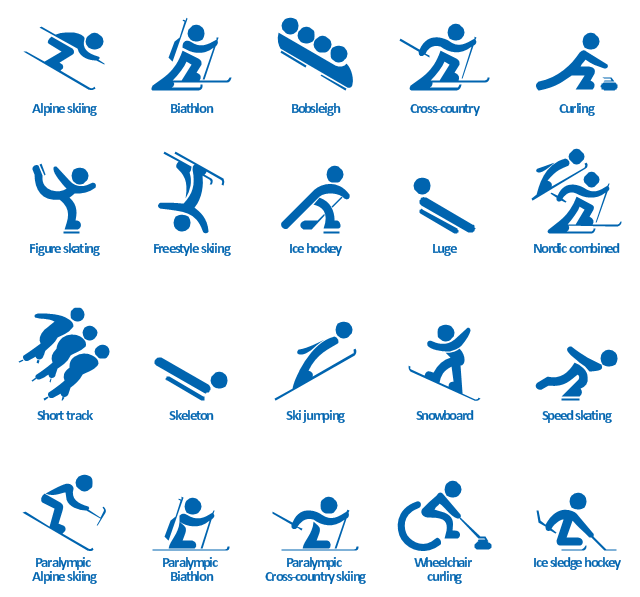
The Winter Sports solution from Sport Area of ConceptDraw Solution Park contains winter sports pictogram you may use illustrating any kind of material about Olympic Games or any other sport competitions.The vector stencils library "Winter sports pictograms" contains 20 symbols of Winter Olympic sports: Alpine skiing, Alpine skiing paralympic, Biathlon, Biathlon paralympic, Bobsleigh, Cross-country, Cross-country skiing paralympic, Curling, Wheelchair curling, Figure skating, Freestyle skiing, Ice hockey, Ice sledge hockey, Luge, Nordic combined, Short track, Skeleton, Ski jumping, Snowboard, Speed skating.
The design elements library "Winter sports pictograms" for the ConceptDraw PRO diagramming and vector drawing software is included in the Winter Sports solution from the Sport area of ConceptDraw Solution Park.
The design elements library "Winter sports pictograms" for the ConceptDraw PRO diagramming and vector drawing software is included in the Winter Sports solution from the Sport area of ConceptDraw Solution Park.
"A 'Luge' ... is a small one- or two-person sled on which one sleds supine (face up) and feet-first. Steering is done by flexing the sled's runners with the calf of each leg or exerting opposite shoulder pressure to the seat. ... Luge is also the name of an Olympic sport. Of the three Olympic sliding sports, which include bobsleigh and skeleton, luge is the fastest and most dangerous. Lugers can reach speeds of 140 km per hour (87 mph). ...
Street luge is a recent innovation of the sport. It is considered an extreme sport, as well as an Olympic sport.
Lugers compete against a timer and are timed to a thousandth of a second, making luge one of the most precisely timed sports in the world." [Luge. Wikipedia]
The vector icon example "Luge" represents one of 20 symbols from the Winter sports pictograms library for the ConceptDraw PRO diagramming and vector drawing software.
The design elements library Winter sports pictograms is included in the Winter Sports solution from the Sport area of ConceptDraw Solution Park.
"Speed skating, or speedskating, is a competitive form of ice skating in which the competitors race each other in traveling a certain distance on skates. Types of speed skating are long track speed skating, short track speed skating, and marathon speed skating. In the Olympic Games, long-track speed skating is usually referred to as just "speed skating", while short-track speed skating is known as "short track". The ISU, the governing body of both ice sports, refers to long track as "speed skating" and short track as "short track skating". ...
The sport originates from pack-style events held in North America and was officially sanctioned in the 1970s, becoming an Olympic sport in 1992. Although this form of speed skating is newer, it is growing faster than long-track speed skating, largely because short track can be done on an ice hockey rink rather than a long-track oval." [Speed skating. Wikipedia]
The vector icon example "Speed skating" represents one of 20 symbols from the Winter sports pictograms library for the ConceptDraw PRO diagramming and vector drawing software.
The design elements library Winter sports pictograms is included in the Winter Sports solution from the Sport area of ConceptDraw Solution Park.
Spatial infographics Design Elements: Transport Map
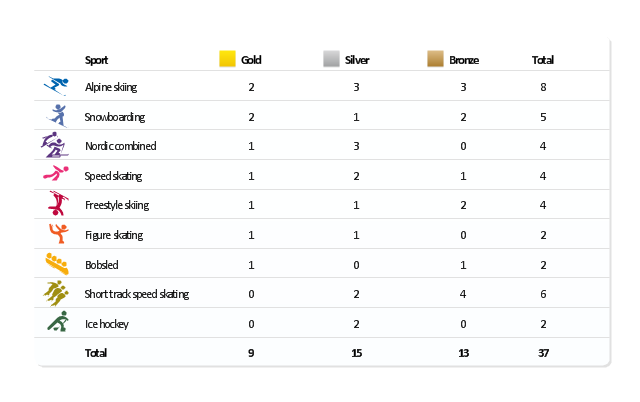
Do you like infographics and data visualization? Creating infographics is super-easy with ConceptDraw."The United States participated in the 2010 Winter Olympics in Vancouver, British Columbia, Canada. The U.S. team had a historic Winter Games, winning an unprecedented 37 medals. Team USA's medal haul, which included nine gold, marked the first time since the 1932 Lake Placid Games that the U.S. earned more medals than any other participant. ...
The United States finished the 2010 Olympic Games by setting a new record for the most medals won by a single country at a Winter Olympics. The previous record of 36 was set by Germany at the 2002 Winter Olympics; with the silver medal won by the men's hockey team in the final Olympic event of 2010, the U.S. earned their 37th medal of the Vancouver Games. In addition, the U.S. team set a Winter Games record for bronze medals with 13, and the 15 silver medals by the U.S. was second only to the record of 16 set by Germany in 2002." [United States at the 2010 Winter Olympics. Wikipedia]
This medal table example "US at the 2010 Winter Olympics" is created using the ConceptDraw PRO diagramming and vector drawing software extended with the Winter Sports solution.
The Winter Sports solution from the Sport area of ConceptDraw Solution Park contains the vector stencils library "Winter sports pictograms" and examples of diagrams and infographics.
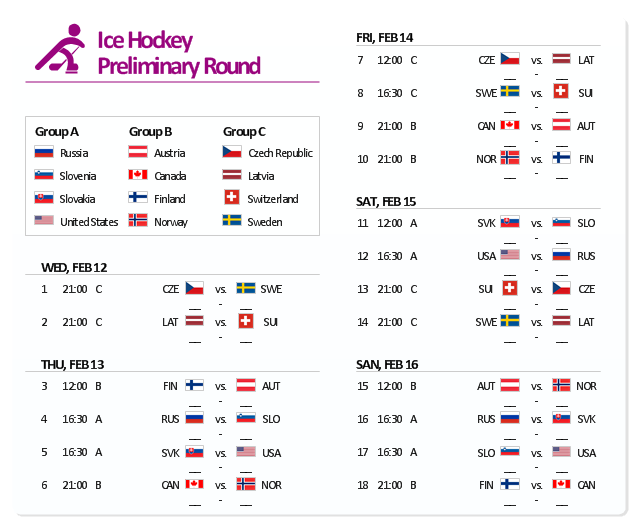
The example "Sochi 2014 Olympics - Men’s hockey tournament schedule" represent Ice Hockey schedule of XXII Olympic Winter Games according to Sochi2014.com website. [sochi2014.com/ en/ ice-hockey-schedule-and-results]
"The 2014 Winter Olympics, officially the XXII Olympic Winter Games, or the 22nd Winter Olympics, are scheduled to take place from 6 to 23 February 2014, in Sochi, Russia, with some events held in the resort town of Krasnaya Polyana. Ninety-eight events in fifteen winter sports will be held. Both the Olympics and 2014 Winter Paralympics are being organized by the Sochi Organizing Committee (SOC). ...
The events of the 2014 Winter Olympics will be held around two clusters of new venues; an Olympic Park was constructed in the Imeretinsky Valley on the coast of the Black Sea, with Fisht Olympic Stadium and the Games' indoor venues located within walking distance, and snow events will be held at Krasnaya Polyana." [2014 Winter Olympics. Wikipedia]
The example "Sochi 2014 Olympics - Men’s hockey tournament schedule" was created using the ConceptDraw PRO diagramming and vector drawing software extended with the Winter Sports solution. The Winter Sports solution from the Sport area of ConceptDraw Solution Park contains the vector stencils library "Winter sports pictograms" and examples of diagrams and infographics.
Design Pictorial Infographics. Design Infographics
In the course of recent decades data visualization went through significant development and has become an indispensable tool of journalism, business intelligence and science. The way visual information may be conveyed is not limited simply to static or dynamic representation, it can also be interactive. Infographics can be conditionally divided into several general levels. Primarily, this is level of visualization of information, its interpretation and association on any ground. Second level can be defined as a visualization of knowledge, depiction of thoughts and ideas in the form of images or diagrams. Finally, the level of data visualization, which processes data arrays in charts, enabling the information to be more clearly perceived. You can also identify the main approaches to the creation of infographics: exploratory and narrative. Exploratory method insists on minimalist design in favor of data precision without unnecessary details and is common for scientific researches and anaFlowchart
The Flowcharts are widespread in various fields and include the multitude of types. They are dedicated to representation the algorithms, processes, workflows of any complexity in a clear and intuitive format. The Flowcharts are commonly used in software development as a visual tool for illustration algorithms and logic of computer programs, in business for illustration business scenarios, in education, and so on. For drawing the Flowchart are used the special object blocks, among them rectangle or box used to represent an activity or step, rounded box or oval to depict Start / End, diamond to represent the decision point (involves the branching yes/no), circle used to represent the point of connection, parallelogram to represent the Input / Output, and some others. With ConceptDraw DIAGRAM including Flowcharts solution it is easy to create professional-looking Flowchart diagrams of any complexity and any degree of detailing. Succeed in drawing the Flowcharts using quick-start templates, predesigned samples and extensive libraries of ready-made flowchart symbols, blocks and icons.The vector stencils library "Winter Olympics pictograms" contains 29 pictograms and silhouettes.
Use it for drawing Winter Olympics diagrams, infographics and illustrations in the ConceptDraw PRO diagramming and vector drawing software extended with the Winter Sports solution from the Sport area of ConceptDraw Solution Park.
Use it for drawing Winter Olympics diagrams, infographics and illustrations in the ConceptDraw PRO diagramming and vector drawing software extended with the Winter Sports solution from the Sport area of ConceptDraw Solution Park.
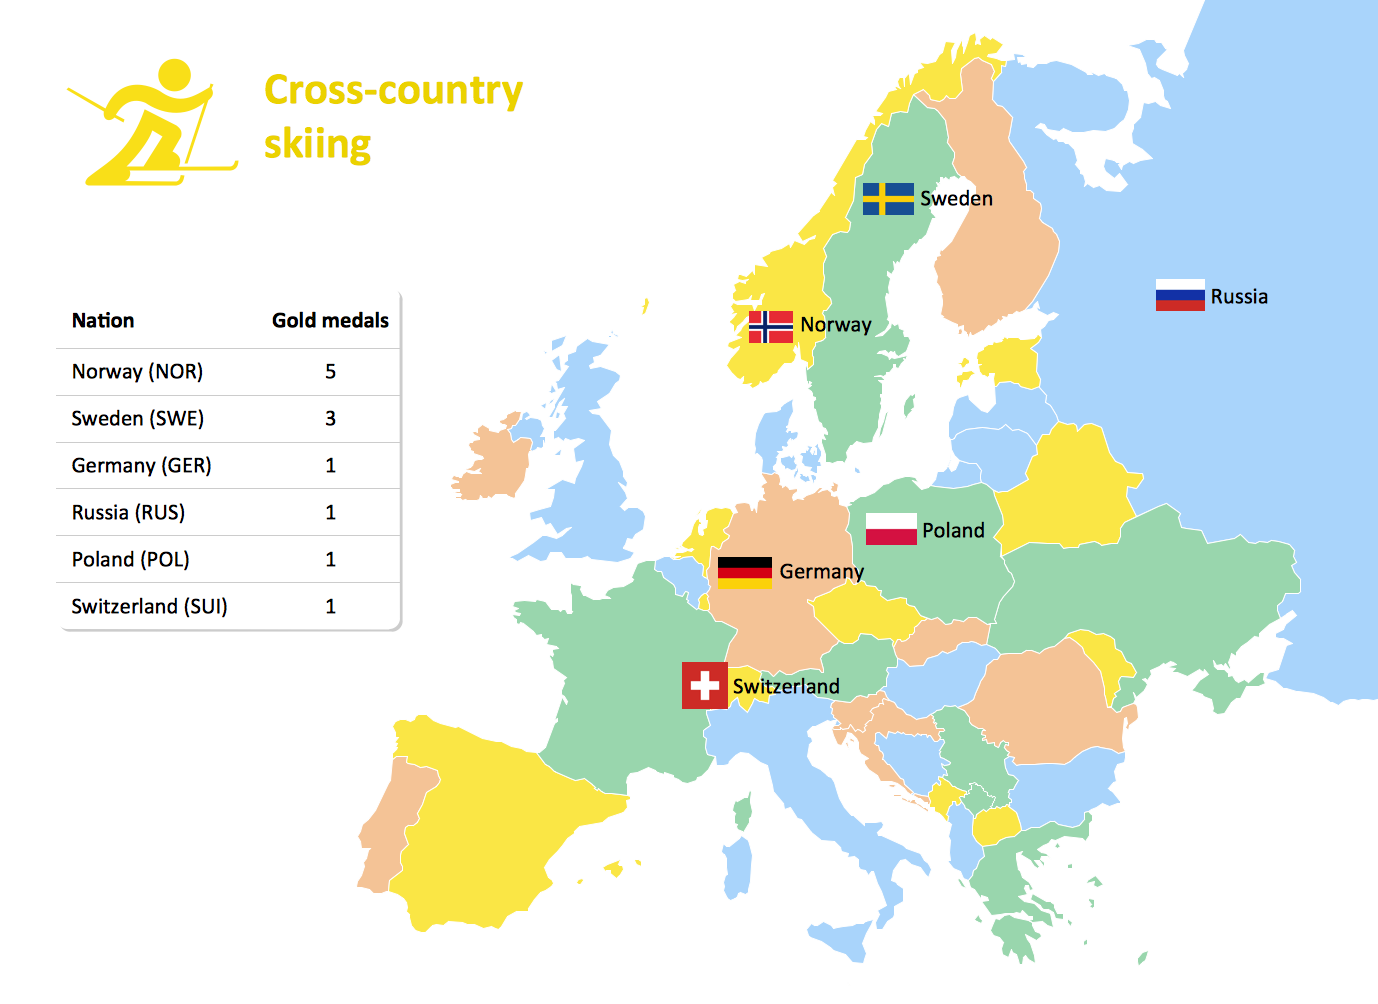
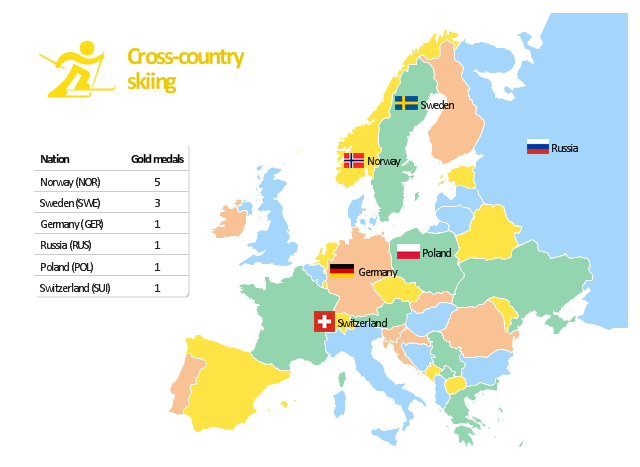
"The cross-country skiing competition of the 2010 Winter Olympics in Vancouver were held at Whistler Olympic Park. The events were held between 15 and 28 February 2010. ...
Across the twelve cross-country skiing events, a maximum of 310 athletes are allowed to compete. No nation can have more than 20 skiers competing, with an additional limit of 12 men or 12 women per specific nation. For each event, a nation can enter four skiers in individual events and one team in relay races." [Cross-country skiing at the 2010 Winter Olympics. Wikipedia]
The Europe map example "Cross-country skiing gold medals - 2010 Winter Olympics" is created using the ConceptDraw PRO diagramming and vector drawing software extended with the Winter Sports solution.
The Winter Sports solution from the Sport area of ConceptDraw Solution Park contains the vector stencils library "Winter sports pictograms" and examples of diagrams and infographics.
- Luge - Winter sports pictograms | Olympic Sport Symbols With Names
- Luge - Winter sports pictograms | Winter Olympics Sports Symbols ...
- Sports Symbol
- Sports Symbols
- Olympic Sports Symbol
- Olympic Symbols For Sports
- Design elements - Winter sports pictograms | Winter Sports | Olympic ...
- Sport pictograms. Olympic Games | Design elements - Winter ...
- Olympics Winter Sports Symbols
- Olympic Symbol For Figure Skating
- Winter Sports | Symbol Of Olympic Figure Skating
- Bobsleigh - Winter sports pictograms | Skeleton - Winter sports ...
- Winter Sports | Design elements - Winter sports pictograms ...
- Flow Chart for Olympic Sports | Sochi 2014 Olympics - Men's hockey ...
- Freestyle skiing - Winter sports pictograms | Winter Sports | Olympic ...
- Winter Olympics pictograms - Vector stencils library | Luge - Winter ...
- Bobsleigh - Winter sports pictograms | Winter Sports | Skeleton ...
- Speed skating - Winter sports pictograms | Design elements - Winter ...
- Flow Chart for Olympic Sports | Winter Sports Vector Clipart. Medal ...
