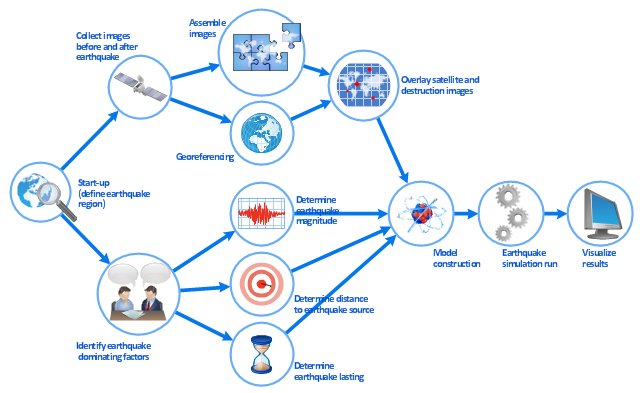
This work flow chart sample was redesigned from the picture "Simulation for earthquake disaster assessment" from the article "Simulation Workflows".
[iaas.uni-stuttgart.de/ forschung/ projects/ simtech/ sim-workflows.php]
" This simulation was developed to have an in depth understanding of the destructions and the decisions to be made in various phases of crisis management (Source: Mahdi Hashemi and Ali A. Alesheikh (2010). "Developing an agent based simulation model for earthquakes in the context of SDI." GSDI 12 World Conference. 19 – 22 October 2010. Singapour). The simulation process contains following major steps:
(1) All spatial information including satellite images (before and after the earthquake) and topographic/ cadastral maps of the area are mosaicked and georeferenced. The parts of the city that contain various levels of destructions are selected. Three types of features namely buildings, roads and recreational areas are classified and extracted from the satellite images.
(2) The governing factors of destructions are identified; a mathematical model that integrates the factors is constructed.
(3) The simulation is constructed for various parameter values (different earthquake strength, time elapses, etc.)" [iaas.uni-stuttgart.de/ forschung/ projects/ simtech/ sim-workflows.php]
The example "Workflow diagram - Earthquake disaster assessment" was drawn using the ConceptDraw PRO diagramming and vector drawing software extended with the Workflow Diagrams solution from the Business Processes area of ConceptDraw Solution Park.
 Workflow Diagrams
Workflow Diagrams solution extends ConceptDraw PRO software with samples, templates and vector stencils library for drawing the work process flowcharts.
 Flowcharts
The Flowcharts Solution for ConceptDraw PRO v10 is a comprehensive set of examples and samples in several different color themes for professionals that need to graphically represent a process. Solution value is added by basic flow chart template and shapes' library of Flowchart notation. ConceptDraw PRO flow chart creator lets one depict a processes of any complexity and length, as well design of the flowchart either vertically or horizontally.
HelpDesk
How To Create a PERT Chart
Project Evaluation and Review Technique (PERT) is a method of project tasks evaluation and analysis. PERT - is a method of analyzing the tasks required to complete the project. It includes analysis of the time required to complete each task, as well as the determination of the time required to carry out the whole project. PERT was developed to facilitate the planning of huge and complex projects. PERT is used for very large, complex, and non-standard projects. Technology implies the presence of uncertainty, making it possible to develop a schedule of the project without a precise information on details and time required for all of its components. The most popular part of PERT is a method of the critical path, based on the construction of the network schedule (PERT network diagram). ConceptDraw Office delivers you the best way to create PERT chart for your project using compatibility between ConceptDraw PROJECT and ConceptDraw PRO.
 HR Flowcharts
Human resource management diagrams show recruitment models, the hiring process and human resource development of human resources.
- Food security assessment - Flowchart | Example of DFD for Online ...
- Food security assessment - Flowchart | Flow chart Example ...
- Example of DFD for Online Store (Data Flow Diagram) DFD ...
- Food security assessment - Flowchart | Flow chart Example ...
- Flow chart Example. Warehouse Flowchart | Food security ...
- Process Flowchart | Example of DFD for Online Store (Data Flow ...
- Earthquake disaster assessment - Workflow diagram | Workflow ...
- Data Flow Diagram
- Flow chart Example. Warehouse Flowchart | Process Engineering ...
- Example of DFD for Online Store (Data Flow Diagram) DFD ...
- Earthquake disaster assessment - Workflow diagram | Army Flow ...
- Process Engineering | Flow chart Example. Warehouse Flowchart ...
- Example of DFD for Online Store (Data Flow Diagram) DFD ...
- Example of DFD for Online Store (Data Flow Diagram) DFD ...
- Flow Of Food Organizations
- Data Flow Diagram Symbols. DFD Library | Example of DFD for ...
- Online Flow Chart | Process Flowchart | Online store social media ...
- Types of Flowchart - Overview | Earthquake disaster assessment ...
- Online store social media response flowchart | Example of DFD for ...
- Flowchart Marketing Process. Flowchart Examples | Marketing Flow ...

