 SWOT Analysis
SWOT and TOWS Matrix Diagrams solution extends ConceptDraw DIAGRAM and ConceptDraw MINDMAP software with features, templates, samples and libraries of vector stencils for drawing SWOT and TOWS analysis matrices and mind maps.
How to Make SWOT Analysis in a Word Document
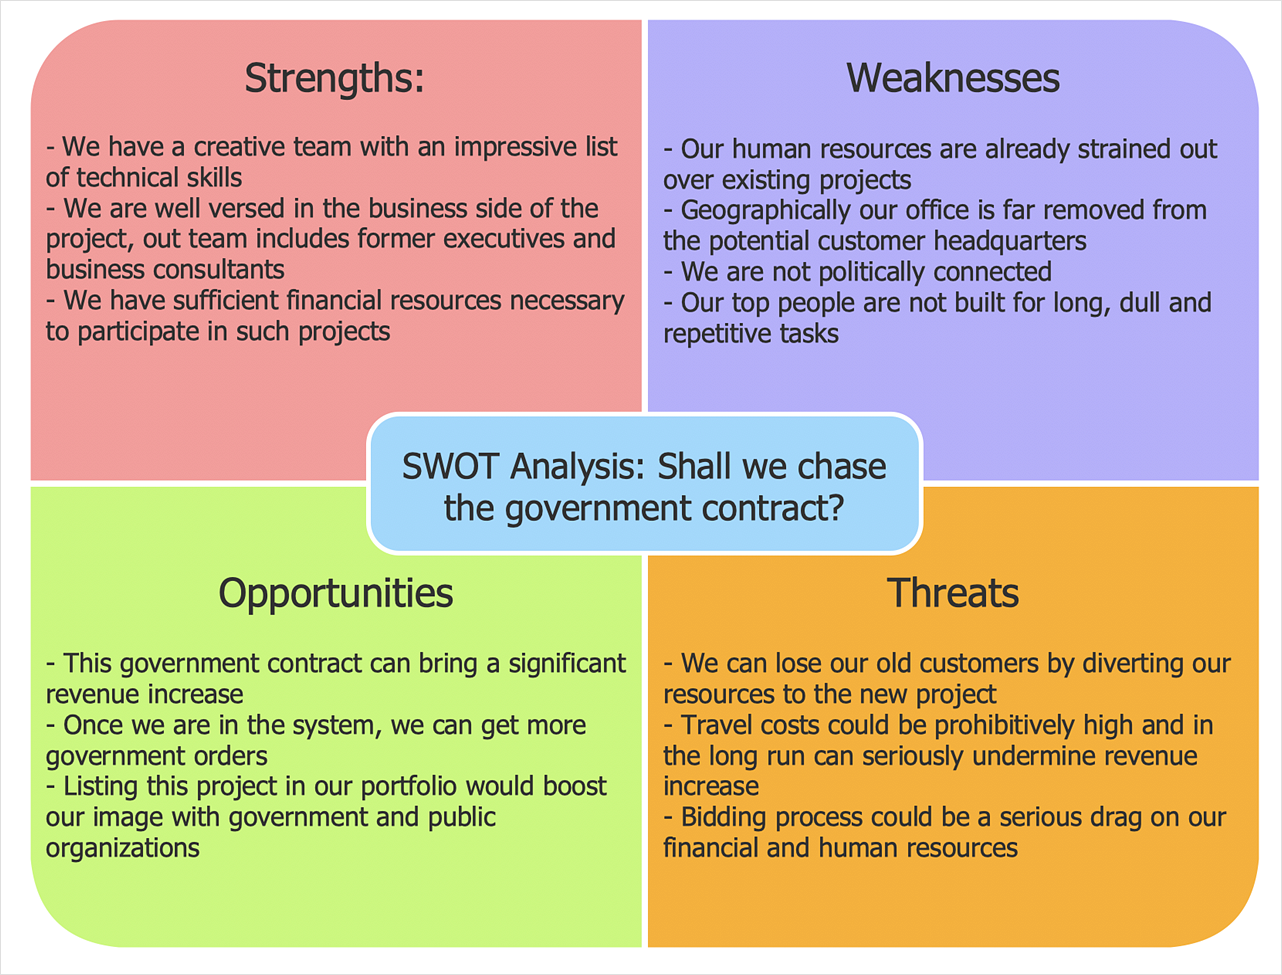
A SWOT Analysis is a popular tool of the strategic planning which is used to evaluate the Strengths, Weaknesses, Opportunities, and Threats that are involved in any businesses. Use of mind maps allows you to collect a lot of information used for SWOT Analysis, visually structure it and also identify the relationships between different parts of this information. SWOT and TOWS Matrix Diagrams solution for ConceptDraw Solution Park combines professional visual advantages of ConceptDraw MINDMAP software and presentation capabilities of ConceptDraw DIAGRAM , which together provide a complete work solution. The SWOT and TOWS diagrams, matrices or mind maps produced in ConceptDraw DIAGRAM using the predesigned vector objects or filling the ready templates, can be then easily exported to Microsoft Word, Microsoft Visio, Microsoft PowerPoint, Adobe PDF, and many other electronic file formats. The possibility of export makes easy the use of SWOT diagrams designed in ConceptDraw DIAGRAM and lets you efficiently collaborate even with people who maybe don't have this software.HelpDesk
How to Create SWOT Analysis Template
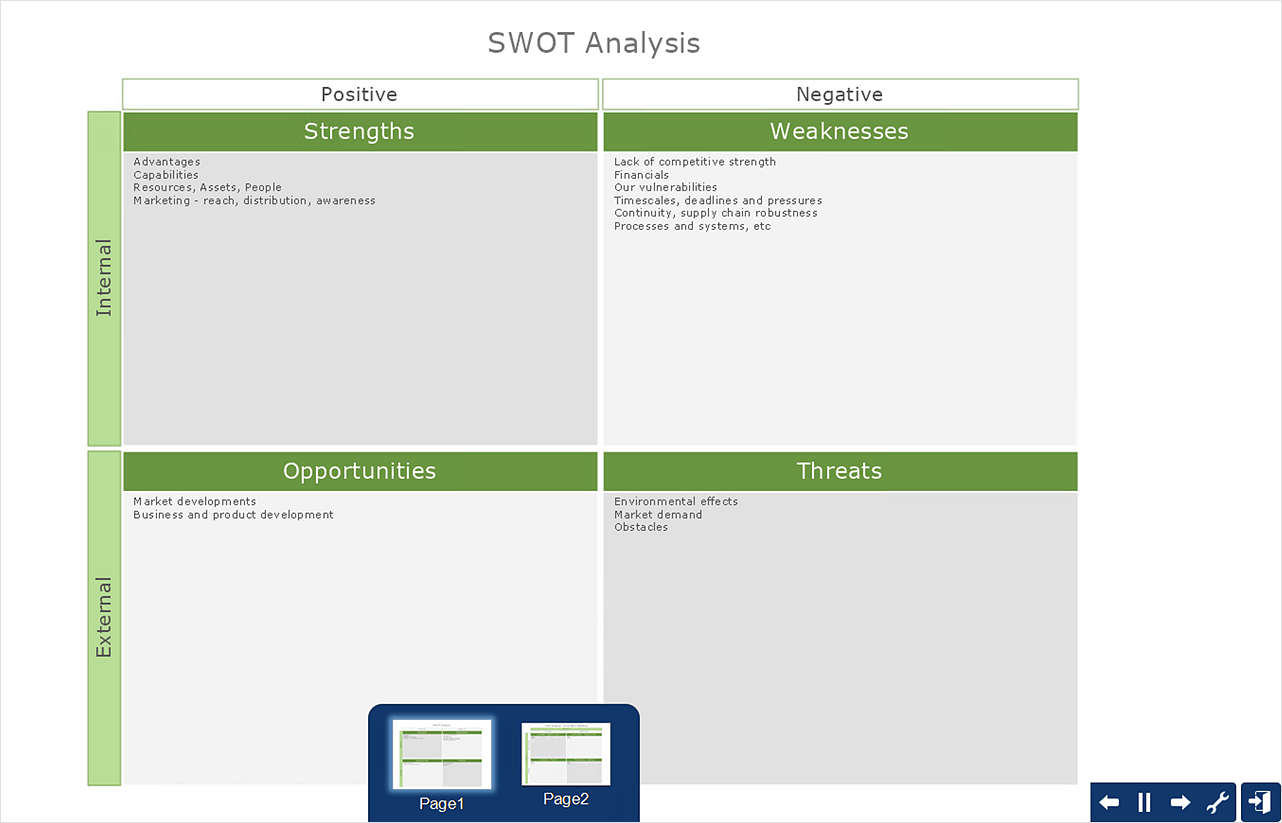
SWOT-analysis is used to develop a marketing strategy. SWOT-analysis includes determining the strengths and weaknesses of the company's activity, potential external threats, and opportunities and assesses their relative strategic competitors. ConceptDraw SWOT and TOWS Matrix Diagrams solution provides a set of SWOT matrix in which should be recorded and then compared the strengths and weaknesses of the enterprise and the market opportunities and threats. This comparison allows you to determine what steps can be taken for the development of your company and what problems need to be addressed urgently.This SWOT matrix diagram example was created on the base of article "An Easy Way To Jumpstart Your Strategic Plan: SWOT" by Leslie Wolf from the website of the California Digital Library, the University of California. "Strategic planning doesn’t have to be a daunting and lengthy process. The goal is really a simple one: to help you understand your world and build a road map to guide your efforts. ...
This analysis tool can help you focus your attention on the specific success factors that are right for your team.
The tool is called a SWOT analysis. SWOT stands for Strengths and Weaknesses, Opportunities and Threats. Here’s what it means:
(1) Strengths are those positive internal attributes that strengthen your business or team. You can develop plans to capitalize on those strengths.
(2) Weaknesses are those negative internal attributes that are working against your success. You can shore up those weaknesses so they don’t stop your success.
(3) Opportunities are those external conditions that can have a positive effect on your goals. These opportunities can point you in the right direction.
(4) Threats are those external conditions that can have a negative effect on your goals. These threats will affect you less if you can identify and minimize them. ...
We thought it would be helpful to show you a sample SWOT analysis for a business you can easily visualize: a small independent bookstore in a university town. The store owner brought the team together to think about how the bookstore could survive during the continuing financial downturn. After an hour of brainstorming, this is the SWOT analysis they developed." [cdlib.org/ cdlinfo/ 2010/ 09/ 29/ an-easy-way-to-jumpstart-your-strategic-plan-swot/ ]
The matrix diagram example "SWOT analysis for a small independent bookstore" was created using the ConceptDraw PRO diagramming and vector drawing software extended with the SWOT Analysis solution from the Management area of ConceptDraw Solution Park.
 ConceptDraw Solution Park
ConceptDraw Solution Park collects graphic extensions, examples and learning materials
 Marketing
This solution extends ConceptDraw DIAGRAM and ConceptDraw MINDMAP with Marketing Diagrams and Mind Maps (brainstorming, preparing and holding meetings and presentations, sales calls).
HelpDesk
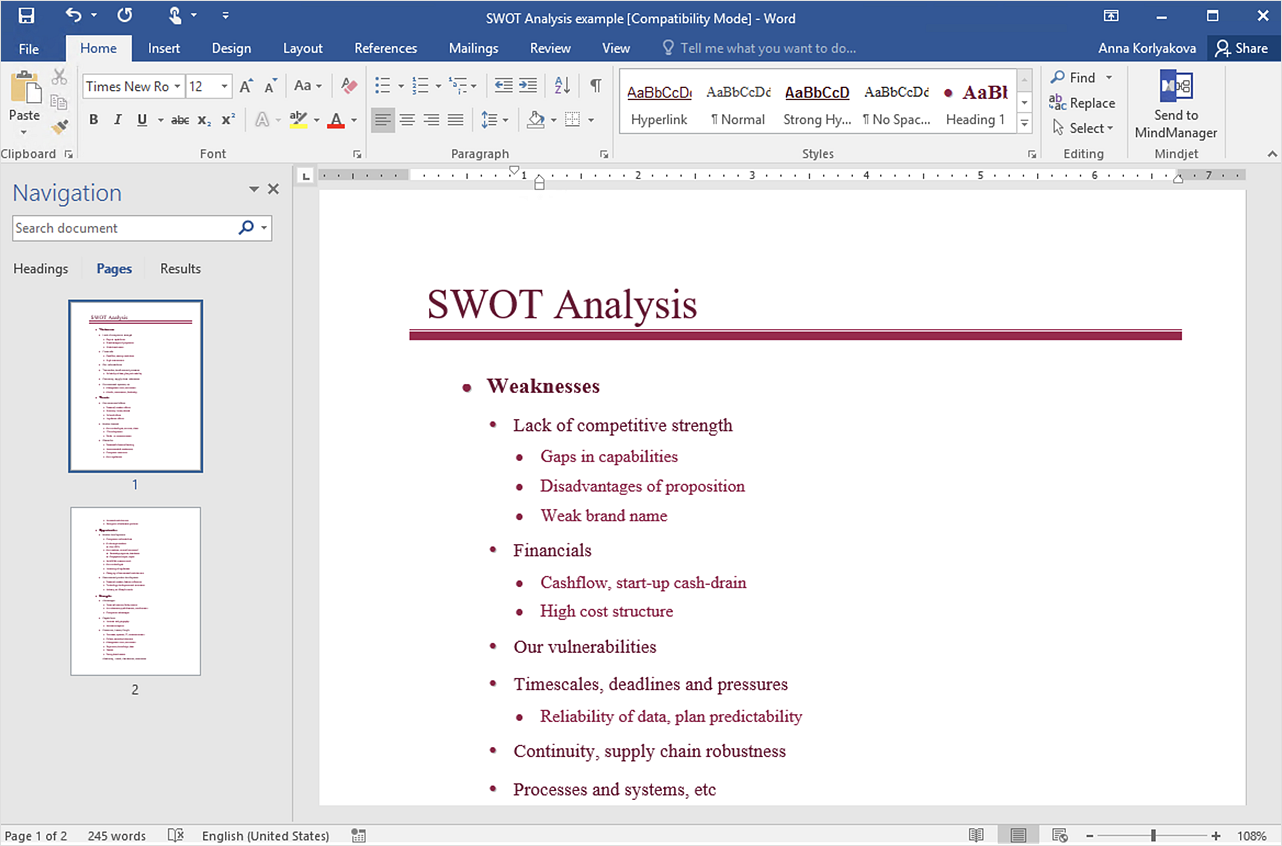
How to Make SWOT Analysis in a Word Document
A SWOT analysis is a strategic planning tool that helps to identify and compare strengths and weaknesses with opportunities and threats to make a decision and create an action plan. When performing a SWOT analysis, one can create a table split up into four columns so as to list each impacting element side-by-side for comparison, but typically it is conducted using a four-square SWOT analysis template. Using mind map allows you to collect and structure a piece of information involved in SWOT Analysis then, you can export your SWOT mind map into an MS Word document that allows you to present and collaborate your business strategic SWOT analysis matrix in MS Word document.HelpDesk
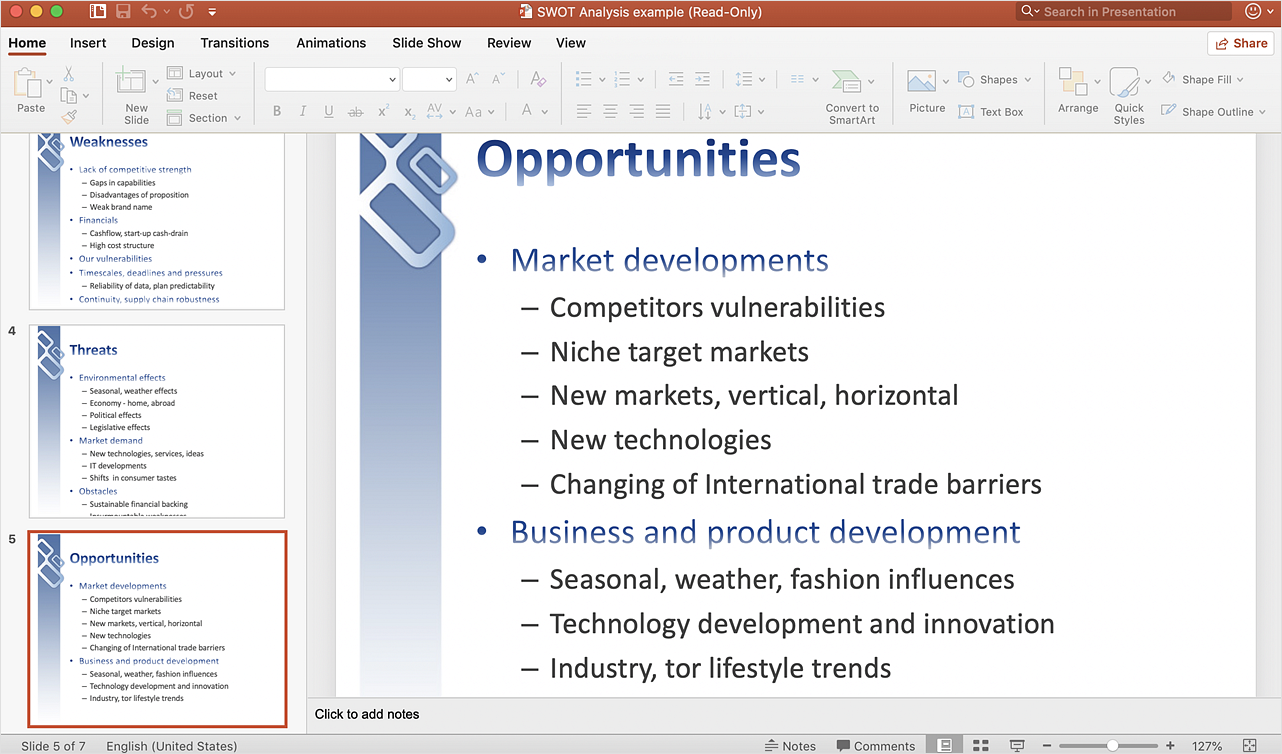
How to Create a PowerPoint Presentation from a SWOT Matrix
You can use SWOT analysis PowerPoint presentation to represent strengths, weakness, opportunities, and threats involved in your SWOT matrix. We recommend using ConceptDraw MINDMAP for identifying and structuring factors employed in SWOT Analysis. Then, you can export the SWOT Matrix to PowerPoint slides.
 ConceptDraw Solution Park
ConceptDraw Solution Park collects graphic extensions, examples and learning materials
HelpDesk
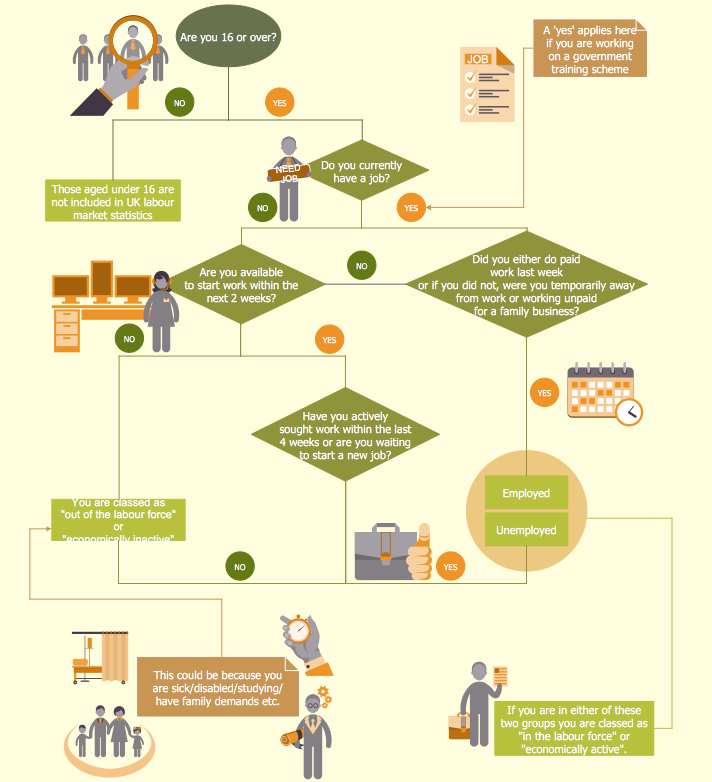
How to Create a HR Process Flowchart
One of the useful tools of each HR specialist is a HR Process Flowchart. HR Flowchart renders step-by-step the process of Human Resource management in any organization. HR flowchart shows the flow of all HR processes, identifies and standardizes the list of mandatory documents required for the implementation of all HR procedures, including the recruiting process. Usually, the descriptions of entire HR processes in a company requires a big set of graphic documents. They must be regularly redrawn to maintain up to date. The best tool for this is ConceptDraw DIAGRAM - the best software to create process flow diagrams of various types. In conjunction with ConceptDraw HR flowchart solution, it delivers comprehensive tool-set for human resource management.HelpDesk
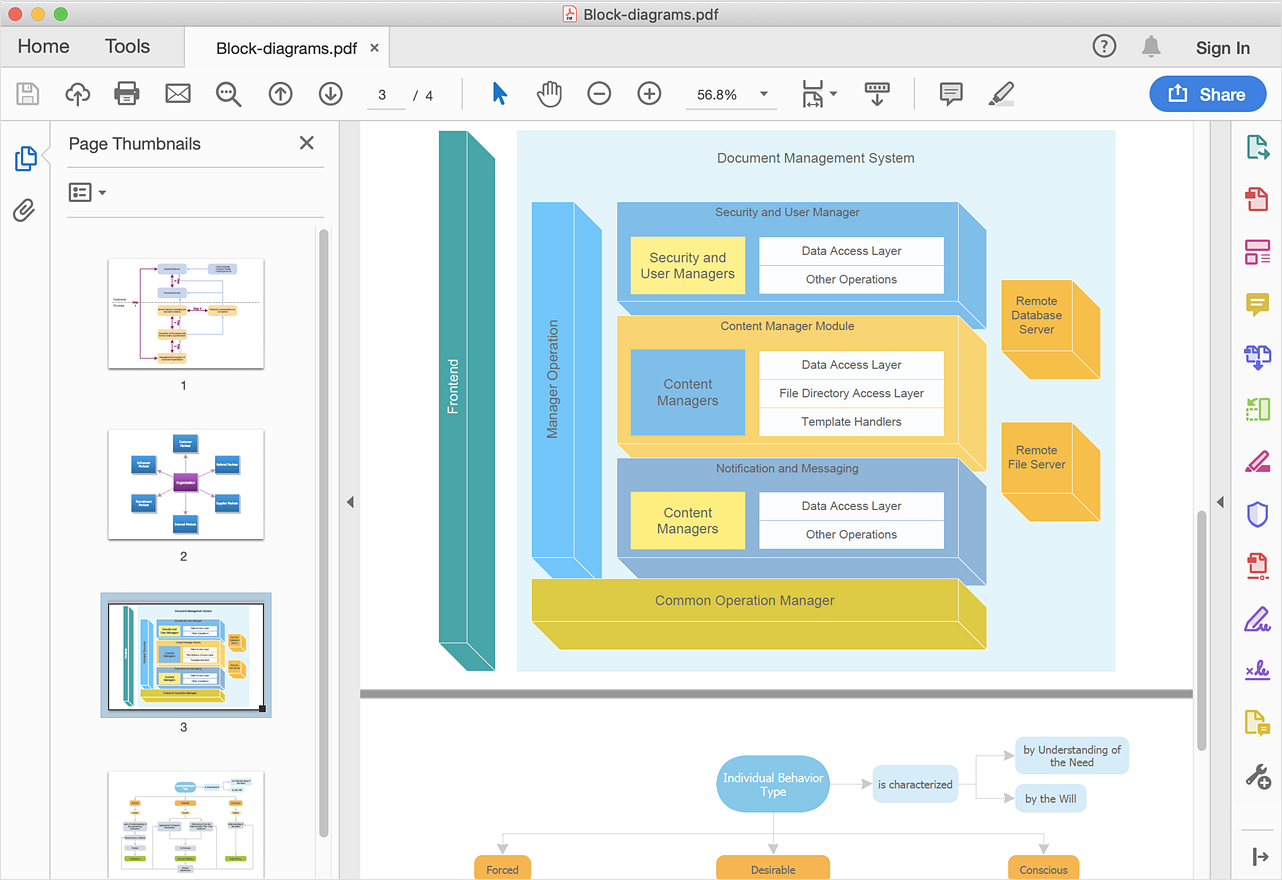
How To Convert a Block Diagram to Adobe PDF
ConceptDraw DIAGRAM allows you to easily share your business documentation between different computers with different operating systems and applications using its export capabilities. You can get a clear business graphic pack in pdf format and avoid any problems while communicating them with stakeholders.HelpDesk
How to Create a SWOT Matrix Quickly
ConceptDraw DIAGRAM allow create SWOT Matrix in just one click for presenting analysis results preformed in mimd map structure using ConceptDraw MINDMAP.HelpDesk
How to Make an Ansoff Matrix Template
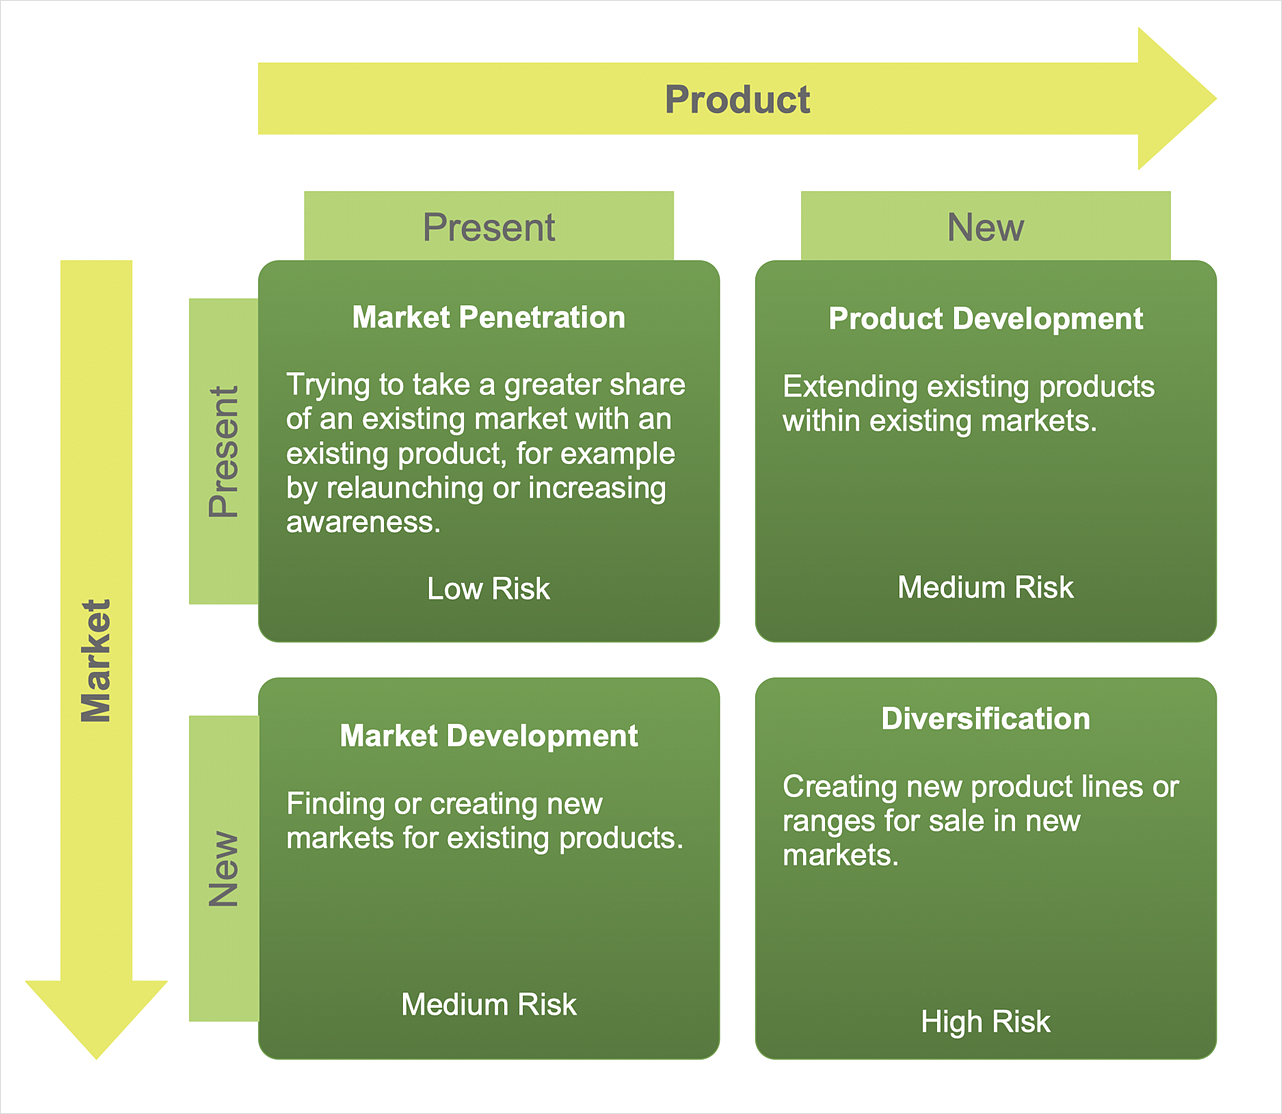
Ansoff Matrix is a business strategic management tool that helps a business determine its product and market growth strategy. Ansoff matrix has four sections to show each impacting ways that businesses can grow. Using Ansoff Matrix enables determining the current position of any business in the industry and choose the direction of its growth, which would provide the most competitive position. While Ansoff Matrix is most commonly used as a business planning tool it can be used also for personal development. You can make Ansoff Matrix template for your organization using ConceptDraw DIAGRAM Matrices solution.
 SYSML
SYSML
The SysML solution helps to present diagrams using Systems Modeling Language; a perfect tool for system engineering.
HelpDesk
How to Make Soccer Position Diagram
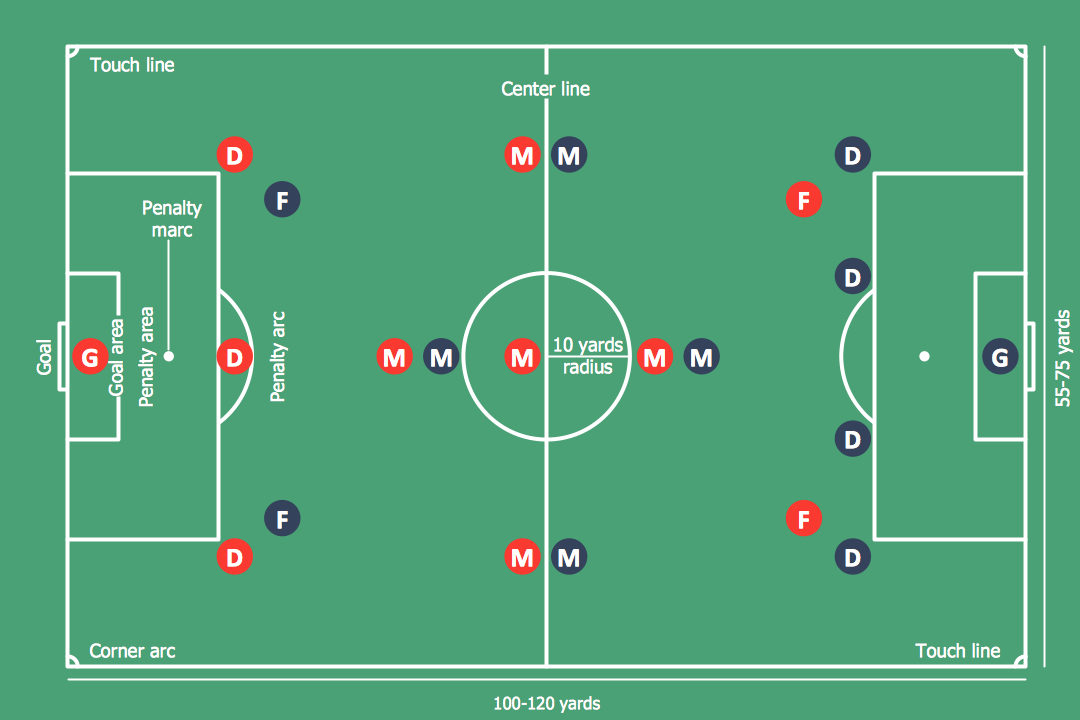
The soccer field has the form of a large rectangle, covered with grass. Dimensions of soccer fields may vary slightly, depending on the level of the game, but all fields have some common characteristics. Soccer players may take different positions. Each soccer position has its own name and implies certain player functions. Every soccer position has a very specific name and task: Goalkeeper, Defenders, Midfielders and Forwards. During preparation for the game, coach met a challenge: how to explain each player's position and his role in the game. The difficulty is the fact that in the course of the game players will often move on the field and do not stay in one place. Football field diagram with dimensions and marking, and positions - it is an important tool for the coach. ConceptDraw DIAGRAM helps both coach and players to understand exactly their roles during the particular game. The ability to create Soccer diagrams is contained in the ConceptDraw Soccer solution. The solution providesHelpDesk
How to Save a Drawing as a Graphic File
ConceptDraw DIAGRAM can save your drawings and diagrams in a number of highly useful formats, including graphic files. You can save your drawing as a.PNG,.JPG, or other graphic format file.HelpDesk
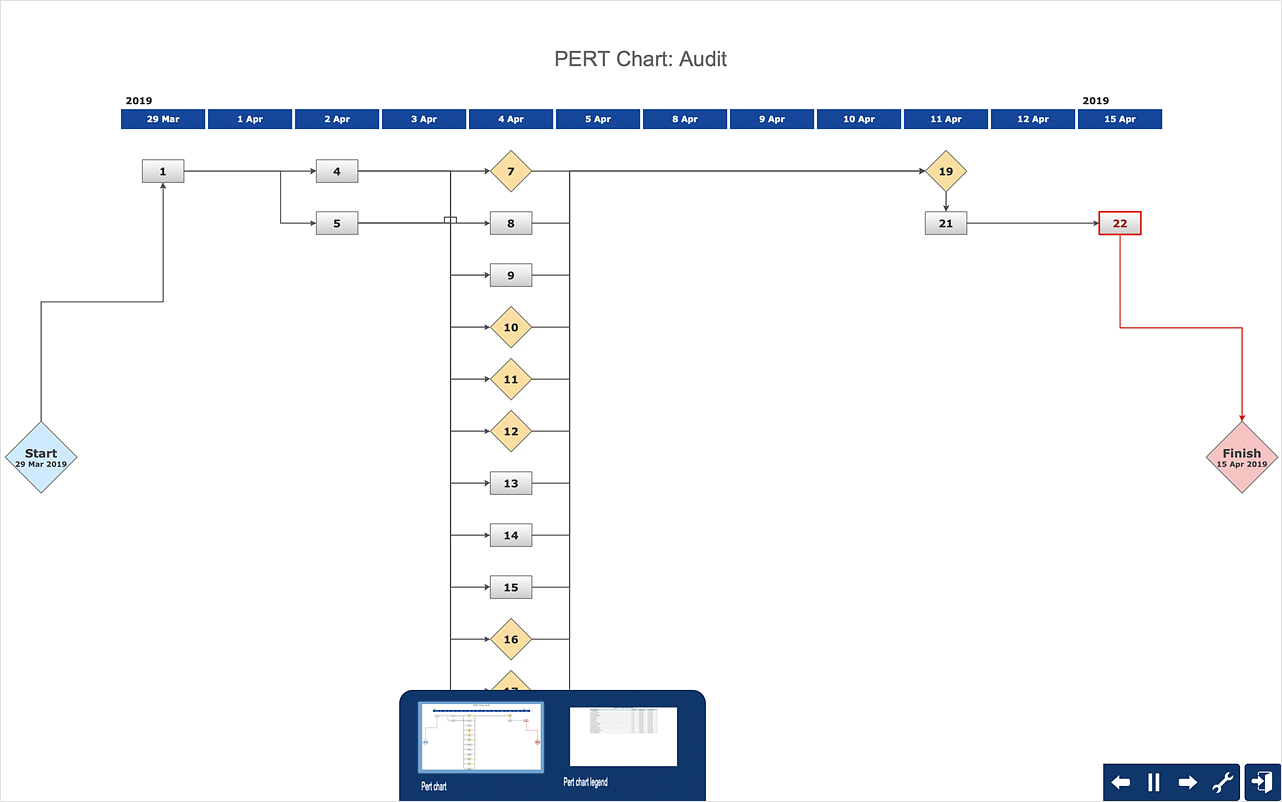
How To Create a PERT Chart Using PM Easy Solution
Project Evaluation and Review Technique (PERT) is a method of project tasks evaluation and analysis. PERT - is a method of analyzing the tasks required to complete the project. It includes analysis of the time required to complete each task, as well as the determination of the time required to carry out the whole project. PERT was developed to facilitate the planning of huge and complex projects. PERT is used for very large, complex, and non-standard projects. Technology implies the presence of uncertainty, making it possible to develop a schedule of the project without a precise information on details and time required for all of its components. The most popular part of PERT is a method of the critical path, based on the construction of the network schedule (PERT network diagram). ConceptDraw Office delivers you the best way to create PERT chart for your project using compatibility between ConceptDraw PROJECT and ConceptDraw DIAGRAM.HelpDesk
How to Create a Bubble Diagram
Bubble Diagram is a simple chart that consists of circles (bubbles) repesening certain topics or processes. Bubbles are connected by lines depicting the type of relationships between the bubbles. The size of each bubble is depended on the importance of the entity it represents. Bubble charts are widely used throughout social, economical, medical, and other scientific researches as well as throughout architecture and business management. Bubble charts are often used during the early stages of product development to visualize thoughts and ideas for the purpose of sketching out a development plan. ConceptDraw DIAGRAM allows you to draw a bubble diagrams using the Bubble Diagrams solution.HelpDesk
How to Create an Accounting Flowchart
An Accounting flowchart is a specialized type of flowchart. With the help of an accounting flowchart, you can visually describe tasks, documents, people responsible for execution at each stage of the accounting workflow. Find out how you can easily create an accounting flowchart of any complexity using Accounting Flowchart Solution from the ConceptDraw Solution Park.- Internet marketing - Concept map | Marketing - Vector stencils library ...
- Marketing | Internet marketing - Concept map | Design elements ...
- Mind Maps for Business - SWOT Analysis | What is SWOT Analysis ...
- Internet marketing - Concept map | Concept Maps | What Is a ...
- Internet marketing - Concept map | Flowchart Marketing Process ...
- Matrices | Ansoff's product / market matrix | SWOT matrix template ...
- Internet marketing - Concept map | Concept Maps | Concept Maps ...
- Marketing Mind Maps | Mind Maps for Business - SWOT Analysis ...
- Marketing | How to Share Mind Maps via Internet | What is SWOT ...
- Marketing | SWOT Analysis Solution - Strategy Tools | Sales Process ...
- Marketing | SWOT Analysis | SWOT analysis matrix diagram ...
- Mind Maps for Business - SWOT Analysis | Marketing | How to ...
- Marketing Diagrams | Flowchart Marketing Process. Flowchart ...
- SWOT analysis matrix diagram templates | SWOT matrix template ...
- Internet marketing - Concept map | Venn diagram - Internet ...
- Mind Maps for Business - SWOT Analysis | Evernote + MindMapping ...
- Mac Tools - SWOT Analysis | SWOT Analysis Solution - Strategy ...
- Diagram Of Marketing Concept
- Marketing | ConceptDraw Solution Park | SWOT Analysis | Concept ...

