Basic Flowchart Examples
ConceptDraw DIAGRAM is a business flowchart software includes the wide flowchart examples package.SWOT Analysis
Most of the data needed for market analysis (demand, prices, volume of sales, etc.) are undefined, and in future are possible their changes as in the worst and the best side. SWOT analysis is effective method for prediction these processes and decision making for organizations that function in a competitive environment. It allows you to see the whole situation, to identify the strengths and weaknesses of organization (advantages and disadvantages), as well as opportunities and threats of external environment. The results of SWOT analysis are the basis for optimization the business processes, for development by the leading specialists in organization of interrelated complex of strategies and competitive activities. ConceptDraw DIAGRAM software enhanced with SWOT and TOWS Matrix Diagrams Solution will effectively help you in strategic planning for your company, department, project, in development marketing campaign, in identification of four categories of factors of internal and external environment of organization, and construction professional-looking SWOT and TOWS matrices.Corrective Action Planning
One of the stages of the problem's solving process scenario is Corrective Action Planning. Corrective action planning define people and groups involvement in corrective actions by roles, identify logical sequences of scheduled actions and critical path of problem solving, identify possible risks of action plan and propose preventive actions.
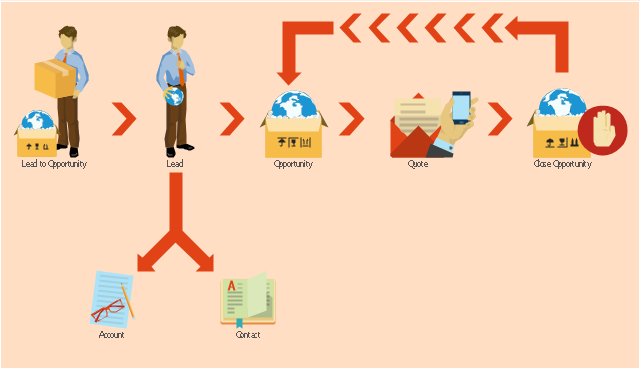
This example shows the Microsoft Dynamics CRM workflow from lead to opportunity. It was redesigned from the Wikimedia Commons file: Lead to Opportunity sales flow.svg. [commons.wikimedia.org/ wiki/ File:Lead_ to_ Opportunity_ sales_ flow.svg]
"Does your lead have what you're looking for - and vice versa? Once you've identified the timeframe, budget, purchase process, and decision makers for the sale, it's time to qualify your lead. Qualifying a lead in Microsoft Dynamics CRM converts it to an opportunity.
Ideally, your leads or prospects should have a need that you can provide a solution for, and have the budget and influence necessary for making the purchasing decision. In addition, you should be able to provide their solution within the timeframe they need it." [microsoft.com/ en-us/ dynamics/ crm-customer-center/ qualify-a-lead-and-convert-it-to-an-opportunity.aspx]
The example "Workflow - Lead to Opportunity" was created using the ConceptDraw PRO diagramming and vector drawing software extended with the Sales Flowcharts solution from the Marketing area of ConceptDraw Solution Park.
Professional Diagrams - No need for any special drawing skills for you
No need for any special drawing skills to create professional looking diagrams outside of your knowledge base. ConceptDraw DIAGRAM takes care of the technical side. Use templates, samples and special libraries for your needs.Cross Functional Flowchart for Business Process Mapping
Start your business process mapping with conceptDraw DIAGRAM and its Arrows10 Technology. Creating a process map, also called a flowchart, is a major component of Six Sigma process management and improvement. Use Cross-Functional Flowchart drawing software for business process mapping (BPM). Use a variety of drawing tools, smart connectors and shape libraries to create flowcharts of complex processes, procedures and information exchange. Define and document basic work and data flows, financial, production and quality management processes to increase efficiency of you business.How to Create a Cross Functional Flow Chart
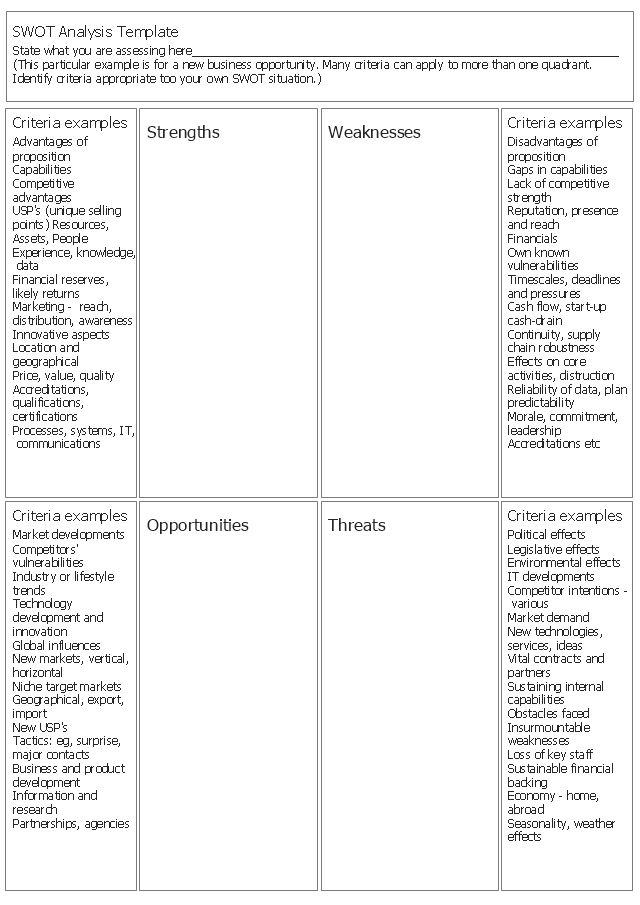
If neither of 45 vector shapes of the Cross-Functional Flowcharts solution don't fit your needs, you will want to learn How to create a unique Cross-Functional flowchart. ConceptDraw Arrows10 Technology - This is more than enough versatility to draw any type of diagram with any degree of complexity. Drawing software lets you to make horizontal and vertical, audit, opportunity and many more flowcharts."SWOT stands for Strengths, Weaknesses, Opportunities, and Threats. SWOT analysis is a tool for analyzing the current situation both internally (strengths and weaknesses) and externally (opportunities and threats). It provides helpful baseline information for a group that wants to vision the future or analyze a problem." [educationworld.com/ a_ admin/ greatmeetings/ greatmeetings018.shtml]
This form template "New business opportunity SWOT analysis matrix" for the ConceptDraw PRO diagramming and vector drawing software is included in the SWOT Analysis solution from the Management area of ConceptDraw Solution Park.
This form template "New business opportunity SWOT analysis matrix" for the ConceptDraw PRO diagramming and vector drawing software is included in the SWOT Analysis solution from the Management area of ConceptDraw Solution Park.
Flowcharting Software
A flowchart is a useful type of diagram quite popular in many areas of science and business, which represents some algorithm, workflow or process. ConceptDraw DIAGRAM diagramming and vector graphic software extended with Flowcharts solution from the "Diagrams" area of ConceptDraw Solution Park is also ideal flowcharting software with powerful tools that assist in easily making the Flowcharts of different types and directions, in representing the flowchart steps and describing the flowchart processes, in realizing the flowchart constructions, creating the process flow models, designing the data flow diagrams, and many other flowcharting related diagrams. ConceptDraw DIAGRAM software maximally facilitates the drawing process by means of included predesigned vector objects, which only need to be dragged to your ConceptDraw document from the corresponding library and connected with smart connectors. This way lets equally easy make the simple flowcharts, as well as flowcharts of complex processes and procedures.Swot Analysis Examples for Mac OSX
SWOT is an acronym of the words Strengts, Weaknesses, Opportunities and Тhreats. SWOT analysis is used to show the real situation and prospects of the company on the market, the internal environment of the company is reflected by S and W, and external by O and T. SWOT analysis is a quality tool for structuring available information, which is successfully used in the process of strategy planning, it helps analysts in formulation recommendations on the basis of collected information and data, structured in a form of SWOT Matrix. The SWOT analysis is effective and simple in use, however its results in great depend on the completeness and quality of initial information, from the depth of understanding of the current state and development trends of the market, and also from the used software. ConceptDraw DIAGRAM extended with powerful tools of SWOT and TOWS Matrix Diagrams solution, containing templates and SWOT analysis examples for Mac OSX and Windows, is ideal software for creation professional SWOT Matrices and SWOT Analysis Matrices.- Sales Flowcharts | Sales Lead Opportunity Diagram
- What Is Opportunity Flow Diagram
- Opportunity Flow Diagram
- Lead to opportunity sales flow | Process flow diagram - Typical oil ...
- Recruitment | Replacing engine oil - Opportunity flowchart | Internal ...
- Replacing engine oil - Opportunity flowchart | 4 Level pyramid model ...
- Word Exchange | How Can You Convert Opportunity To Strength
- Replacing engine oil - Opportunity flowchart | Create Block Diagram ...
- SWOT Analysis | SWOT analysis diagram - Template | New business ...


