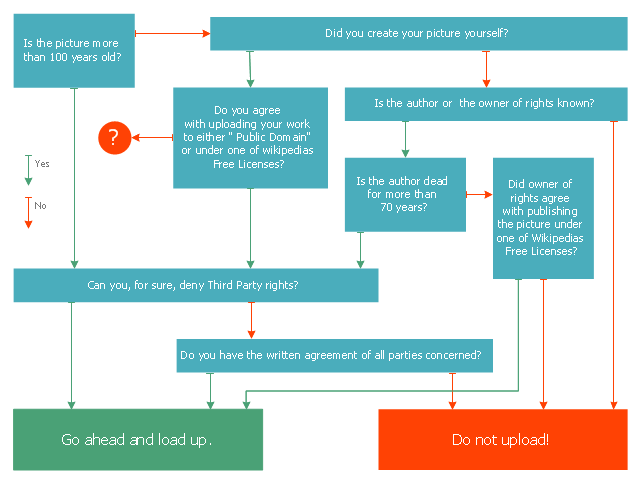
This marketing diagram sample represents decision tree. It was redesigned from the Wikimedia Commons file: Decision Tree on Uploading Imagesv2.svg.
[commons.wikimedia.org/ wiki/ File:Decision_ Tree_ on_ Uploading_ Imagesv2.svg]
"A decision tree is a decision support tool that uses a tree-like graph or model of decisions and their possible consequences, including chance event outcomes, resource costs, and utility. It is one way to display an algorithm.
Decision trees are commonly used in operations research, specifically in decision analysis, to help identify a strategy most likely to reach a goal. ...
A decision tree is a flowchart-like structure in which internal node represents test on an attribute, each branch represents outcome of test and each leaf node represents class label (decision taken after computing all attributes). A path from root to leaf represents classification rules.
In decision analysis a decision tree and the closely related influence diagram is used as a visual and analytical decision support tool, where the expected values (or expected utility) of competing alternatives are calculated.
A decision tree consists of 3 types of nodes:
(1) Decision nodes - commonly represented by squares.
(2) Chance nodes - represented by circles.
(3) End nodes - represented by triangles.
Decision trees are commonly used in operations research, specifically in decision analysis, to help identify a strategy most likely to reach a goal." [Decision tree. Wikipedia]
The marketing diagram example "Decision tree" was created using the ConceptDraw PRO diagramming and vector drawing software extended with the Marketing Diagrams solution from the Marketing area of ConceptDraw Solution Park.
Marketing flowchart
"A root cause is an initiating cause of a causal chain which leads to an outcome or effect of interest. Commonly, root cause is used to describe the depth in the causal chain where an intervention could reasonably be implemented to change performance and prevent an undesirable outcome." [Root cause. Wikipedia]
"Problem-solving consists of using generic or ad hoc methods, in an orderly manner, for finding solutions to problems. Some of the problem-solving techniques developed and used in artificial intelligence, computer science, engineering, mathematics, medicine, etc. are related to mental problem-solving techniques studied in psychology." [Problem solving. Wikipedia]
This root cause analysis (RCA) tree diagram example "Personal problem solution" was created using the ConceptDraw PRO diagramming and vector drawing software extended with the Seven Management and Planning Tools solution from the Management area of ConceptDraw Solution Park.
Tree diagram

The accident analysis diagram example "Accident analytic tree" was redesigned from the picture 7-14 from the "DOE Workbook. Conducting Accident Investigations. Revision 2."
"Analytic tree analyses are well defined, useful methods that graphically depict, from beginning to end, the events and conditions preceding and immediately following an accident. An analytic tree is a means of organizing information that helps the investigator conduct a deductive analysis of any system (human, equipment, or environmental) to determine critical paths of success and failure. Results from this analysis identify the details and interrelationships that must be considered to prevent the oversights, errors, and omissions that lead to failures. In accident investigations, this type of analysis can consist of both failure paths and success paths, and can lead to neutral, negative, or positive conclusions regarding accident severity.
TIP.
An analytic tree enables the user to:
(1) Systematically identify the possible paths from events to outcome.
(2) Display a graphical record of the analytical process.
(3) Identify management system weaknesses and strengths."
[homer.ornl.gov/ sesa/ corporatesafety/ aip/ docs/ workbook/ Rev2/ chpt7/ chapt7.htm]
The FTA diagram example "Accident analytic tree" was created using the ConceptDraw PRO diagramming and vector drawing software extended with the Fault Tree Analysis Diagrams solution from the Engineering area of ConceptDraw Solution Park.
FTA diagram

 Fault Tree Analysis Diagrams
This solution extends ConceptDraw PRO v9.5 or later with templates, fault tree analysis example, samples and a library of vector design elements for drawing FTA diagrams (or negative analytical trees), cause and effect diagrams and fault tree diagrams.
Basic Flowchart Symbols and Meaning


 Seven Management and Planning Tools
Seven Management and Planning Tools solution extends ConceptDraw PRO and ConceptDraw MINDMAP with features, templates, samples and libraries of vector stencils for drawing management mind maps and diagrams.
Process Flowchart


Org Chart Diagram

WBS Diagram

HelpDesk
How to Draw a Fishbone Diagram with ConceptDraw PRO

Cross-Functional Flowchart


Local area network (LAN). Computer and Network Examples
. Computer and Network Examples")

 Rapid UML
Rapid UML solution extends ConceptDraw PRO software with templates, samples and libraries of vector stencils for quick drawing the UML diagrams using Rapid Draw technology.
 Business Process Mapping
The Business Process Mapping solution for ConceptDraw PRO is for users involved in process mapping and creating SIPOC diagrams.
 Project Management Area
Project Management area provides Toolbox solutions to support solving issues related to planning, tracking, milestones, events, resource usage, and other typical project management functions.
- Decision Making | Cause and Effect Analysis | Fault Tree Diagram ...
- Decision Making | Fault Tree Diagram | Influence Diagram Software ...
- Decision tree diagram | How to Build a Flowchart | Flowchart Off ...
- Fault Tree Analysis Diagrams | PROBLEM ANALYSIS. Root Cause ...
- Root cause analysis tree diagram - Personal problem solution ...
- Can Flow Decision Has Several Outcomes
- PROBLEM ANALYSIS. Root Cause Analysis Tree Diagram | Root ...
- PROBLEM ANALYSIS. Root Cause Analysis Tree Diagram ...
- Outcomes Science
- Decision Making | Cause and Effect Analysis | PROBLEM ...
- PROBLEM ANALYSIS. Root Cause Analysis Tree Diagram | Bar ...
- Accident analytic tree - FTA diagram | Fault Tree Analysis Accident ...
- Root cause analysis tree diagram - Sale problem solution | Root ...
- Accident analytic tree - FTA diagram | Fault Tree Analysis Diagrams ...
- Root cause analysis tree diagram - Personal problem solution | How ...
- FTA diagram - Hazard analysis | Accident analytic tree - FTA ...
- Root cause analysis tree diagram - Template
- Root Cause Tree Diagram | Communication Tool for Remote Project ...
- Root cause analysis tree diagram - Personal problem solution ...