Flowchart by Hapman
Do you need a flowchart or to sketch out a process? Download the Flowchart by Hapman app for FREE today!!!"Project planning is part of project management, which relates to the use of schedules such as Gantt charts to plan and subsequently report progress within the project environment.
Initially, the project scope is defined and the appropriate methods for completing the project are determined. Following this step, the durations for the various tasks necessary to complete the work are listed and grouped into a work breakdown structure. Project planning is often used to organize different areas of a project, including project plans, work loads and the management of teams and individuals. The logical dependencies between tasks are defined using an activity network diagram that enables identification of the critical path. Float or slack time in the schedule can be calculated using project management software. Then the necessary resources can be estimated and costs for each activity can be allocated to each resource, giving the total project cost. At this stage, the project schedule may be optimized to achieve the appropriate balance between resource usage and project duration to comply with the project objectives. Once established and agreed, the project schedule becomes what is known as the baseline schedule. Progress will be measured against the baseline schedule throughout the life of the project. Analyzing progress compared to the baseline schedule is known as earned value management.
The inputs of the project planning phase include the project charter and the concept proposal. The outputs of the project planning phase include the project requirements, the project schedule, and the project management plan." [Project planning. Wikipedia]
The flow chart example "Project planning process" was created using the ConceptDraw PRO diagramming and vector drawing software extended with the Flowcharts solution from the area "What is a Diagram" of ConceptDraw Solution Park.
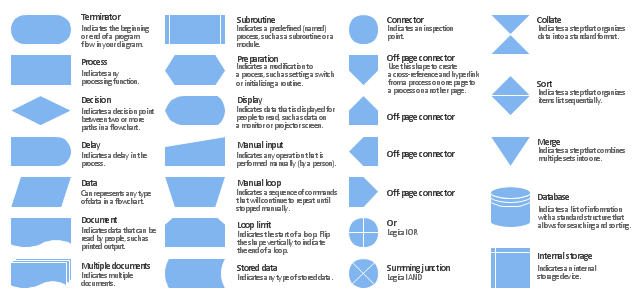
The vector stencils library "Flowchart" contains 26 symbols for drawing the flow charts using the ConceptDraw PRO diagramming and vector drawing software.
"Flowcharts are used in designing and documenting complex processes or programs. Like other types of diagrams, they help visualize what is going on and thereby help the viewer to understand a process, and perhaps also find flaws, bottlenecks, and other less-obvious features within it. There are many different types of flowcharts, and each type has its own repertoire of boxes and notational conventions. The two most common types of boxes in a flowchart are:
(1) a processing step, usually called activity, and denoted as a rectangular box;
(2) a decision, usually denoted as a diamond.
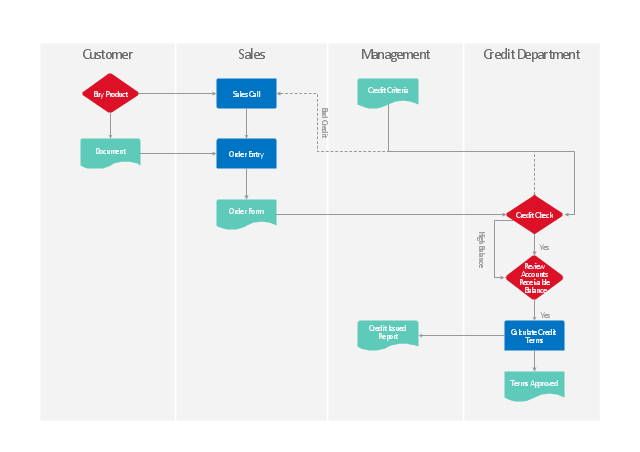
A flowchart is described as "cross-functional" when the page is divided into different swimlanes describing the control of different organizational units. A symbol appearing in a particular "lane" is within the control of that organizational unit. This technique allows the author to locate the responsibility for performing an action or making a decision correctly, showing the responsibility of each organizational unit for different parts of a single process. ...
Common alternate names include: flowchart, process flowchart, functional flowchart, process map, process chart, functional process chart, business process model, process model, process flow diagram, work flow diagram, business flow diagram. The terms "flowchart" and "flow chart" are used interchangeably." [Flowchart. Wikipedia]
The example "Design elements - Flowchart" is included in the Flowcharts solution from the area "What is a Diagram" of ConceptDraw Solution Park.
"Trade credit.
The word credit is used in commercial trade in the term "trade credit" to refer to the approval for delayed payments for purchased goods. Credit is sometimes not granted to a person who has financial instability or difficulty. Companies frequently offer credit to their customers as part of the terms of a purchase agreement. Organizations that offer credit to their customers frequently employ a credit manager." [Credit (finance). Wikipedia]
The vertical cross-functional flowchart example "Credit approval process" was created using the ConceptDraw PRO diagramming and vector drawing software extended with the Flowcharts solution from the area "What is a Diagram" of ConceptDraw Solution Park.
- Data Flow Diagram (DFD)
- Data Flow Diagrams | Data Flow Diagram (DFD) | Data Flow
- Flowchart Programming Project. Flowchart Examples | Flowchart ...
- Design elements - Data Flow Diagram (DFD) | How to Create ...
- How to Create a Social Media DFD Flowchart | What is Interactive ...
- Data Flow Diagram (DFD)
- Data Flow Diagram Model | DFD - Model of small traditional ...
- Basic Flowchart Symbols | Flow Chart Symbols | Flowchart Symbols ...
- Data Flow Diagram
- Flowchart . What is Flowchart | Flowchart Examples and Templates ...
- How to Draw a Flowchart | Design elements - Flowchart | Flow Chart ...
- Cross-functional flowchart - Credit approval process | Cross ...
- Data Flow Diagrams | Data Flow Diagrams | Data Flow Diagram (DFD)
- Basic Flowchart Images. Flowchart Examples | Flow chart Example ...
- diagram , flow chart , flow diagrams, flow diagram , flow charts , flow
- Approval Process and Segregation of Responsibilities Accounting ...
- Cross-functional flowchart - Credit approval process | Approval ...
- Social Media Response | Process Flowchart | Account Flowchart ...
- Data Flow Diagram Model
- Sales Process Flowchart . Flowchart Examples | Relations diagram ...


