Affinity Diagram Software
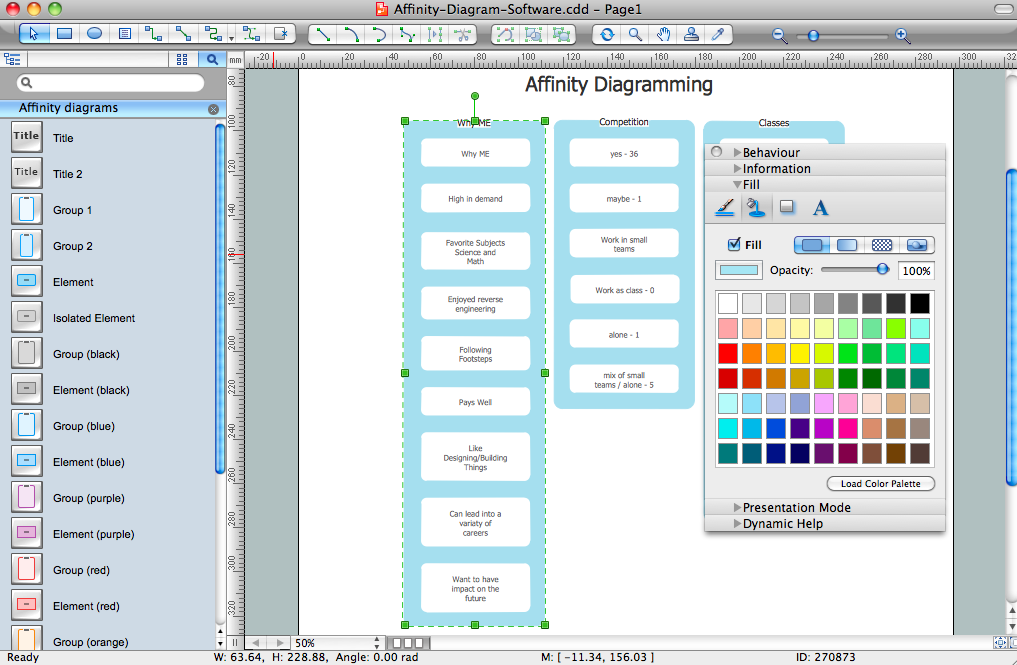
Affinity Diagram Software - ConceptDraw PRO is a powerful diagramming and vector drawing software that allows quick, easy and effective create the Affinity Diagrams. Seven Management and Planning Tools solution from the Business Productivity area of ConceptDraw Solution Park provides templates, samples and ready-to-use vector stencils that will help you design the professional looking Affinity Diagrams in a few moments.Affinity Diagram
The affinity diagram is a business tool used to organize ideas and data. It is one of the Seven Management and Planning Tools. But how design the Affinity Diagram quick and easy? ConceptDraw PRO diagramming and vector drawing software offers the Seven Management and Planning Tools Solution from the Management Area.Affinity Diagram
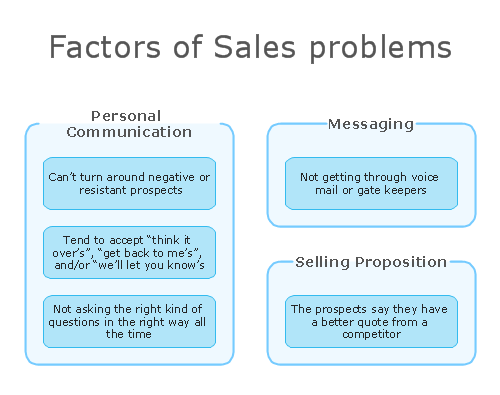
The Affinity Diagram, also known as a KJ diagram, is a business tool invented for organization the large quantity of ideas and data. It is a part of Seven Management and Planning Tools, it is usually used right after brainstorming to sort large numbers of ideas into the corresponding groups. The Affinity Diagram helps to represent in a better way the structure of large and complex factors which influence on a problem, divides these factors into the smaller and simpler structures, and helps team members to see the patterns and identify possible solutions to problems they have. The diagrams of this type don't show the causal relationships between the factors, but they are designed to prepare the data for holding further analysis of the cause-effect relationships. Another area of Affinity Diagram usage is contextual inquiry as a way to sort observations and notes from field interviews, support call logs, open-ended survey responses organizing, etc. ConceptDraw MINDMAP software offers you the tools for easy holding brainstorming, generation ideas and creation MINDMAP Affinity Diagram.Affinity Diagram
Affinity Diagram is a powerful business tool, one of the Seven Management and Planning Tools. It helps to gather and organize in groups the large number of information, opinions or ideas, which are typically generated during brainstorming session, and is based on the natural relationships that exist between ideas. Affinity Diagram is indispensible for analysis the complex problems, ideas and results of oral surveys. It effectively depicts the structure of large and complex factors that influence on a problem, divides them into smaller with simpler structure, but doesn't show a causal relationship between the factors. Typically Affinity Diagram contains approximately 40-50 topics and is widely used for a completely different goals, for the project definition, for analyzing product evaluations, for identifying the main violations in a process and the ways of their improvement. ConceptDraw Office applications are ideal for designing professional-looking Affinity diagrams. This Affinity diagram is created to prepare the data for further analysis of cause-and-effect relationships.How To Create Onion Diagram
An onion diagram is a kind of chart that shows the dependencies among parts of an organization or process. The chart displays items in concentric circles, where the items in each ring depend on the items in the smaller rings. The Onion Diagram is able to show layers of a complete system in a few circles. But how to create Onion Diagram? Now, it's very easy thanks to the ConceptDraw PRO diagramming and vector drawing software extended with Stakeholder Onion Diagrams Solution from the Management Area of ConceptDraw Solution Park.PDPC
ConceptDraw PRO extended with Seven Management and Planning Tools Solution from the Management Area of ConceptDraw Solution Park is the best software for drawing all types of diagrams from the Seven Management and Planning Tools: Affinity Diagram, Relations Diagram, Prioritization Matrix, Root Cause Analysis Tree Diagram, Involvement Matrix, PERT Chart, and Risk Diagram (PDPC).Introductory Guide to Rapid UML Solution
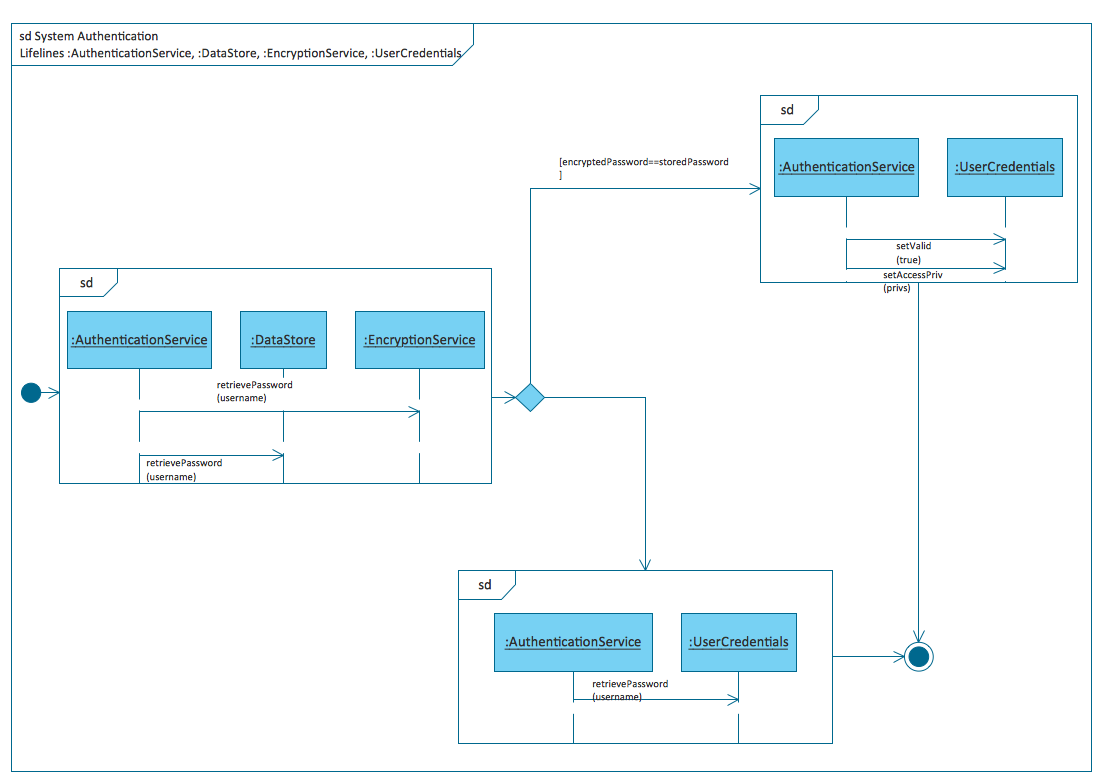
The ability to develop UML diagrams as quickly as the ideas come. The solution uses ConceptDraw RapidDraw techniques. The result is a vector graphic document.Active Directory
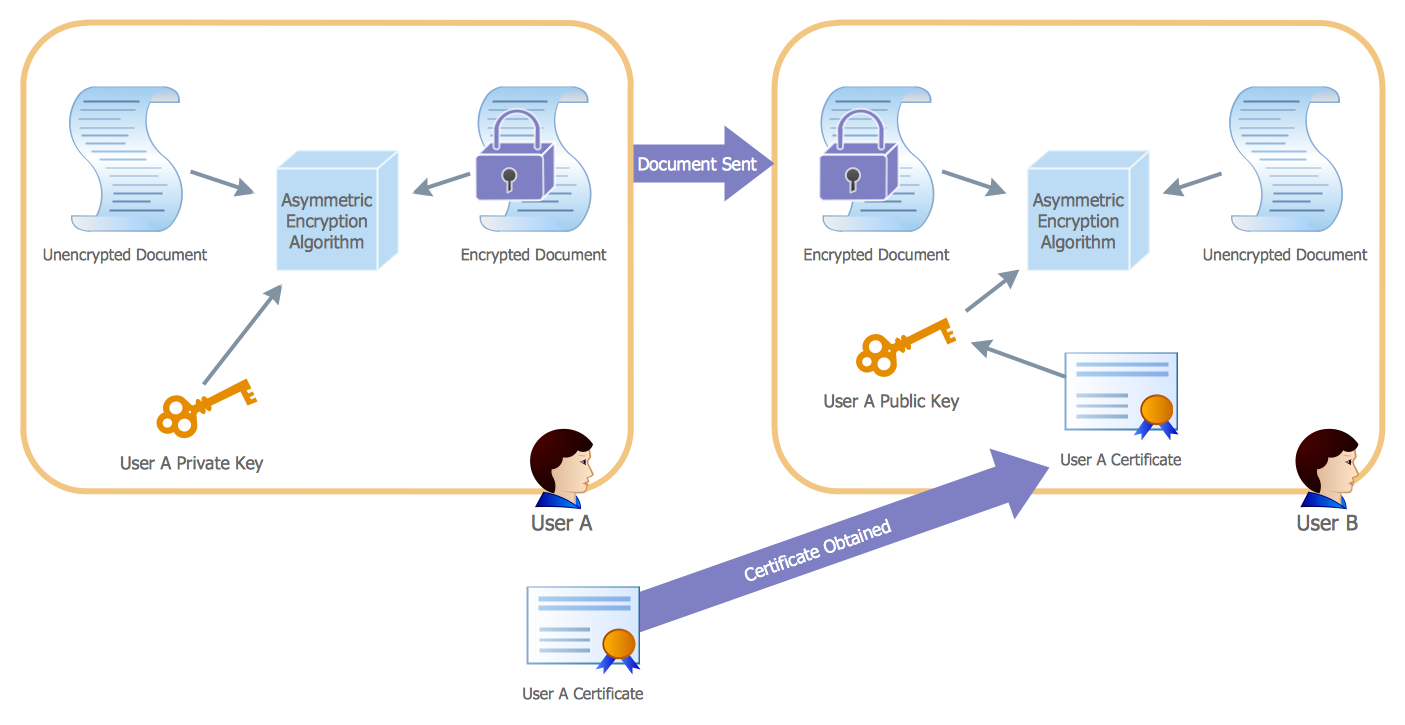
The Active Directory Diagrams solution from ConceptDraw Solution Park extends ConceptDraw PRO diagramming and vector drawing software to help network engineers, designers and administrators efficiently design and create various active directory diagrams.Relations Diagram
The Relations Diagram is used to identify how the factors influence each other, to determine what factors are causes and what are effects. The factors mostly influencing are called “drivers”, the primarily affected factors are “indicators”. The problem solving is focused on the change of "drivers" factors by applying the corrective actions. The "indicators" factors help establish the Key Performance Indicators (KPIs) to monitor the changes and also define the effectiveness of the corrective actions in resolving a problem. ConceptDraw MINDMAP software ideally suits for designing Relations Diagrams. The easiest way to create the MINDMAP Relations Diagram, is to use the included Relations Diagram input template. Open it in ConceptDraw MINDMAP application from the Input tab and hold a new brainstorming session, identify the central issue and the contributing factors to this issue. Click the Finish Brainstorm button to generate a Mind Map and begin the further work with it, or select Relations Diagram item from the Output tab to automatically draw it in ConceptDraw PRO application.Risk Diagram (Process Decision Program Chart)
The Risk Diagram or Process Decision Program Chart (PDPC) is intended to determine the risks of potential obstacles during the corrective actions that can be at the cases of their incorrect performing, and helps to develop effective preventive actions. Process Decision Program Chart it's kind of contingency plan to limit the risks, it determines the consequential impacts of failures on the activity plans. The Risk Plans and Process Decision Program Charts can be extended on several levels and take the form of tree or hierarchy, this form is incredibly convenient for representing the risks and countermeasures. ConceptDraw MINDMAP is powerful software tool for Business, Marketing and Project Management. It is also ideal for easy designing MINDMAP Risk Diagram or Process Decision Program Chart, due to the included "7 Management and Planning Tools" solution to ConceptDraw Solution Park. We recommend to start with Process Decision Program Chart (PDPC) template opening it from ConceptDraw STORE or from the Output tab at ConceptDraw MINDMAP application.Fishbone Diagram Example
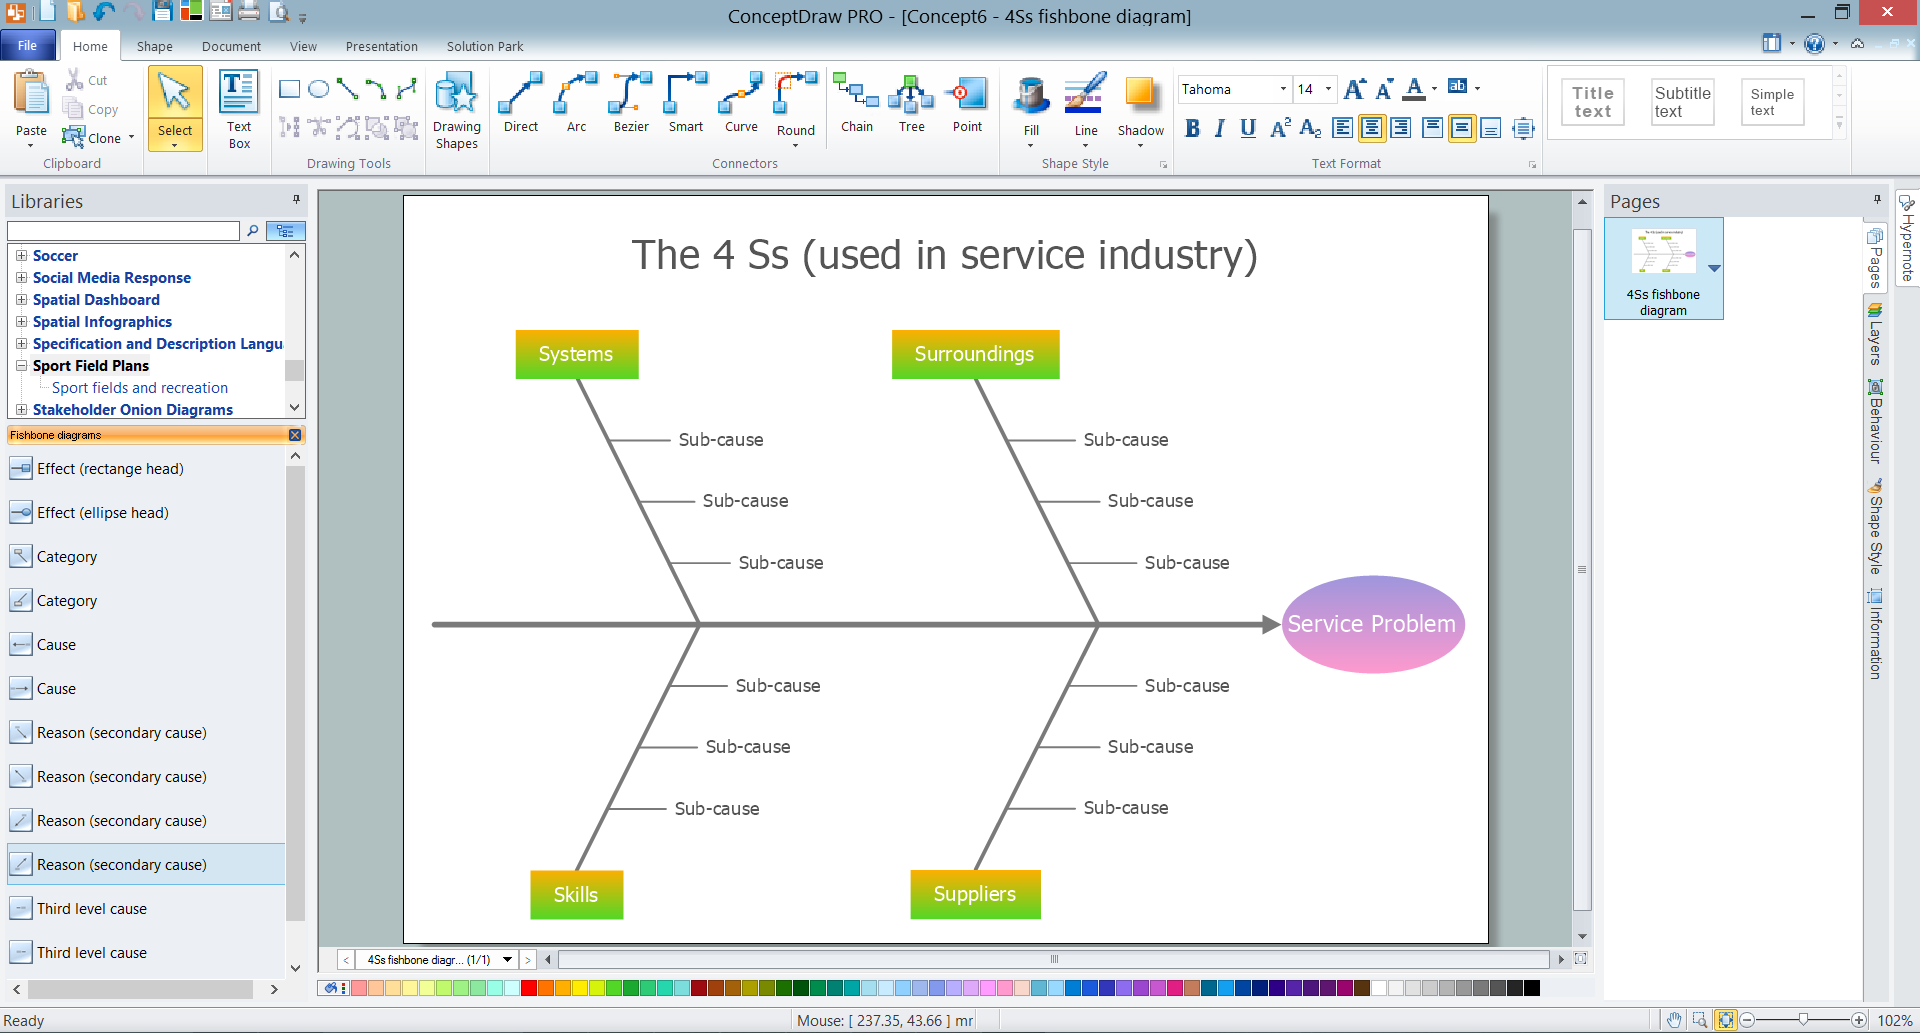
Fishbone Diagram, also referred as Cause and Effect diagram or Ishikawa diagram, is a fault finding and problem solving tool. Construction of Ishikawa diagrams is quite complicated process and has a number of features. Fishbone Diagrams solution included to ConceptDraw Solution Park contains powerful drawing tools and a lot of examples, samples and templates. Each Fishbone diagram example is carefully thought-out by experts and is perfect source of inspiration for you.Root Cause Tree Diagram
The Root Cause Tree Diagram is a chart that helps determine the root causes of factors that influence the problem, to represent and analyze them. This diagram is constructed separately for each high priority factor. First it is needed to identify the root causes for a factor, display their structure and then propose the possible corrective actions. But how to create Root Cause Tree Diagram with the least efforts and time? ConceptDraw MINDMAP will effectively help you in drawing MINDMAP Root Cause Tree Diagram and Root Cause Analysis Tree Diagram used for further formulation of actions. The Root Cause Tree Diagram template, which can be opened at the program from the Input tab, supplies you with a basic mind map structure for your diagram. The central idea describes briefly a problem, the main topics represent the high-level causes of a problem, their subtopics give more details about the different parts of given causes. At the last level of tree are described the potential solutions to each of detailed parts of the causes.Activity Network Diagram Method
Activity Network Diagram - This sample was created in ConceptDraw PRO diagramming and vector drawing software using the Seven Management and Planning Tools solution from the Management area of ConceptDraw Solution Park. This sample shows the PERT (Program Evaluation Review Technique) chart of the request on proposal. A request for proposal (RFP) is a request of the company or the organization to potential suppliers to submit the business proposals for service or goods that it is interested to purchase. The RFP is represented on the initial procurement stage and allows to define the risks and benefits.Fishbone Problem Solving Tool
Fishbone diagram, often reffered as Cause and Effect diagram or Ishikawa diagram, is one of the basic and the most effective tools for problems solving. It is a way of graphical identifying, structuring and exploration the root causes of a problem for determining effective decision. ConceptDraw PRO enhanced with Fishbone Diagrams solution is a professional fishbone problem solving tool which helps you draw Business Productivity diagram, Cause and Effect, Fishbone, Ishikawa Diagrams to solve problems at your business.7 Management & Planning Tools
The 7 Management and Planning Tools solution available from ConceptDraw Solution Park implements well-known methodologies and provides the comprehensive set of tools for problems' analysis and solving. Different products from multifunctional ConceptDraw Office suite may be used as a complete solution for any of methodologies offered by this solution and provide a visual communication during every stage of work. Use the MINDMAP 7 Management & Planning Tools for step-by-step identification and analysis the problems, for planning solving and corrective actions, and also countermeasures to address the risks. 7 Management and Planning Tools solution is perfect for managers in medium to large companies, who require effective tools to address the management issue, for business consultants, trainers and coaches to help visualize the problem's solving by using 7 MP Tools methodology, to structure the problem's affecting factors, analyze their root causes and cause and effect relations, to highlight drivers and indicators factors, to prioritize factors using ranking by criteria set.- Pdf Of Tree Diagram In Nanagement
- Matrix Organization | Process Flowchart | Affinity Diagram | Modified ...
- Mind Map Affinity Diagram Pdf
- Affinity Diagram | Affinity diagram - Implementing continuous ...
- 7 Management And Planning Tools Pdf
- Affinity Diagram | Affinity Diagram Software | Affinity Diagram ...
- Affinity Diagram Software | Affinity Diagram | Affinity Diagram ...
- Basic Diagramming Flowchart Software | Biology | Illustration ...
- Bio Diagram Pdf
- Personal Swot And Tows Pdf
- Form Maker | Process Diagrams | How to Draw a Natural Landscape ...
- Affinity diagram - Implementing continuous process improvement ...
- Affinity Diagram | Affinity Diagram | Process Diagrams | Natural ...
- Seven Management and Planning Tools | Affinity diagram ...
- Processes Of Site Analysis With Sketches Pdf
- Cause And Effect Analysis Pdf
- Krebs Cycle Diagram Pdf
- Drawing Xml Diagrams Pdf
- Process Decision Program Chart Pdf
