PDPC
ConceptDraw DIAGRAM extended with Seven Management and Planning Tools Solution from the Management Area of ConceptDraw Solution Park is the best software for drawing all types of diagrams from the Seven Management and Planning Tools: Affinity Diagram, Relations Diagram, Prioritization Matrix, Root Cause Analysis Tree Diagram, Involvement Matrix, PERT Chart, and Risk Diagram (PDPC).Prioritization Matrix
You can design the Prioritization Matrix by hand on the paper, but we offer you the most easier way — to use the ConceptDraw DIAGRAM diagramming and vector drawing software extended with Seven Management and Planning Tools Solution from the Management Area.
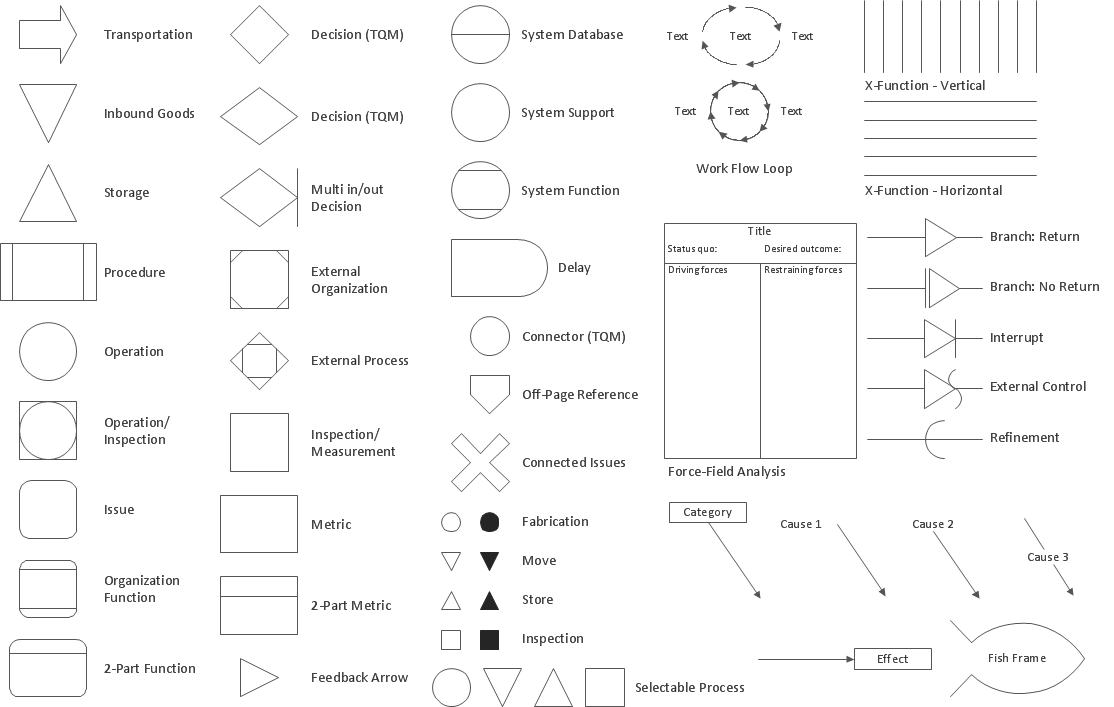
Total Quality Management Density
The Total Quality Management Diagram solution helps you and your organization visualize business and industrial processes. Create Total Quality Management diagrams for business process with ConceptDraw software.UML Sample Project
Unified Modeling Language (UML) is a graphical modeling language for describing, visualizing, projecting and documenting of object oriented systems. UML digram is used for modeling of organizations and their business processes, for development the big projects, the complex software applications. Comprehensive UML diagram allows to create the set of interrelated documents that gives the complete visual representation of the modeling system.Business Calendar
Business calendar is a special type of calendar, it must be functional, convenient for scheduling the affairs and meetings, and also must have strict, official and unobtrusive interface. So you must pay special attention to the business calendar design. Now you don't need to be an artist to design business calendar thanks to the unique drawing tools of Calendars Solution for ConceptDraw DIAGRAM diagramming and vector drawing software.Affinity Diagram
The affinity diagram is a business tool used to organize ideas and data. It is one of the Seven Management and Planning Tools. But how design the Affinity Diagram quick and easy? ConceptDraw DIAGRAM diagramming and vector drawing software offers the Seven Management and Planning Tools Solution from the Management Area.HelpDesk
How To Create Risk Diagram (PDPC) Using Solutions
Risk diagram is used to identify possible risks in accomplishing corrective actions. With the Risks diagram, one analyzes each action separately in a tree of all actions and develops a preventive action in response to each potential obstacles or circumstances which may be a risk. The ability to create a Risk diagram from a mind map is supported by the ConceptDraw Seven Management and Planning Tools solution. This article describes how to identify possible risks when carrying out corrective actions, and define preventive actions.Seven Management and Planning Tools
Seven Management and Planning Tools solution extends ConceptDraw DIAGRAM and ConceptDraw MINDMAP with features, templates, samples and libraries of vector stencils for drawing management mind maps and diagrams.
Root Cause Tree Diagram
Analyze the root causes of factors that influence the problem. A diagram is constructed separately for each high priority factor. Identify the root causes for a factor and then propose possible corrective actions. The diagram displays the structure of causes for a factor and possible corrective actions. The Root Cause Analysis Tree Diagram is used for further formulation of actions.Affinity Diagram Software
Affinity Diagram Software - ConceptDraw DIAGRAM is a powerful diagramming and vector drawing software that allows quick, easy and effective create the Affinity Diagrams.Seven Management and Planning Tools solution from the Business Productivity area of ConceptDraw Solution Park provides templates, samples and ready-to-use vector stencils that will help you design the professional looking Affinity Diagrams in a few moments.
7 Management & Planning Tools
The "7 Management and Planning Tools" solution implements well-known methodologies for problem analysis and solving. Different products from the ConceptDraw Office suite can be used as a complete solution for any of the methodologies in this solution. ConceptDraw Office provides visual communication during every stage of work.Bubble Charts
Bubble Charts are convenient way to visualize ideas and concepts by organizing them in a hierarchy. To show the importance of ideas you can use different bubble sizes and colors. ConceptDraw DIAGRAM diagramming and vector drawing software extended with Bubble Diagrams Solution from the "Diagrams" Area affords you the easiest and fastest way for designing professional looking Bubble Charts.Workflow Diagram
Workflow diagram visually describes an repeatable pattern of organizational activity powered by resources. Workflow diagram explains and document the process flow which needs to be organized or exists and needs to be learned and executed. Workflow diagram can be part of project documentation, company policies or sertification process to comply a standard.The workflow represents the transferring of data, documents or tasks during a work process. To make it easier to study and analyze working processes, and to present them in a simple visual manner, workflow diagrams are used. To create these diagrams professional use workflow diagram maker software ConceptDraw DIAGRAM.
Fault Tree Diagram
ConceptDraw DIAGRAM diagramming and vector drawing software offers the Fault Tree Analysis Diagrams Solution from the Industrial Engineering Area of ConceptDraw Solution Park for quick and easy creating the Fault Tree Diagram of any degree of detailing.House of Quality Matrix Software
House of Quality Matrix Software - Use the predesigned objects from the Involvement Matrix Objects Library from the Seven Management and Planning Tools Solution to create professional looking House of Quality Matrices in minutes.- PDPC | Prioritization Matrix | Affinity Diagram | Pdpc Ppt
- Swot Analysis In Healthcare Ppt
- 7 Management And Planning Tools Pdf
- Export from ConceptDraw PRO Document to PPT or PPTX (MS ...
- Ppt Drawing Tools
- How to Create a PowerPoint Presentation from a SWOT Analysis ...
- PDPC | Risk diagram ( PDPC ) - Template | Process decision ...
- Powerpoint Tree Diagram Template
- Diagram Pdpc
- Pdpc In Industrial Management
- Decision Tree Analysis In Project Management Ppt
- PDPC | Preventive Action | Process decision program chart ( PDPC ...
- Risk Diagram (Process Decision Program Chart) | Process decision ...
- Mind Map Affinity Diagram Pdf
- Prioritization Matrix | PROBLEM ANALYSIS. Prioritization Matrix ...
- Problem Tree Analysis Ppt
- Affinity Diagram | Affinity diagram - Implementing continuous ...
- How To Create an Affinity Diagram Using ConceptDraw Office ...
- Ppt Of Planning And Tool Design
- Affinity Diagram Software | Affinity Diagram | Affinity Diagram ...
- ERD | Entity Relationship Diagrams, ERD Software for Mac and Win
- Flowchart | Basic Flowchart Symbols and Meaning
- Flowchart | Flowchart Design - Symbols, Shapes, Stencils and Icons
- Flowchart | Flow Chart Symbols
- Electrical | Electrical Drawing - Wiring and Circuits Schematics
- Flowchart | Common Flowchart Symbols