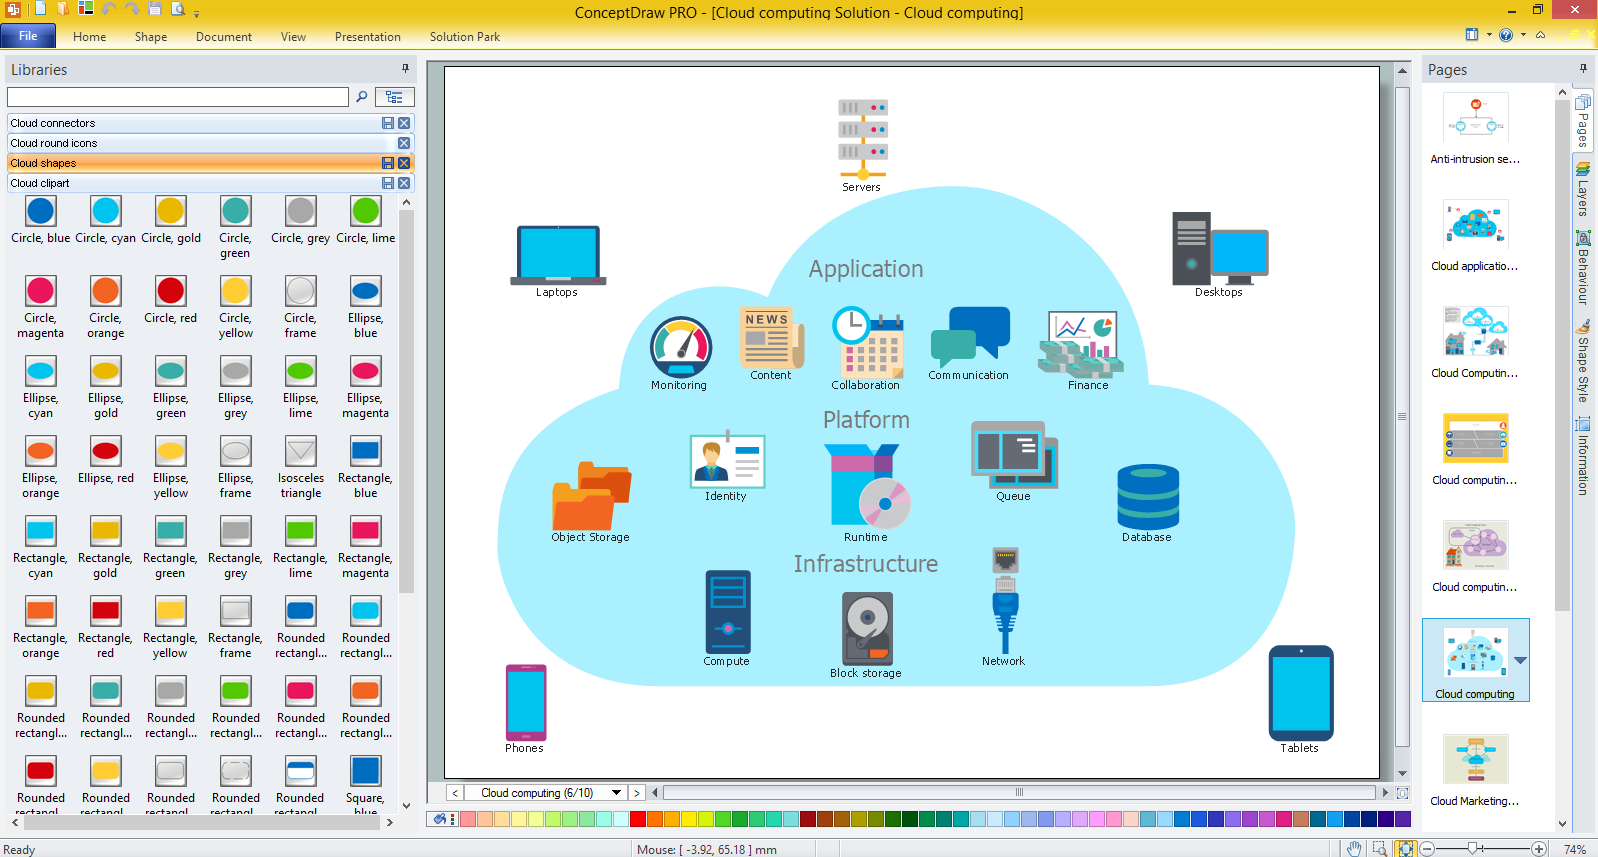
This vector stencils library contains 195 cloud computing icons.
Use it to design cloud computing infographic and diagrams with ConceptDraw PRO software.
"Cloud computing, also on-demand computing, is a kind of Internet-based computing that provides shared processing resources and data to computers and other devices on demand. It is a model for enabling ubiquitous, on-demand access to a shared pool of configurable computing resources (e.g., networks, servers, storage, applications and services), which can be rapidly provisioned and released with minimal management effort. Cloud computing and storage solutions provide users and enterprises with various capabilities to store and process their data in third-party data centers.
Cloud computing has become a highly demanded service or utility due to the advantages of high computing power, cheap cost of services, high performance, scalability, accessibility as well as availability." [Cloud computing. Wikipedia]
The vector stencils library "Cloud clipart" is included in the Cloud Computing Diagrams solution from the Computer and Networks area of ConceptDraw Solution Park.
Performance Indicators
ConceptDraw PRO diagramming and vector drawing software offers the useful tools of the Sales Dashboard solution from the Marketing area for easy creating professional looking live dashboards which allow to track the business sales activity and progress thanks to representing the Key Performance Indicators (KPIs) on them.Flowchart Example: Flow Chart of Marketing Analysis
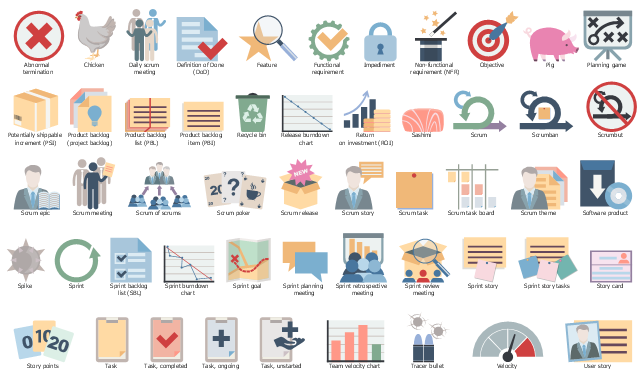
An example flowchart of marketing analysis shows main steps you have to challenge writing a marketing analysis.The vector stencils library "Scrum artifacts" contains 52 icons.
Use this clipart set to design your agile software development diagrams and infographics with ConceptDraw PRO software.
"Product backlog
The product backlog comprises an ordered list of requirements that a scrum team maintains for a product. It consists of features, bug fixes, non-functional requirements, etc.—whatever must be done to successfully deliver a viable product. The product owner orders the product backlog items (PBIs) based on considerations such as risk, business value, dependencies, and date needed. ...
Sprint backlog
The sprint backlog is the list of work the development team must address during the next sprint. The list is derived by the scrum team selecting product backlog items from the top of the product backlog until the development team feels it has enough work to fill the sprint. This is done by the development team asking "Can we also do this?" and adding product backlog items to the sprint backlog. The development team should keep in mind its past performance assessing its capacity for the new sprint, and use this as a guide line of how much "effort" they can complete.
The product backlog items may be broken down into tasks by the development team. Tasks on the sprint backlog are never assigned; rather, tasks are signed up for by the team members as needed according to the set priority and the development team member skills. This promotes self-organization of the development team, and developer buy-in. ...
Sprint burn-down chart
The sprint burndown chart is a public displayed chart showing remaining work in the sprint backlog. Updated every day, it gives a simple view of the sprint progress. ...
Release burn-down chart
The release burndown chart is the way for the team to track progress and provide visibility. The release burndown chart is updated at the end of each sprint by the scrum master. The horizontal axis of the release burndown chart shows the sprints; the vertical axis shows the amount of work remaining at the start of each sprint." [Scrum (software development). Wikipedia]
The clip art sample "Design elements - Scrum artifacts" is included in the Scrum solution from the Project Management area of ConceptDraw Solution Park.
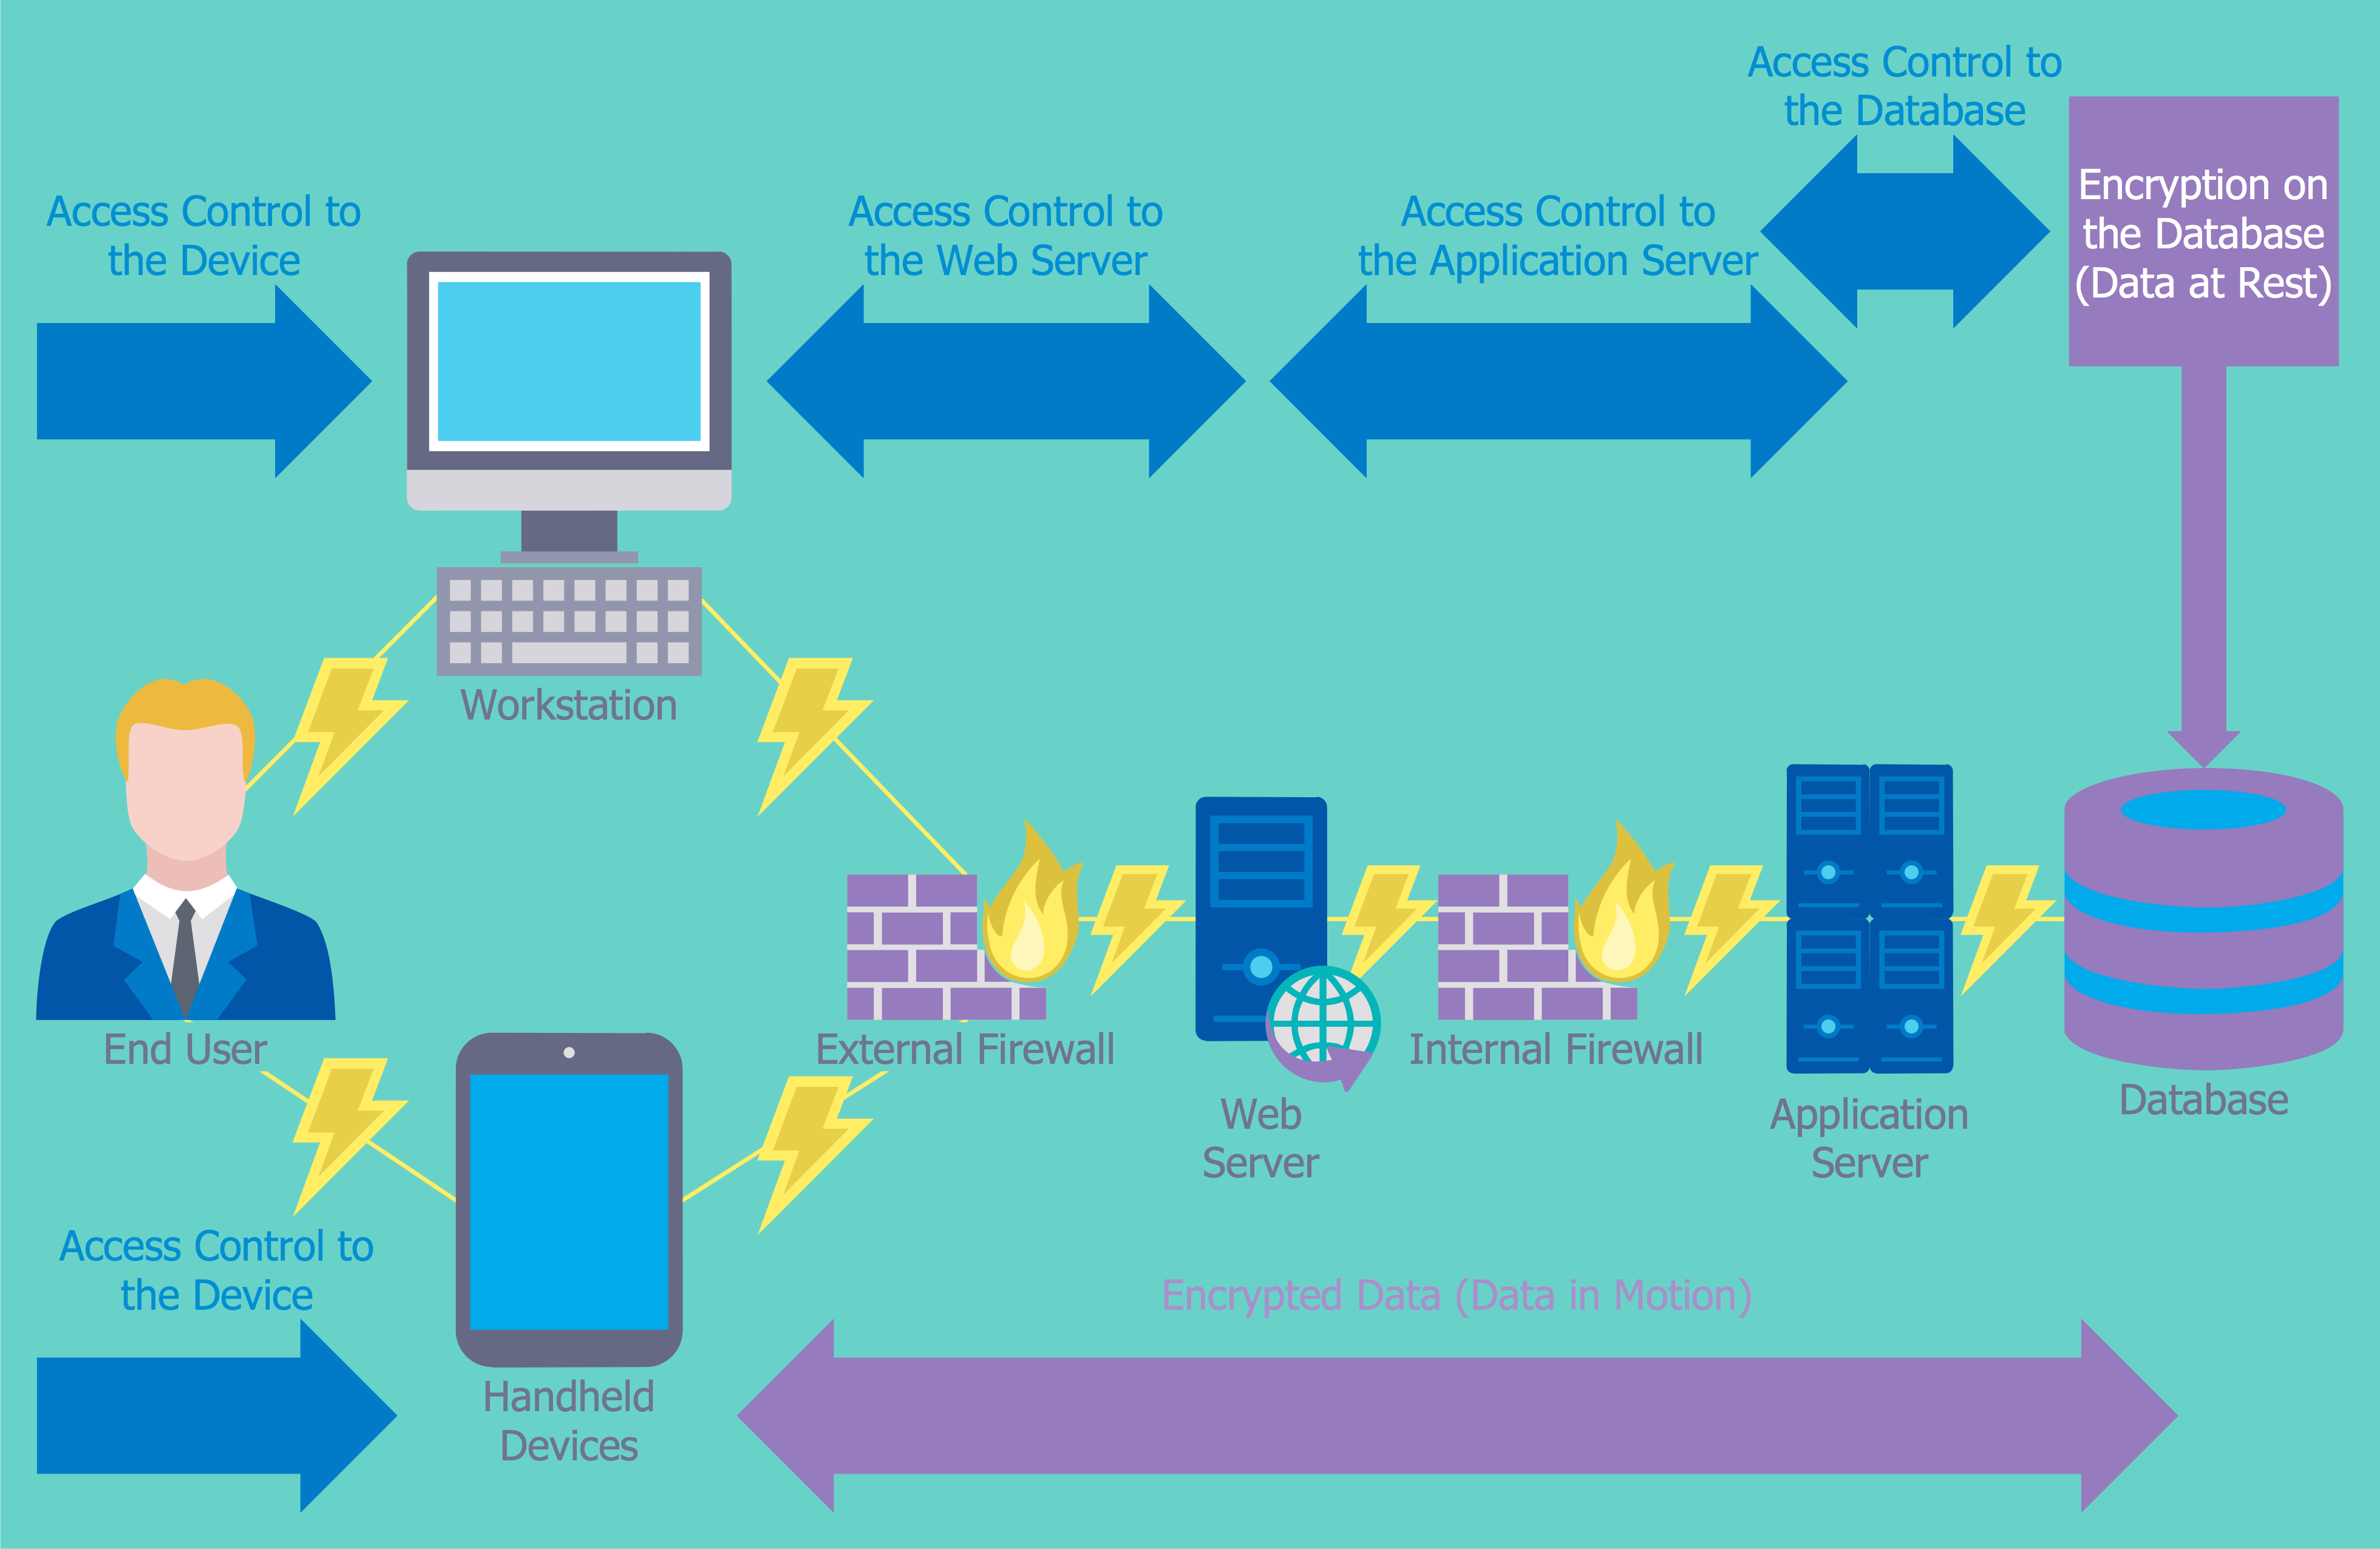
Network Security Devices
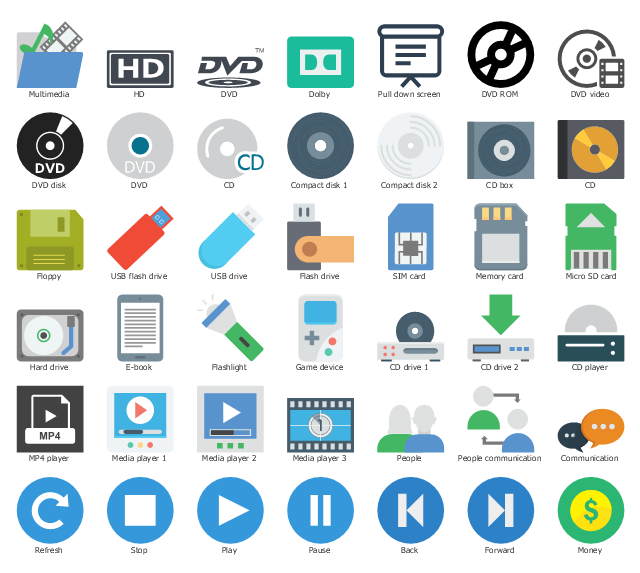
How to describe the necessity of using network security devices and visually illustrate this information? Now, it's very easy thanks to the ConceptDraw PRO diagramming and vector drawing software extended with Network Security Diagrams Solution from the Computer and Networks Area of ConceptDraw Solution Park.The vector stencils library "Media" contains 42 multimedia icons.
Use it to design your audio, video and multimedia illustrations, presentations, web pages and infographics with ConceptDraw PRO diagramming and vector drawing software.
"Multimedia is content that uses a combination of different content forms such as text, audio, images, animation, video and interactive content. ...
Multimedia can be recorded and played, displayed, dynamic, interacted with or accessed by information content processing devices, such as computerized and electronic devices, but can also be part of a live performance. Multimedia devices are electronic media devices used to store and experience multimedia content." [Multimedia. Wikipedia]
The clipart example "Media" is included in the Audio, Video, Media solution from the Illustrations area of ConceptDraw Solution Park.
Create a Flow Chart
Users can start drawing their own flowchart diagrams in fast and simple way with ConceptDraw software.What is Cloud Computing
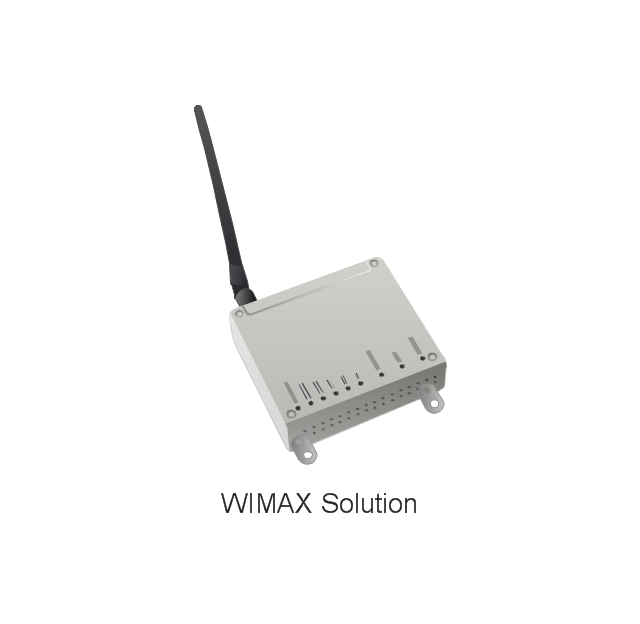
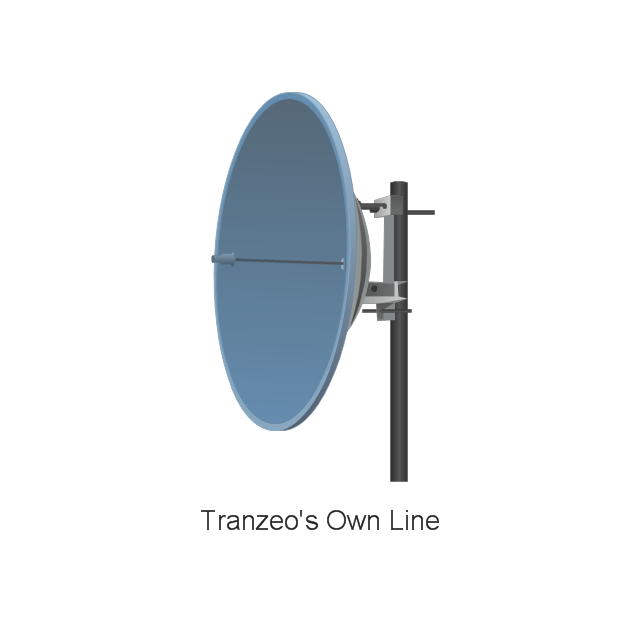
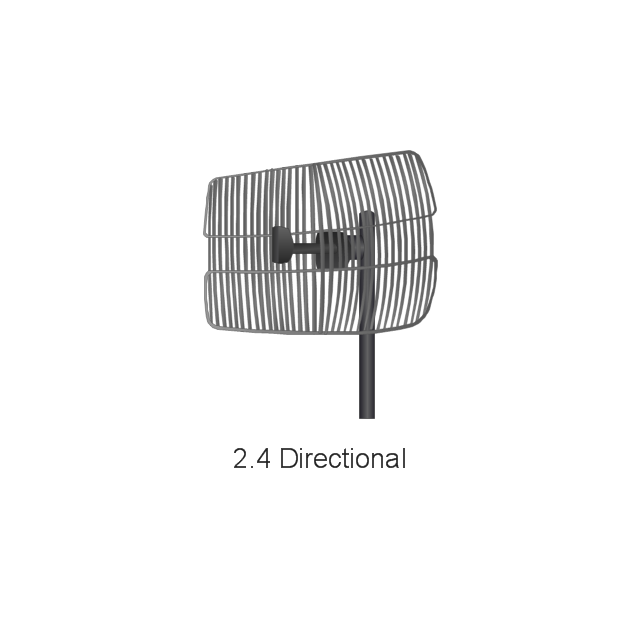
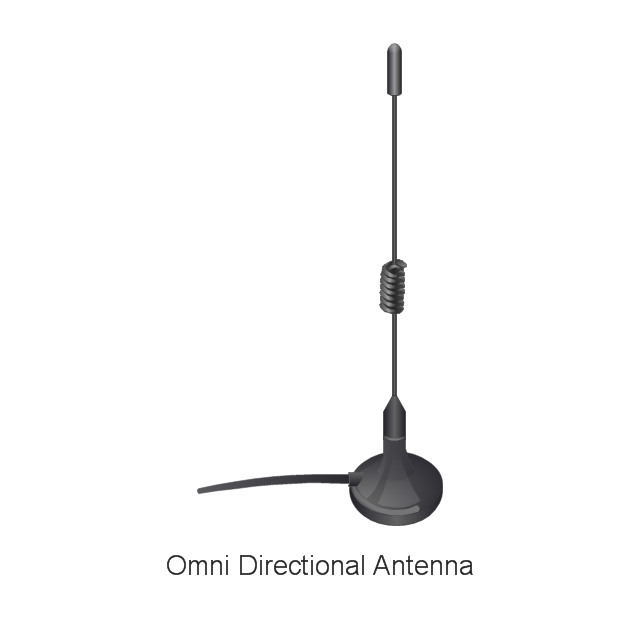
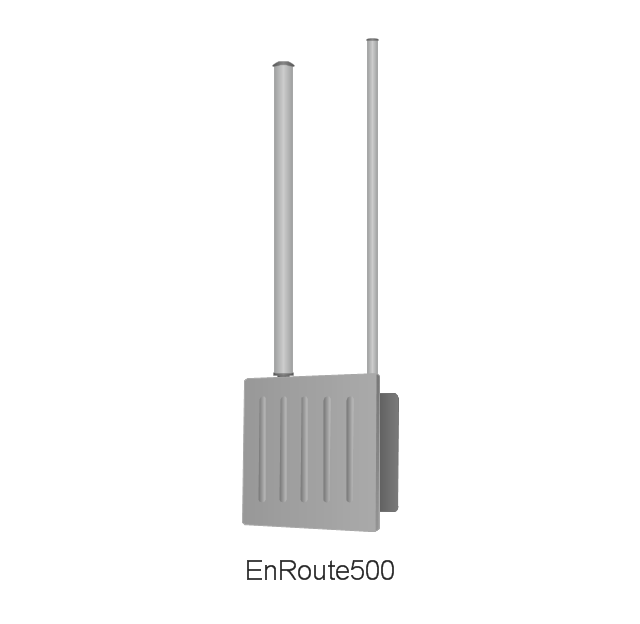
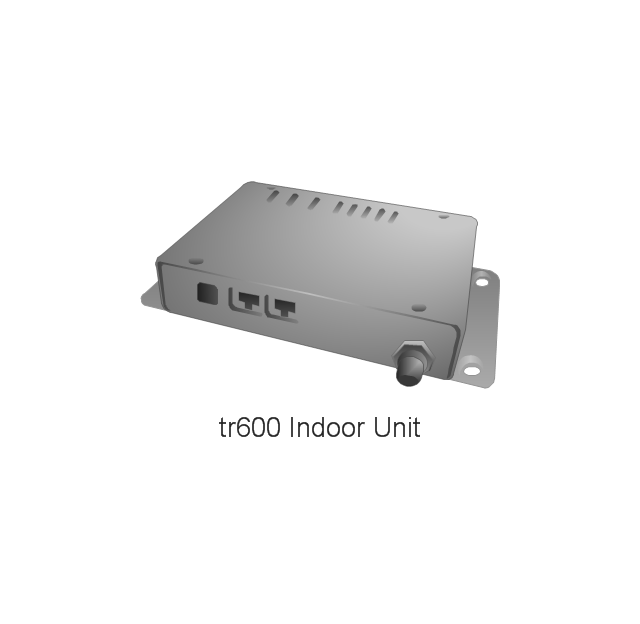
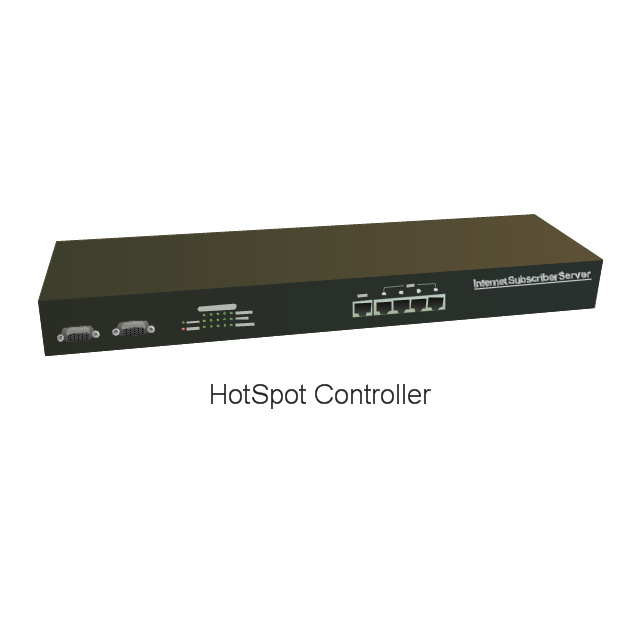
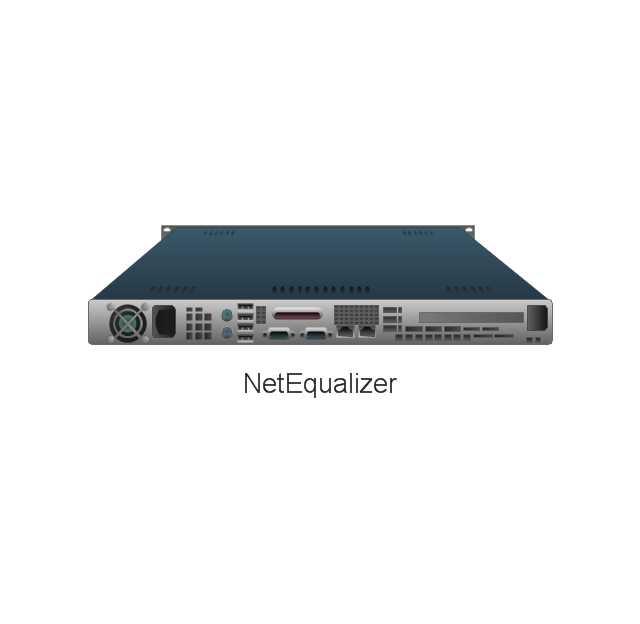
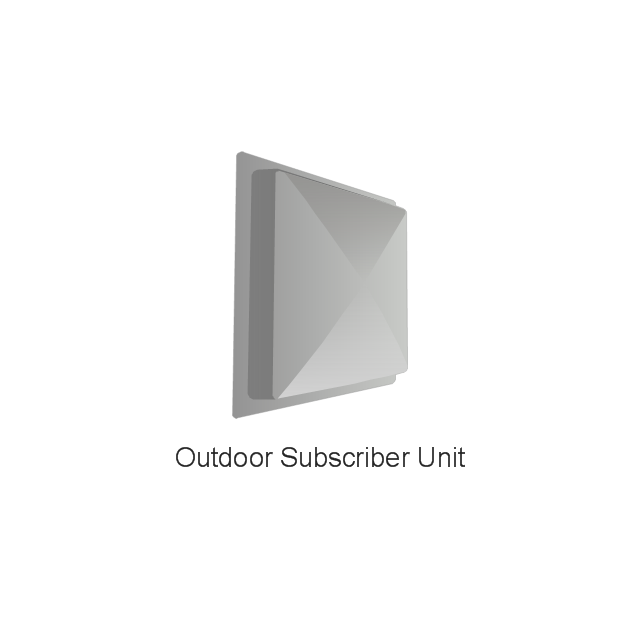
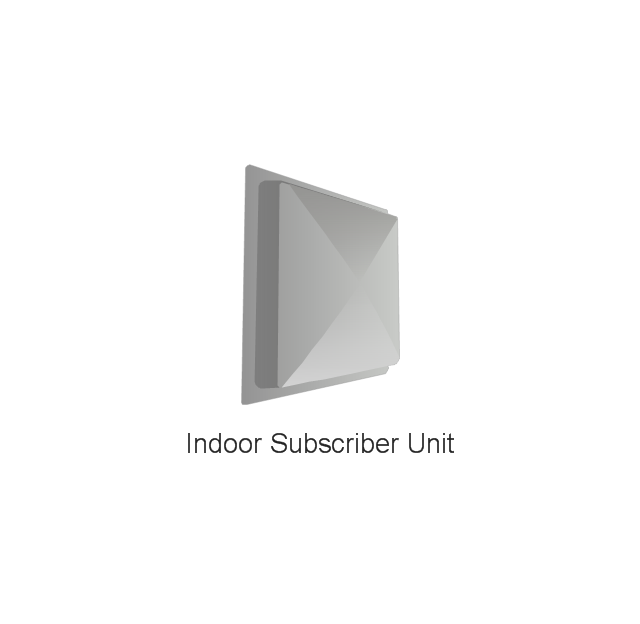
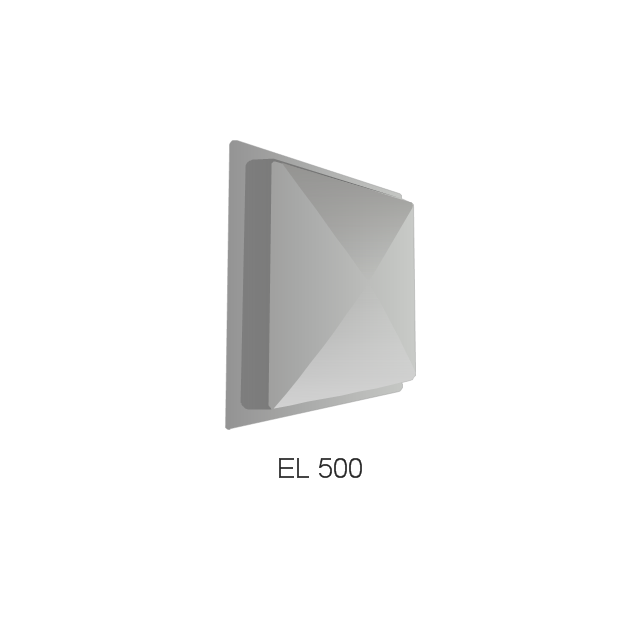
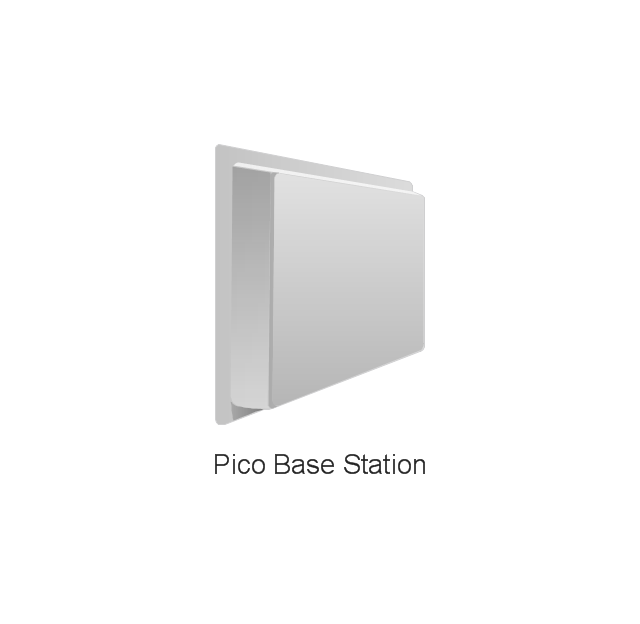
What is Cloud Computing? The Cloud computing is a widely used and highly demanded utility in the modern world thanks to its high computing power, performance, scalability and accessibility, and at the same time low cost of services. The ConceptDraw PRO diagramming and vector drawing software provides an easy and effective Cloud Computing Diagrams solution from the Computers and Network area of ConceptDraw Solution Park for making professional looking Cloud Computing and Cloud Computing Architecture Diagrams.The vector stencils library "Tranzeo" contains 13 clipart icons of Tranzeo devices for drawing computer network diagrams and telecommunication equipment layouts.
"Tranzeo Wireless Technologies Inc. ... leads the wireless broadband industry as a premier manufacturer of high-performance wireless network equipment...
Tranzeo's full spectrum of point-to-point and point-to-multipoint radios, WiMAX equipment, and mesh network solutions are designed for wireless internet service providers, governments, campuses, military, carriers, enterprise customers, and systems integrators..." [tranzeo.com]
The clip art example "Tranzeo - Vector stencils library" was created using the ConceptDraw PRO diagramming and vector drawing software extended with the Telecommunication Network Diagrams solution from the Computer and Networks area of ConceptDraw Solution Park.
www.conceptdraw.com/ solution-park/ computer-networks-telecommunication
Lean Six Sigma Diagram Software
Lean Six Sigma (LSS) is a well-known in all over the world methodology of quality improvement and business perfection. ConceptDraw PRO diagramming and vector drawing software is a powerful Lean Six Sigma Diagram Software thanks to the included Value Stream Mapping solution from the Quality Area of ConceptDraw Solution Park.What is a KPI?
What is a KPI? Key performance indicators (KPIs) represent a set of measures that are focused on the aspects of organizational performance which are the most important for its current and future success. ConceptDraw PRO diagramming and vector drawing software enhanced with Sales Dashboard solution from the Marketing area of ConceptDraw Solution Park allows effectively develop, analyze and improve your business thanks to the excellent possibility of monitoring all KPIs on one screen in a real time.Scrum process work items and workflow
Teams working with Scrum methodology use the product backlog items (PBIs), bug work item types (WITs), reports and dashboards. SCRUM Workflow solution for ConceptDraw PRO software offers collection of samples, variety of predesigned objects, clipart and graphic elements, a set of Scrum process work items and workflow which are developed for agile teams working using Scrum.Work Flow Process Chart
Workflow Diagram - workflow process diagram is a visual representation of a organizational process flow. Often it used as the same visual notation as process flow diagram. Visualising business processes using workflow diagram (workflow process diagram) allows estimate business process efficiency, analyse and optimize the process itself. Workflow diagram helps get focusing on each step and relations between workflow steps. ConceptDraw PRO is software for making workflow diagram. It contains specific designed graphics to draw workflow diagrams effectively. This is workflow diagram maker which do your work process effective.- What is a KPI? | KPIs and Metrics | Performance Indicators | Kpi Clipart
- Performance Management Clip Art
- Meter Dashboard | Cloud clipart - Vector stencils library | Georgia ...
- Kpi Dashboard Clipart
- Performance Monitoring Clipart
- Absenteeism Clipart
- Cafe performance metrics vs. air temperature - Visual dashboard ...
- HR symbols - Vector stencils library | Incentives For Employees Clipart
- HR symbols - Vector stencils library | Motivational Man Clipart Png
- Time Management Clipart Png
- Scrum board | Scrum workflow | Scrum | Management Board Clipart
- Metrics Clipart
- Meter Dashboard | Cloud clipart - Vector stencils library | Sales ...
- Motivation Clipart Png
- Manager Decision Making Clipart
- Profit Graph Arrow Clipart
- Png Clipart Motivation
- CS Odessa Launches New Presentation Clipart Solution for ...
- Performance Indicators | Design elements - Meter indicators ...
- Operations Management Clipart


-cloud-clipart---vector-stencils-library.png--diagram-flowchart-example.png)
-cloud-clipart---vector-stencils-library.png--diagram-flowchart-example.png)


-cloud-clipart---vector-stencils-library.png--diagram-flowchart-example.png)


-cloud-clipart---vector-stencils-library.png--diagram-flowchart-example.png)
-cloud-clipart---vector-stencils-library.png--diagram-flowchart-example.png)



-tranzeo---vector-stencils-library.png--diagram-flowchart-example.png)
