HelpDesk
How To Create a PERT Chart Using PM Easy Solution
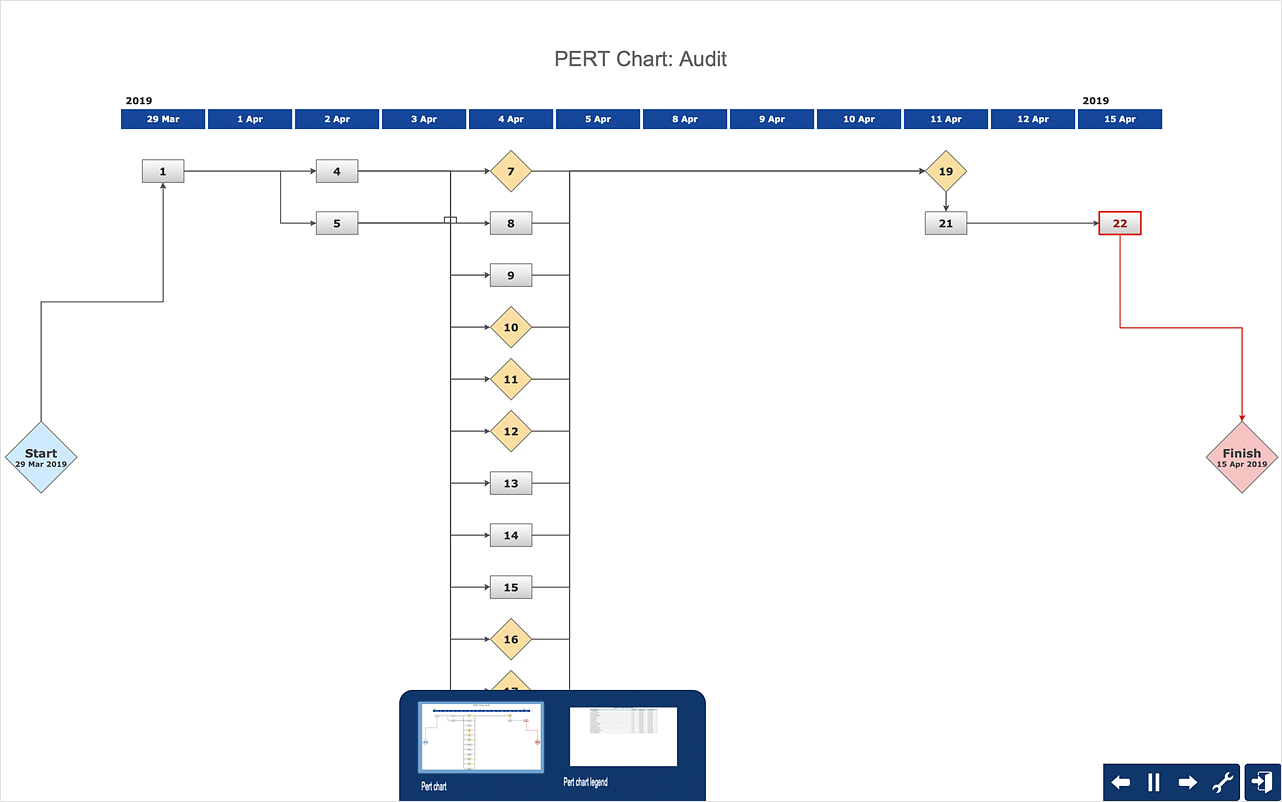
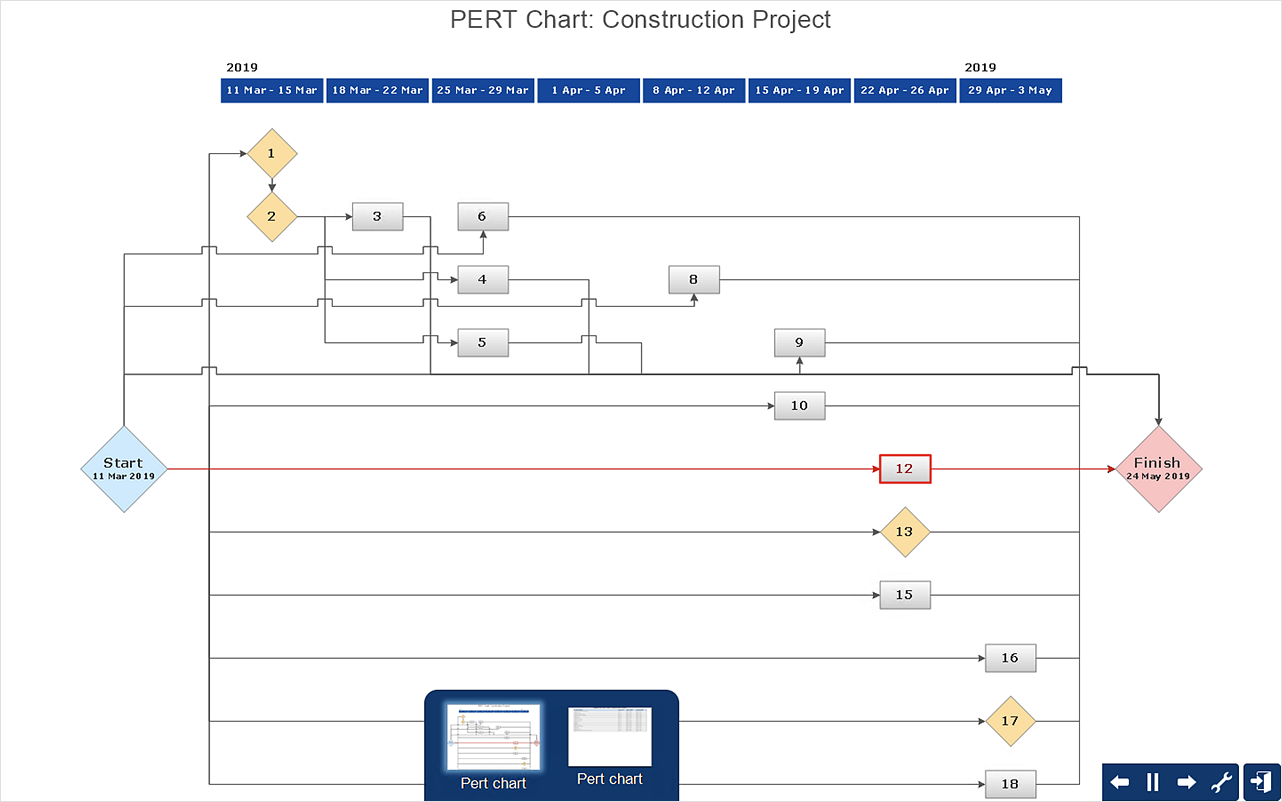
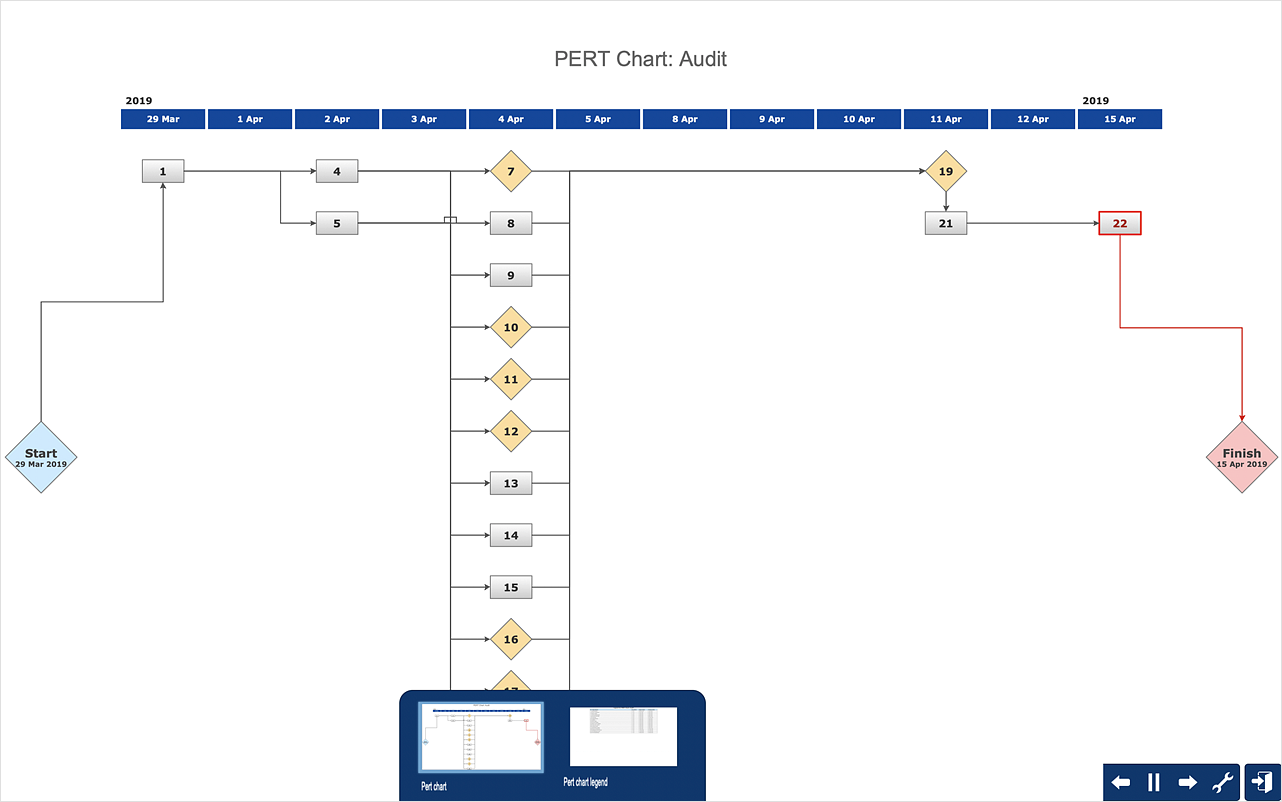
Project Evaluation and Review Technique (PERT) is a method of project tasks evaluation and analysis. PERT - is a method of analyzing the tasks required to complete the project. It includes analysis of the time required to complete each task, as well as the determination of the time required to carry out the whole project. PERT was developed to facilitate the planning of huge and complex projects. PERT is used for very large, complex, and non-standard projects. Technology implies the presence of uncertainty, making it possible to develop a schedule of the project without a precise information on details and time required for all of its components. The most popular part of PERT is a method of the critical path, based on the construction of the network schedule (PERT network diagram). ConceptDraw Office delivers you the best way to create PERT chart for your project using compatibility between ConceptDraw PROJECT and ConceptDraw DIAGRAM.
 Seven Management and Planning Tools
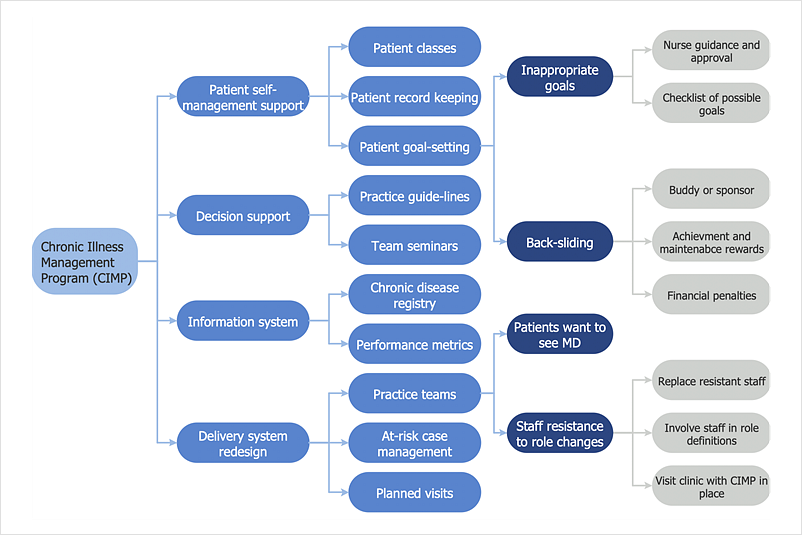
Seven Management and Planning Tools solution extends ConceptDraw DIAGRAM and ConceptDraw MINDMAP with features, templates, samples and libraries of vector stencils for drawing management mind maps and diagrams.
 Seven Management and Planning Tools
Seven Management and Planning Tools solution extends ConceptDraw DIAGRAM and ConceptDraw MINDMAP with features, templates, samples and libraries of vector stencils for drawing management mind maps and diagrams.
HelpDesk
How to Create Project Diagrams on PC
Visual diagrams gives the ability to view at a detailed level project attributes such as project scope, logical connections in the project, critical paths, key events on the timeline, milestones, tasks, calendars for work, and resource utilization.Business diagrams & Org Charts with ConceptDraw DIAGRAM
The business diagrams are in great demand, they describe the business processes, business tasks and activities which are executed to achieve specific organizational and business goals, increase productivity, reduce costs and errors. They let research and better understand the business processes. ConceptDraw DIAGRAM is a powerful professional cross-platform business graphics and business flowcharting tool which contains hundreds of built-in collections of task-specific vector stencils and templates. They will help you to visualize and structure information, create various Business flowcharts, maps and diagrams with minimal efforts, and add them to your documents and presentations to make them successful. Among them are Data flow diagrams, Organization charts, Business process workflow diagrams, Audit flowcharts, Cause and Effect diagrams, IDEF business process diagrams, Cross-functional flowcharts, PERT charts, Timeline diagrams, Calendars, Marketing diagrams, Pyramids, Target diagrams, Venn diagrams, Comparison charts, Analysis charts, Dashboards, and many more. Being a cross-platform application, ConceptDraw DIAGRAM is very secure, handy, free of bloatware and one of the best alternatives to Visio for Mac users.
HelpDesk
How to Manage Problem Solving Using Seven Management and Planning Tools
Stage by stage gouide on using visual tools to move toward solving the problem.
 PM Easy
PM Easy solution extends the ConceptDraw PROJECT functionality with an ability to support neutral methodology of project management and to quickly start a project by listing the task relationships and dependencies, that makes the iterative planning much easier. The project management tool and available visual tools, such as mind mapping, increase the effectiveness of tracking and analysis your project tasks. PM Easy solution from ConceptDraw Solution Park is mainly targeted at project managers in small or medium-sized companies, allowing them to make the project plan and execute projects using mind mapping technique, to implement planning using mind mapping, and to track tasks using ConceptDraw PROJECT application.
 Management Area
The solutions from Management area of ConceptDraw Solution Park collect templates, samples and libraries of vector stencils for drawing the management diagrams and mind maps.
 ConceptDraw Solution Park
ConceptDraw Solution Park collects graphic extensions, examples and learning materials
ConceptDraw DIAGRAM
ConceptDraw DIAGRAM is a powerful business and technical diagramming software tool that enables you to design professional-looking graphics, diagrams, flowcharts, floor plans and much more in just minutes. Maintain business processes performance with clear visual documentation. Effectively present and communicate information in a clear and concise manner with ConceptDraw DIAGRAM.HelpDesk
How to Create Project Diagrams on Mac
Diagrams are very useful for project implementation because they help teams visualize important details such as interrelations between tasks, critical paths, timelines, milestones, calendars, and also resource usage.- Construction Project Chart Examples | Gantt charts for planning and ...
- Process Flowchart | Program Evaluation and Review Technique ...
- Program Evaluation and Review Technique ( PERT ) with ...
- Activity Network ( PERT ) Chart | Process decision program chart ...
- Process Flowchart | Exercise your brain | Activity Network ( PERT ...
- CORRECTIVE ACTIONS PLANNING PERT Chart | Flowchart ...
- Process Flowchart | Program Evaluation and Review Technique ...
- Activity Network ( PERT ) Chart | Activity Network Diagram Method ...
- Process Flowchart | Program Evaluation and Review Technique ...
- Process Flowchart | Program Evaluation and Review Technique ...
- Block diagram - Selling technology patent process | Sales Process ...
- Replacing engine oil - Opportunity flowchart | Activity Network ...
- Business Process Reengineering Examples | Program Evaluation ...
- Pyramid Diagram | Gant Chart in Project Management | PERT chart ...
- How to Draw a Bubble Chart | Program Evaluation and Review ...
- Program Evaluation and Review Technique ( PERT ) with ...
- PERT chart - Project management plan | Bar Diagrams for Problem ...
- Seven Management and Planning Tools | Process Flowchart ...
- Flowchart And Pert


