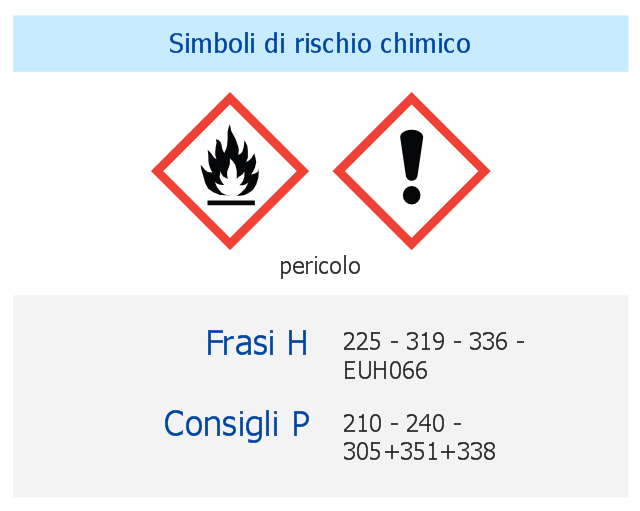
This italian chemical safety infographic example shows the ethyl acetate infobox including 3 sections: GHS hazard pictograms, Hazard statements and Precautionary statements.
It was designed on the base of the table from the Wikimedia Commons file: Consigli P.png. [commons.wikimedia.org/ wiki/ File:Consigli_ P.png]
"Ethyl acetate is the organic compound with the formula CH3–COO–CH2–CH3. This colorless liquid has a characteristic sweet smell (similar to pear drops) and is used in glues, nail polish removers, decaffeinating tea and coffee, and cigarettes (see list of additives in cigarettes). Ethyl acetate is the ester of ethanol and acetic acid; it is manufactured on a large scale for use as a solvent." [Ethyl acetate. Wikipedia]
The chemical safety infographic sample "Acetato di etile" was created using ConceptDraw PRO software extended with the GHS Hazard Pictograms solution from the Engineering area of ConceptDraw Solution Park.
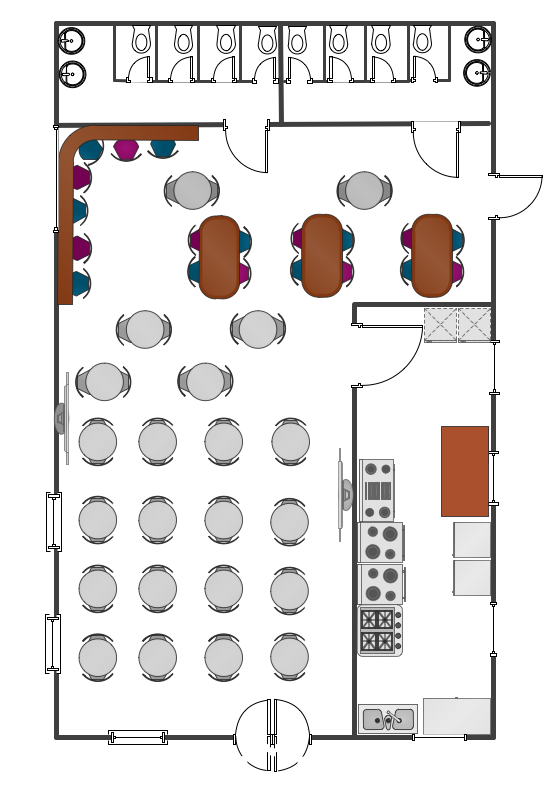
 Cafe and Restaurant Floor Plans
Restaurants and cafes are popular places for recreation, relaxation, and are the scene for many impressions and memories, so their construction and design requires special attention. Restaurants must to be projected and constructed to be comfortable and e
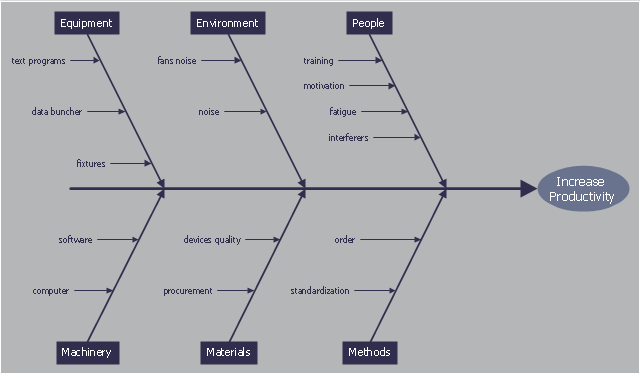
This cause and effect diagram sample was redesigned from the Wikimedia Commons file: Ursache Wirkung Diagramm Beispiel.png. [commons.wikimedia.org/ wiki/ File:Ursache_ Wirkung_ Diagramm_ Beispiel.png]
This file is licensed under the Creative Commons Attribution-Share Alike 3.0 Unported license. [creativecommons.org/ licenses/ by-sa/ 3.0/ deed.en]
"Productivity is the ratio of output to inputs in production; it is an average measure of the efficiency of production. Efficiency of production means production’s capability to create incomes which is measured by the formula real output value minus real input value.
Productivity is a crucial factor in production performance of firms and nations. Increasing national productivity can raise living standards because more real income improves people's ability to purchase goods and services, enjoy leisure, improve housing and education and contribute to social and environmental programs. Productivity growth also helps businesses to be more profitable." [Productivity. Wikipedia]
The fishbone diagram example "Increase in productivity" was created using the ConceptDraw PRO diagramming and vector drawing software extended with the Fishbone Diagrams solution from the Management area of ConceptDraw Solution Park.
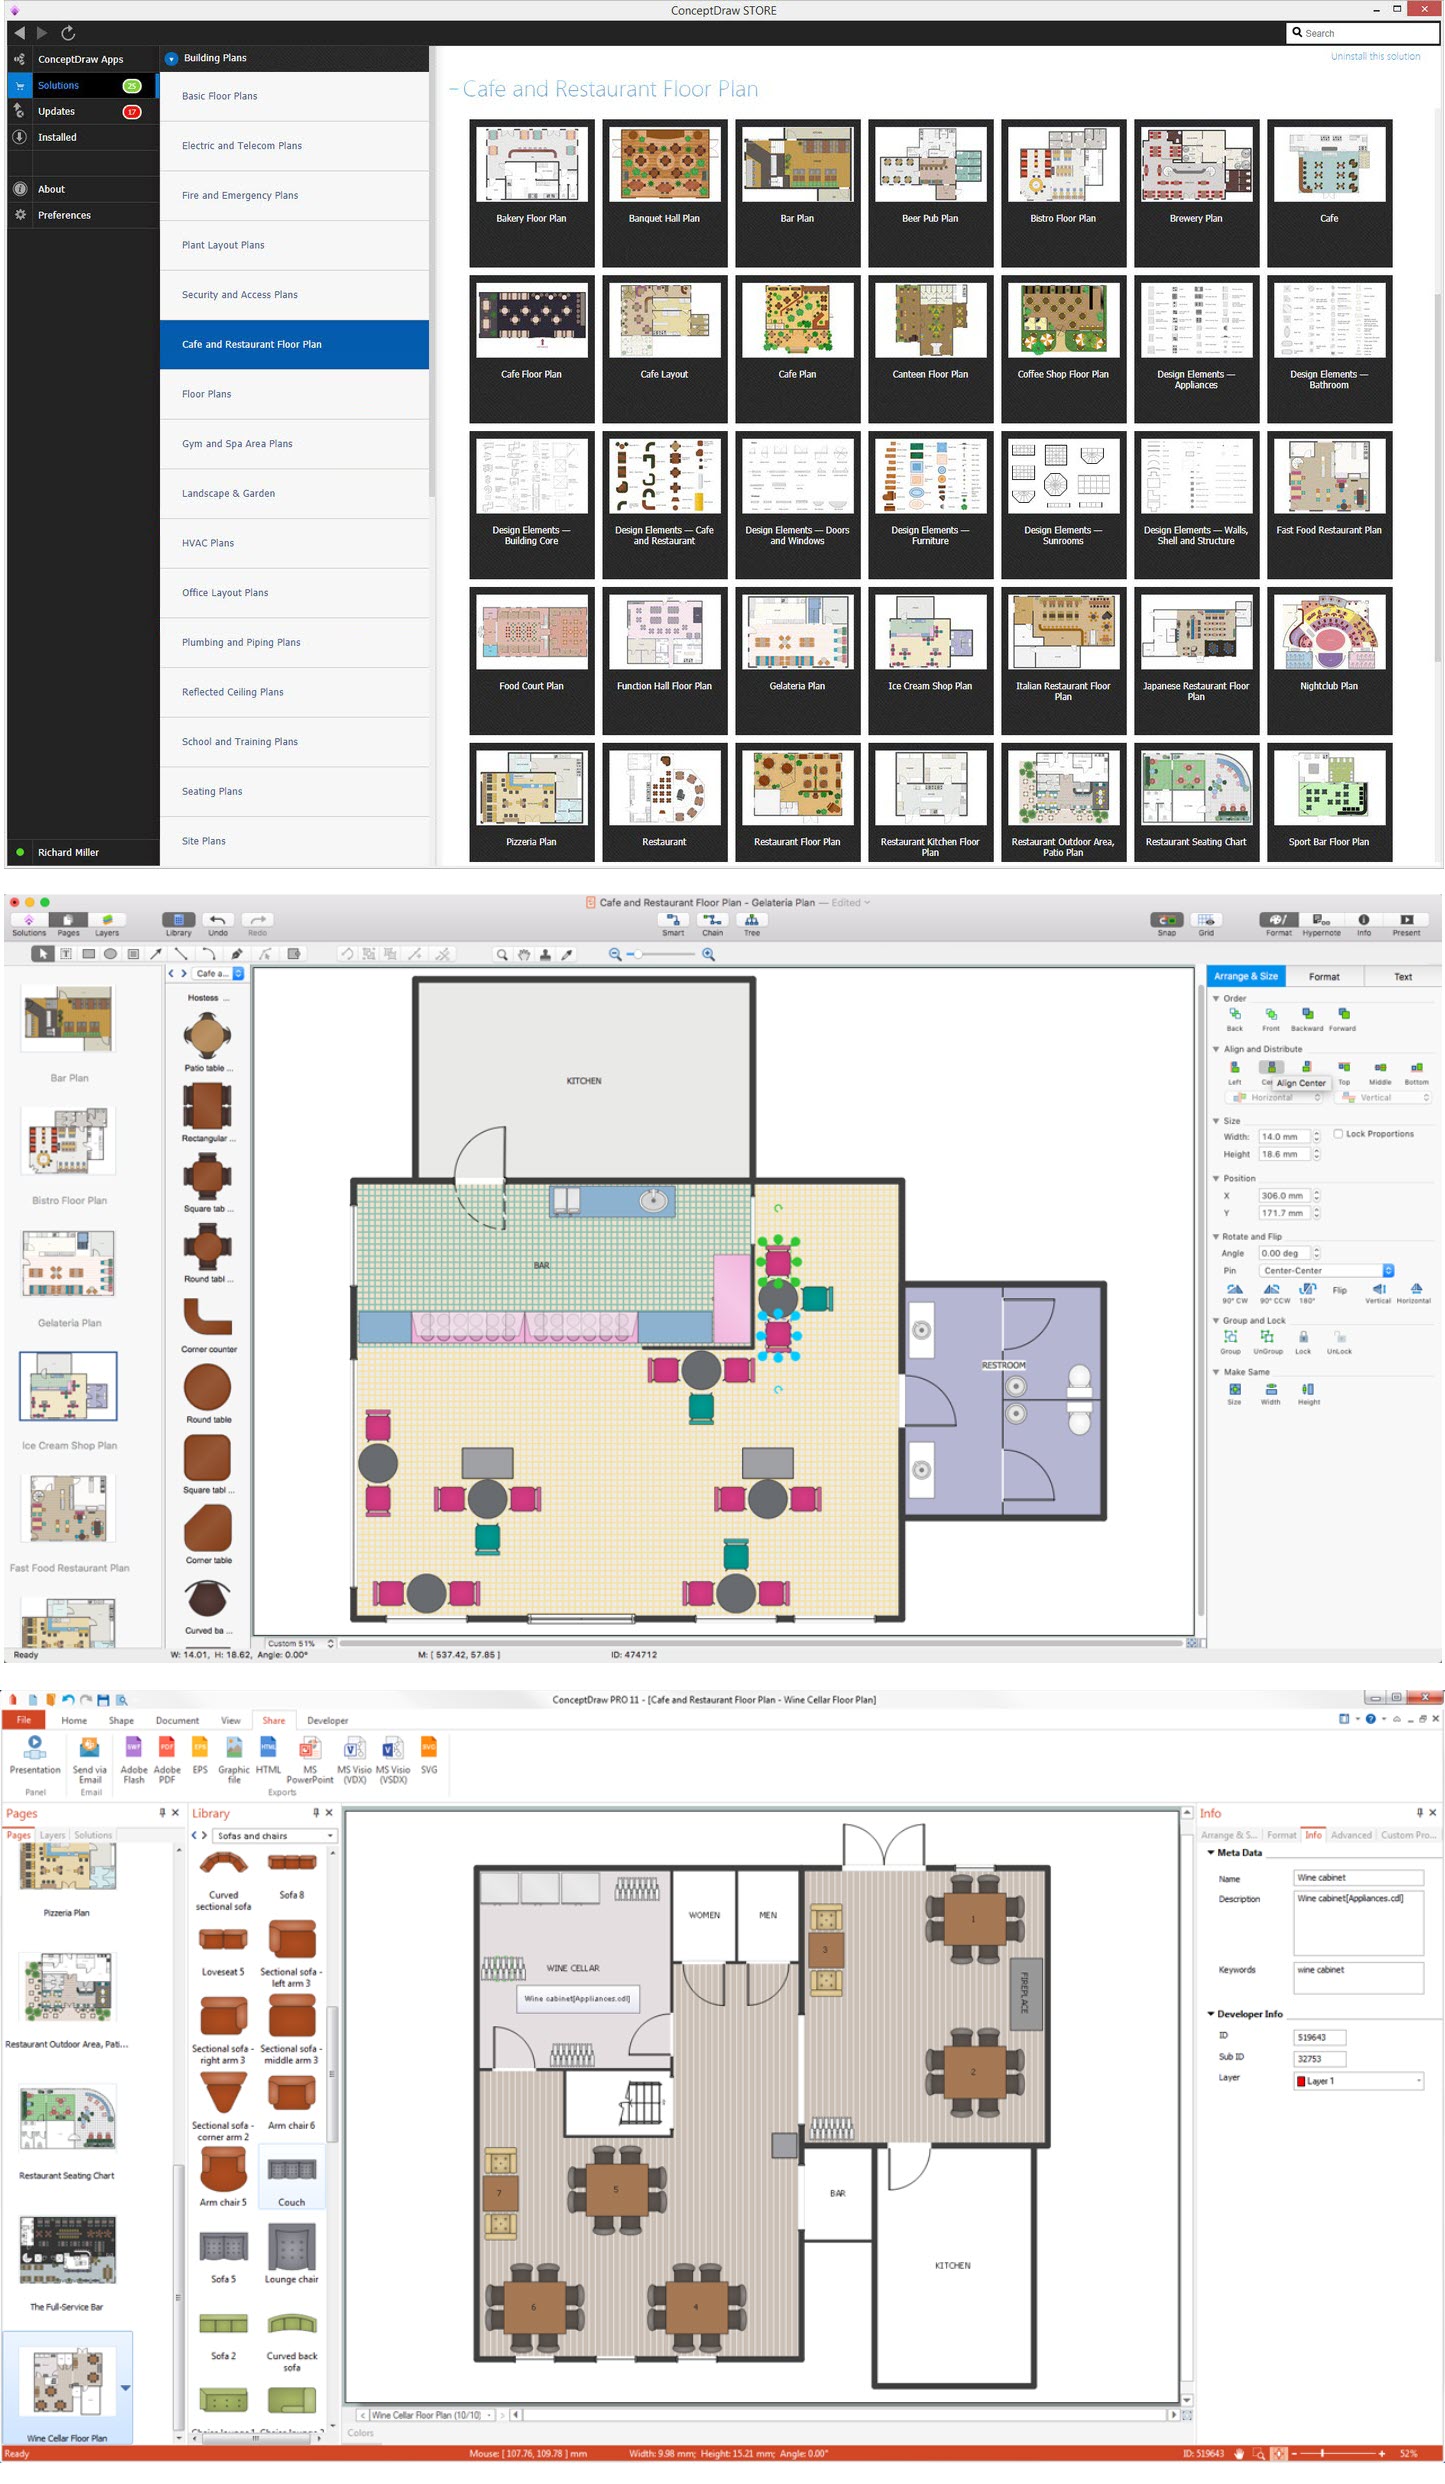
Café Floor Plan Example
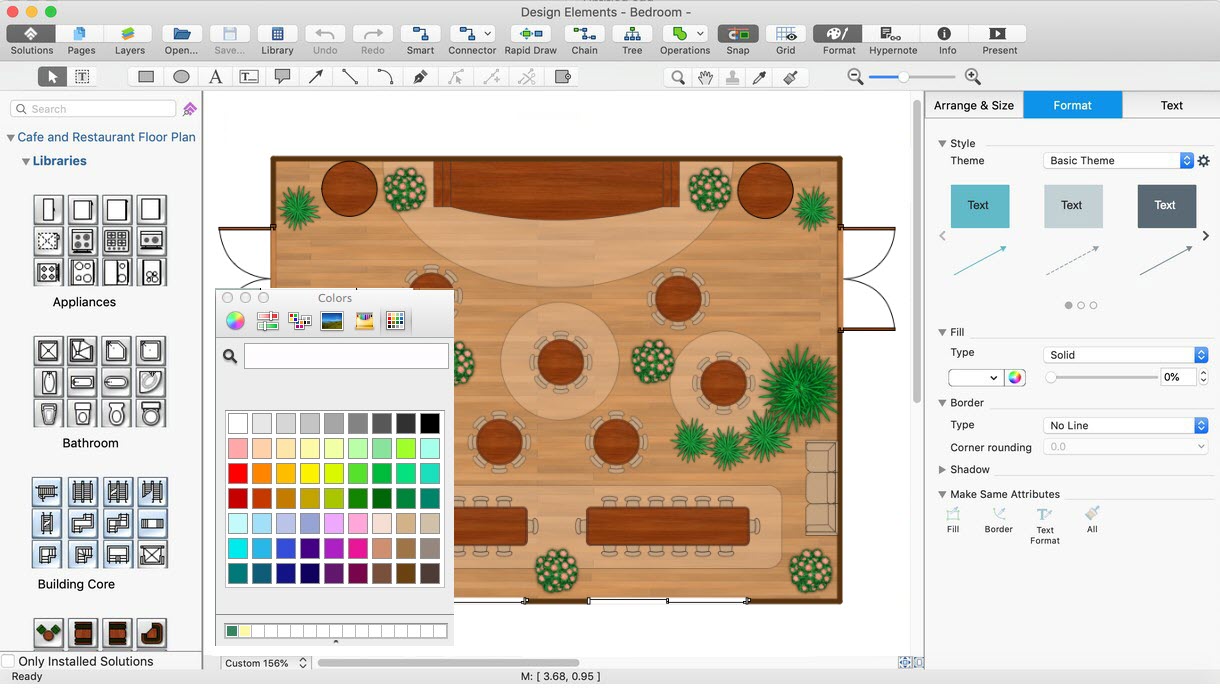
Development and drawing Cafe Layouts and Cafe Floor Plans is the most responsible and important stage at the process of cafe design and construction. On this stage modern architects, constructors and designers prefer apply the special and powerful design applications, which save their time and efforts. ConceptDraw DIAGRAM is the best diagramming and design software for drawing most functional and efficient Cafe floor plans, Cafe layouts, Cafe design plans, Restaurant floor plans, etc. ConceptDraw Solution Park includes Cafe and Restaurant Floor Plan solution at the Building Plans area, which offers special drawing tools, ready sample plans and templates for quick-start drawing, and also extensive set of predesigned vector design elements for construction the general plan of cafe, restaurant, or even banquet hall, the plans of arrangement the furniture, appliances and decor elements. Each included Cafe floor plan example or sample is well thought-out and designed by professionals, so can become a good basis or source of inspiration for your own Cafe floor plan.
 Plumbing and Piping Plans
Plumbing and Piping Plans solution extends ConceptDraw DIAGRAM.2.2 software with samples, templates and libraries of pipes, plumbing, and valves design elements for developing of water and plumbing systems, and for drawing Plumbing plan, Piping plan, PVC Pipe plan, PVC Pipe furniture plan, Plumbing layout plan, Plumbing floor plan, Half pipe plans, Pipe bender plans.
Fishbone Diagram Problem Solving
The Ishikawa diagram, Cause and Effect diagram, Fishbone diagram — all they are the names of one and the same visual method for working with causal connections. Originally invented by Kaoru Ishikawa to control the process quality, the Ishikawa diagram is well proven in other fields of management and personal scheduling, events planning, time management. It is a chart in the form of a fish, whose head is a problem, the fins are variants for its causes. To design easily the Fishbone diagram, you can use a special ConceptDraw DIAGRAM ector graphic and diagramming software which contains the powerful tools for Fishbone diagram problem solving offered by Fishbone Diagrams solution for the Management area of ConceptDraw Solution Park.Network Diagram Software. LAN Network Diagrams. Physical Office Network Diagrams
Physical LAN Diagrams illustrate the communication schemes of Local Area Networks, the physical network connection of computers and networks arrangement on the small areas - at homes, offices, and other buildings. ConceptDraw DIAGRAM is a perfect network diagramming software with samples and examples of WAN and LAN Diagrams, templates and collection of network components libraries. Computer Network Diagrams Solution for ConceptDraw DIAGRAM Mac and Windows is ideal for IT professionals, network engineers and network designers who need to visualize network architecture, to document LANs physical structure and arrangement, to draw Local Area Network (LAN) diagrams and schematics, WAN diagrams, physical office network diagrams and topologies, wiring drawings, etc. You can design all them easy using the predesigned vector objects of computers and computer network devices, hardware devices, peripheral devices, external digital devices, internet and logical symbols, and many other stencils from the Computer Network Diagrams libraries. ConceptDraw DIAGRAM offers a powerful and easy-to-use solution for those who looking for a Visio alternative for Mac. It is a world-class diagramming platform with dynamic presentation power.
