"General packet radio service (GPRS) is a packet oriented mobile data service on the 2G and 3G cellular communication system's global system for mobile communications (GSM). GPRS was originally standardized by European Telecommunications Standards Institute (ETSI) in response to the earlier CDPD and i-mode packet-switched cellular technologies. It is now maintained by the 3rd Generation Partnership Project (3GPP).
GPRS usage is typically charged based on volume of data transferred, contrasting with circuit switched data, which is usually billed per minute of connection time. Usage above the bundle cap is either charged per megabyte or disallowed.
GPRS is a best-effort service, implying variable throughput and latency that depend on the number of other users sharing the service concurrently, as opposed to circuit switching, where a certain quality of service (QoS) is guaranteed during the connection. In 2G systems, GPRS provides data rates of 56–114 kbit/ second. 2G cellular technology combined with GPRS is sometimes described as 2.5G, that is, a technology between the second (2G) and third (3G) generations of mobile telephony. It provides moderate-speed data transfer, by using unused time division multiple access (TDMA) channels in, for example, the GSM system. GPRS is integrated into GSM Release 97 and newer releases." [General Packet Radio Service. Wikipedia]
This GPRS network diagram example was created using the ConceptDraw PRO diagramming and vector drawing software extended with the Telecommunication Network Diagrams solution from the Computer and Networks area of ConceptDraw Solution Park.
The vector stencils library "Picture Graphs" contains 35 templates of picture bar graphs for visual data comparison and time series.
Drag a template from the library to your document, set bars number, type category labels, select bars and enter your data.
Use these shapes to draw your pictorial bar charts in the ConceptDraw PRO diagramming and vector drawing software.
The vector stencils library "Picture Graphs" is included in the Picture Graphs solution from the Graphs and Charts area of ConceptDraw Solution Park.
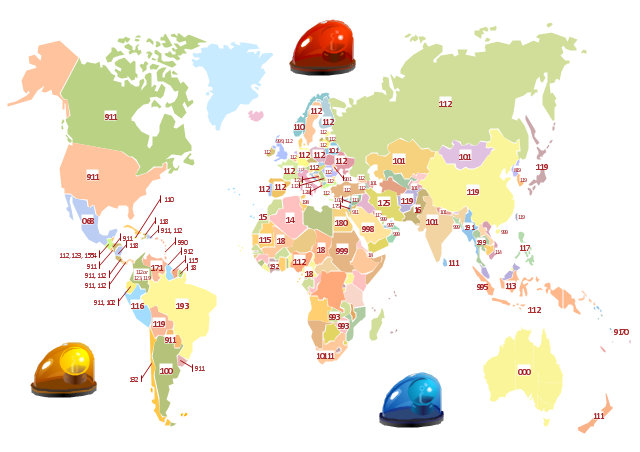
"In many countries the public telephone network has a single emergency telephone number (sometimes known as the universal emergency telephone number or occasionally the emergency services number) that allows a caller to contact local emergency services for assistance. The emergency number differs from country to country; it is typically a three-digit number so that it can be easily remembered and dialed quickly. Some countries have a different emergency number for each of the different emergency services; these often differ only by the last digit. In the European Union, Russia, Ukraine and Switzerland and others "112" was introduced as a common emergency call number during the 1990s, and as the GSM standard it is now a well known mobile telephone emergency number across the globe alongside the North American "911"." [Emergency telephone number. Wikipedia]
The thematic map example "Emergency number map" is contained in the Safety and Security solution from the Illustration area of ConceptDraw Solution Park.
The thematic map example "Emergency number map" is contained in the Safety and Security solution from the Illustration area of ConceptDraw Solution Park.
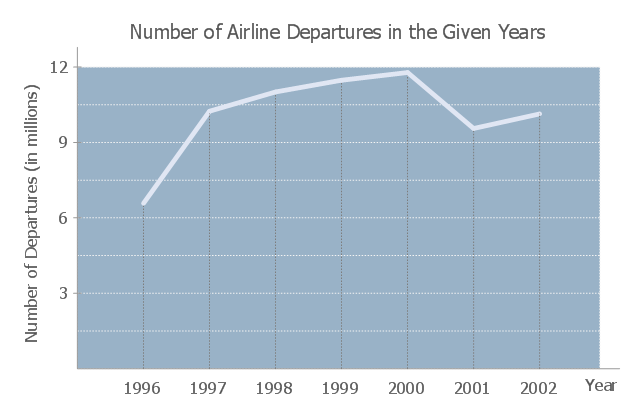
This line graph sample shows the number of airlines departures in 1996-2002. It was designed on the base of the Wikimedia Commons file: -6 time series.JPG
[commons.wikimedia.org/ wiki/ File:-6_ time_ series.JPG].
"The social science of economics makes extensive use graphs to better illustrate the economic principles and trends it is attempting to explain. Those graphs have specific qualities that are not often found (or are not often found in such combinations) in other sciences. ...
More generally, there is usually some mathematical model underlying any given economic graph. For instance, the commonly used supply-and-demand graph has its underpinnings in general price theory — a highly mathematical discipline." [Economic graph. Wikipedia]
The line chart example "Number of airlines departures in the given years" was designed using the ConceptDraw PRO diagramming and vector drawing software extended with the Line Graphs solution from the Graphs and Charts area of ConceptDraw Solution Park.
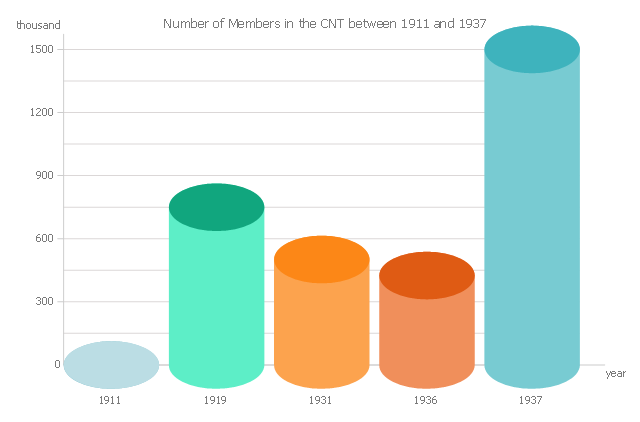
This 3D bar chart sample shows the number of members in the Confederación Nacional del Trabajo (CNT, National Confederation of Labour) between 1911 and 1937. It was designed on the base of the Commons Wikimedia file: Cnt afiliats.png.
[commons.wikimedia.org/ wiki/ File:Cnt_ afiliats.png]
This file is licensed under the Creative Commons Attribution-Share Alike 2.5 Generic license.
[creativecommons.org/ licenses/ by-sa/ 2.5/ deed.en]
"The Confederación Nacional del Trabajo (CNT; "National Confederation of Labour") is a Spanish confederation of anarcho-syndicalist labour unions affiliated with the International Workers Association (IWA; Spanish: AIT – Asociación Internacional de los Trabajadores). When working with the latter group it is also known as CNT-AIT. Historically, the CNT has also been affiliated with the Federación Anarquista Ibérica (Iberian Anarchist Federation – FAI). In this capacity it was referred to as the CNT-FAI. Throughout its history, it has played a major role in the Spanish labor movement.
Founded in 1910 in Barcelona from groups brought together by the trade union Solidaridad Obrera, it significantly expanded the role of anarchism in Spain, which can be traced to the creation of the Federación de Trabajadores de la Región Española, the successor organization to the Spanish chapter of the IWA.
Despite several decades when the organization was illegal in Spain, today the CNT continues to participate in the Spanish worker's movement, focusing its efforts on the principles of workers' self-management, federalism, and mutual aid." [Confederación Nacional del Trabajo. Wikipedia]
The 3D column chart example "Number of Members in the CNT between 1911 and 1937" was created using the ConceptDraw PRO diagramming and vector drawing software extended with the Bar Graphs solution from the Graphs and Charts area of ConceptDraw Solution Park.
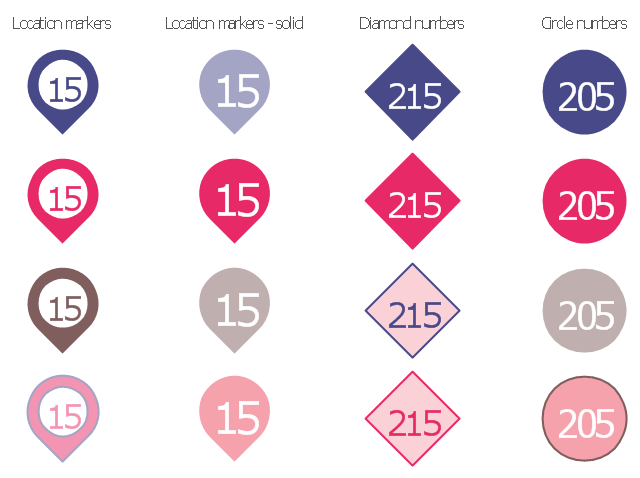
The vector stencils library "Numbers" contains 16 number blocks: location marker, diamond and circle shapes. Use it to add typography elements into your infographics.
The example "Design elements - Numbers" was created using the ConceptDraw PRO diagramming and vector drawing software extended with the Typography Infographics solition from the area "What is infographics" in ConceptDraw Solution Park.
The example "Design elements - Numbers" was created using the ConceptDraw PRO diagramming and vector drawing software extended with the Typography Infographics solition from the area "What is infographics" in ConceptDraw Solution Park.
"Directional control valves are one of the most fundamental parts in hydraulic machinery as well and pneumatic machinery. They allow fluid flow into different paths from one or more sources. They usually consist of a spool inside a cylinder which is mechanically or electrically controlled. The movement of the spool restricts or permits the flow, thus it controls the fluid flow. ...
While working with layouts of hydraulic machinery it is cumbersome to draw actual picture of every valve and other components.instead of pictures symbols are used for variety of components in the hydraulic system to highlight the functional aspects. symbol for directional control valve is made of number of square boxes adjacent to each other depending on the number of positions.connections to the valve are shown on these squares by capital letters.usually they are named only in their normal position and not repeated in other positions.actuation system of the valve is also designated in its symbol." [Directional control valve. Wikipedia]
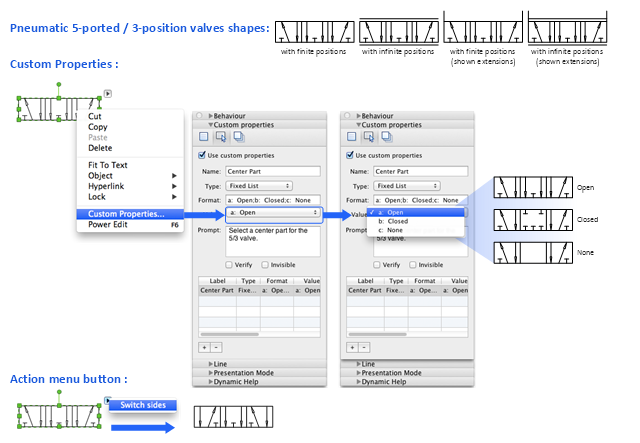
The Mac template "Pneumatic 5-ported 3-position valve" for the ConceptDraw PRO diagramming and vector drawing software is included in the Mechanical Engineering solution from the Engineering area of ConceptDraw Solution Park.
www.conceptdraw.com/ solution-park/ engineering-mechanical
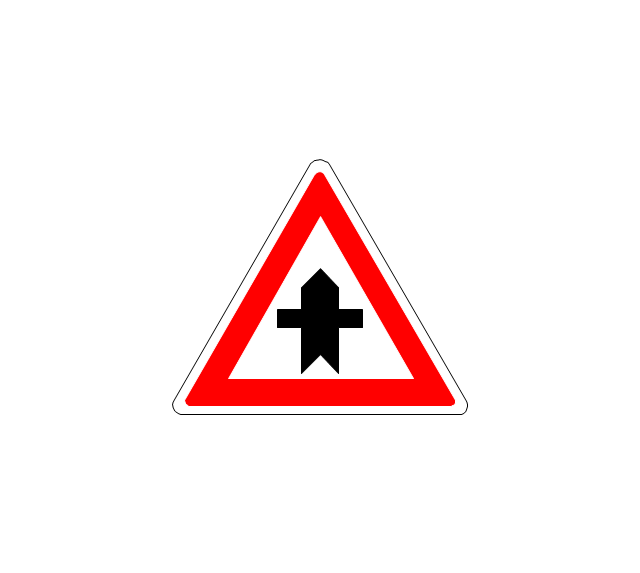
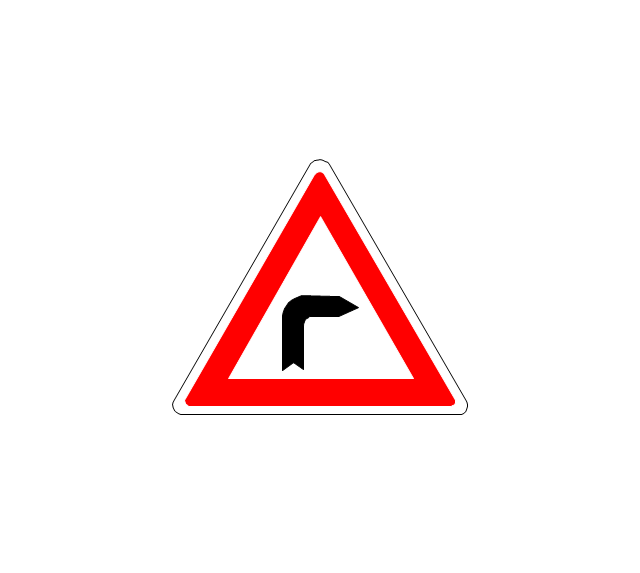
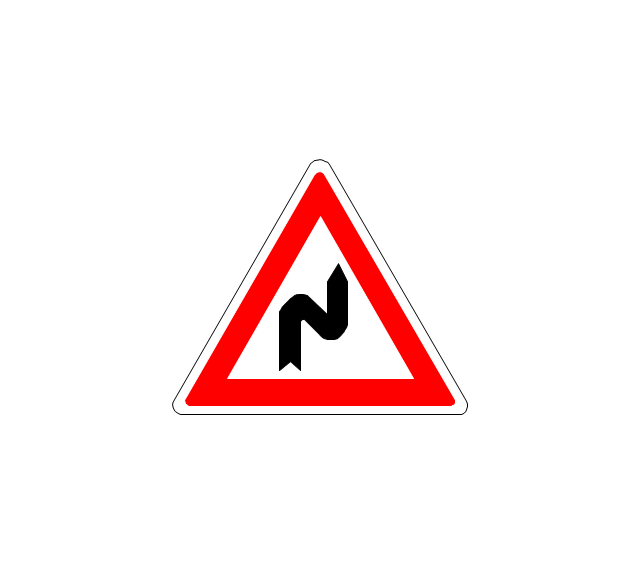
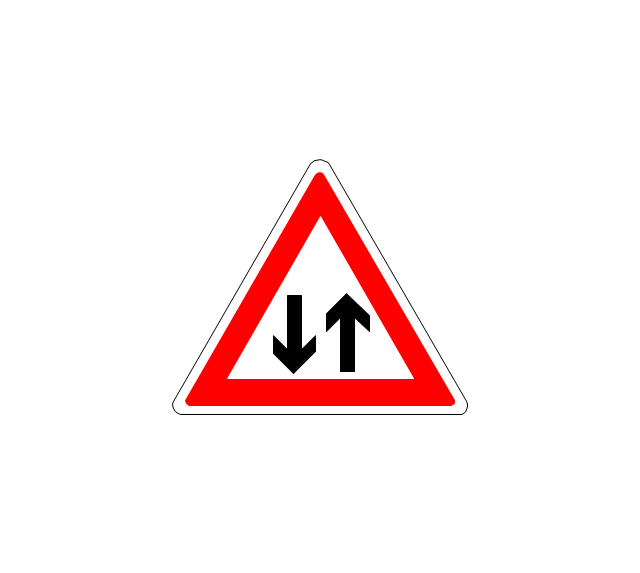
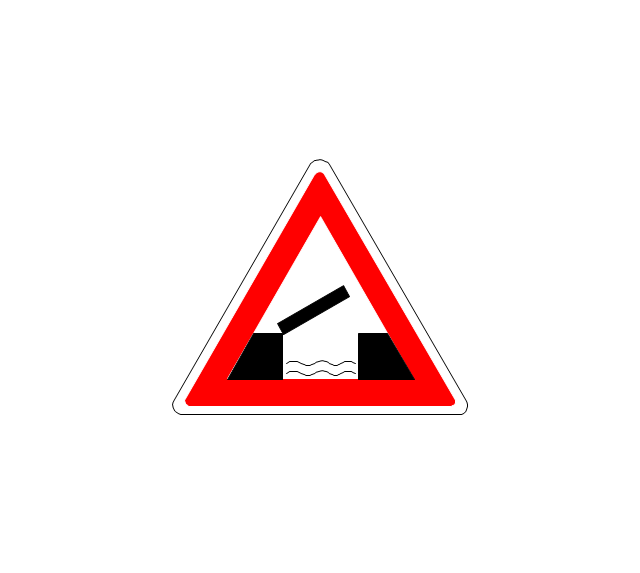
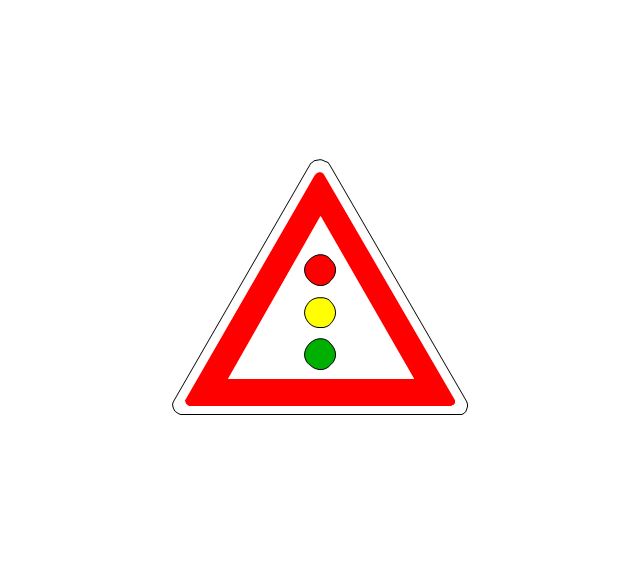
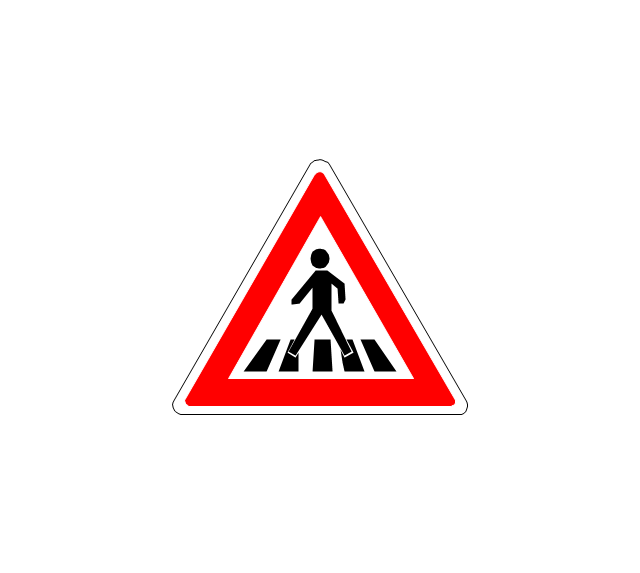
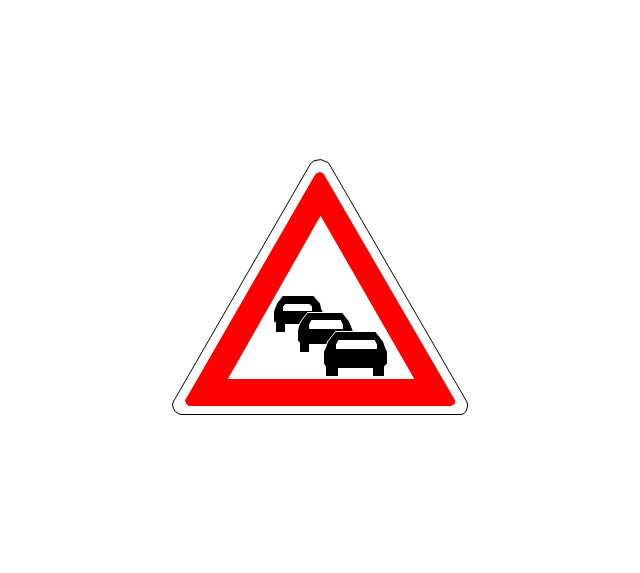
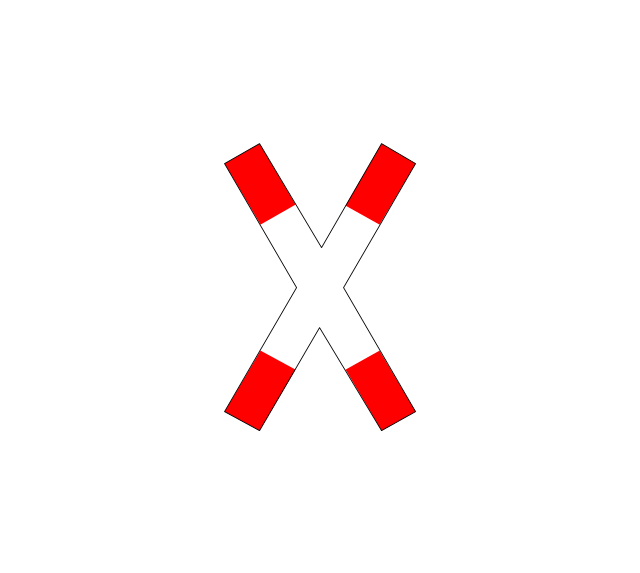
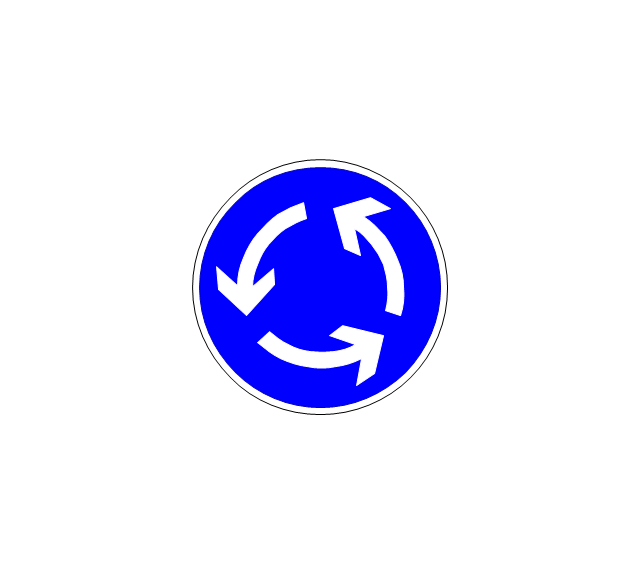
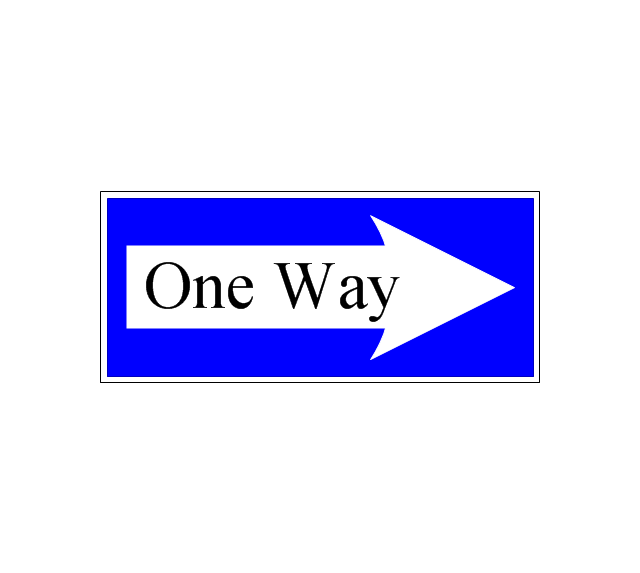
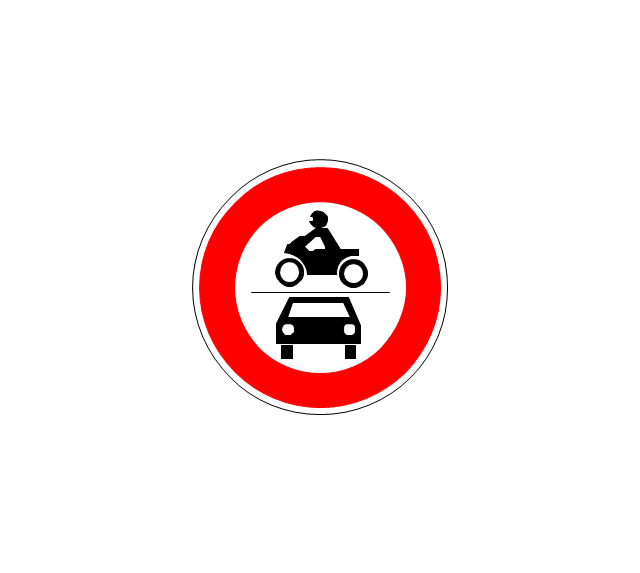
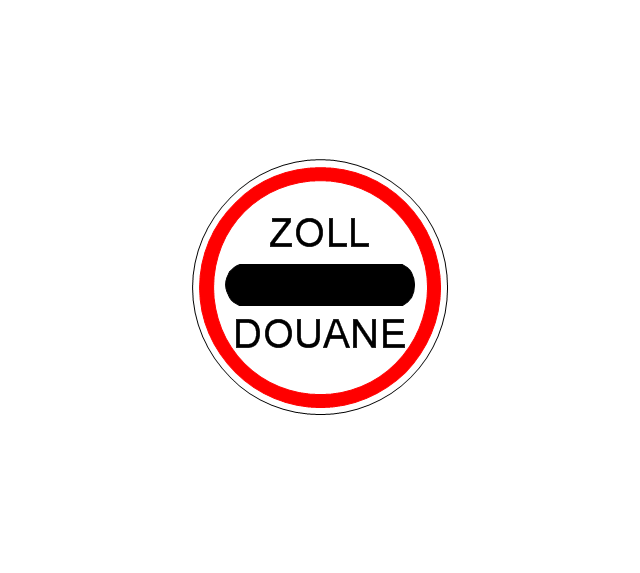
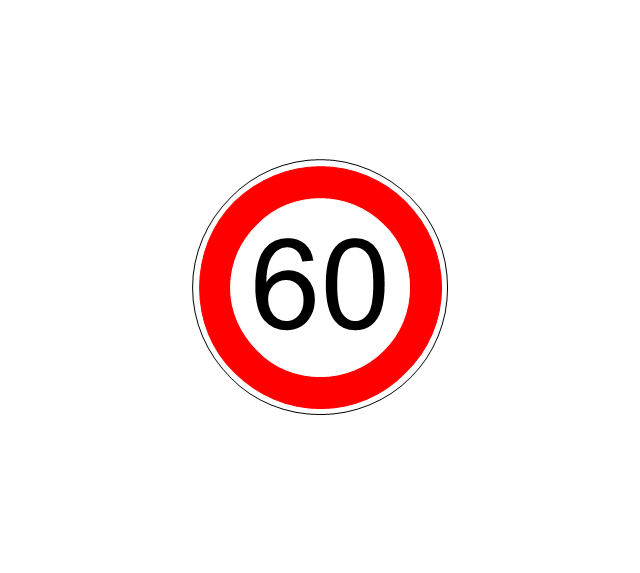
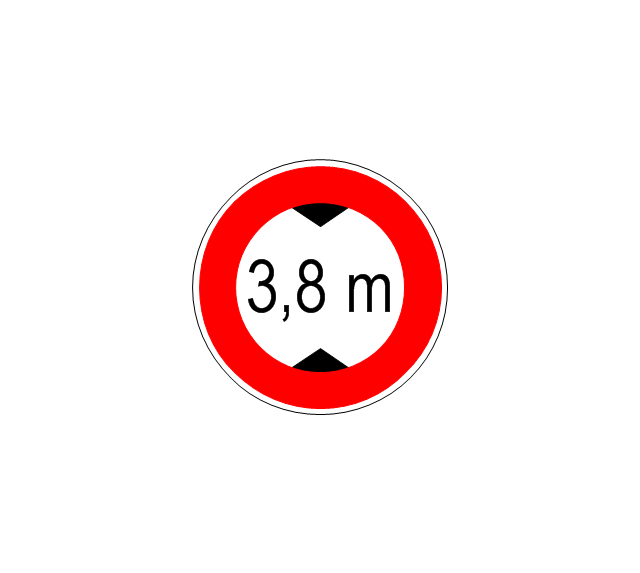
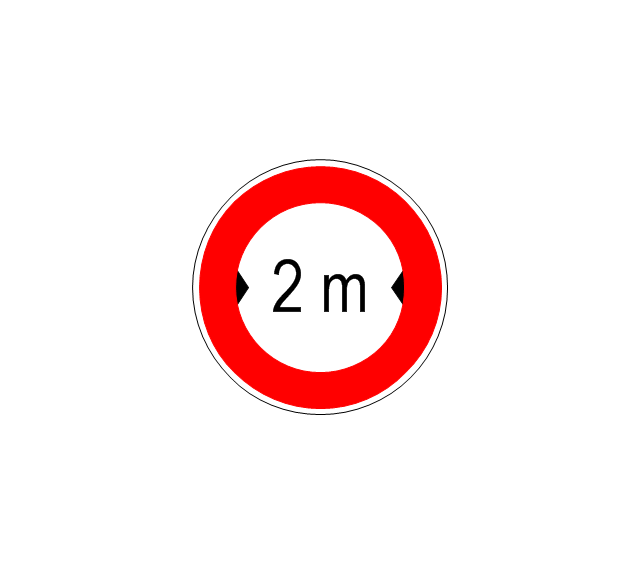
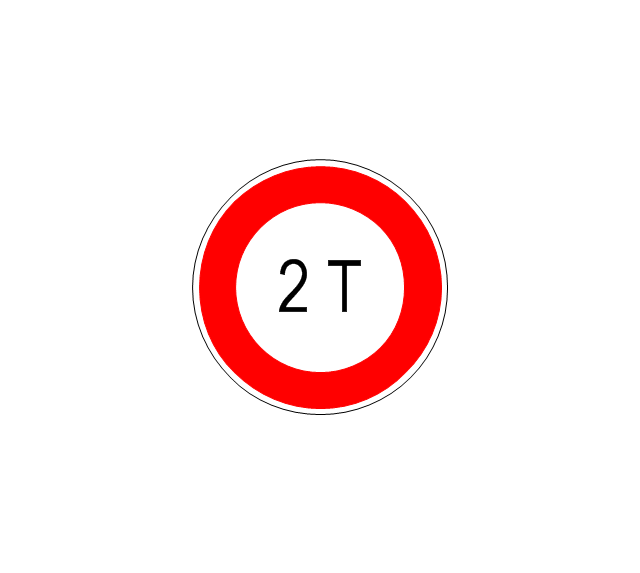
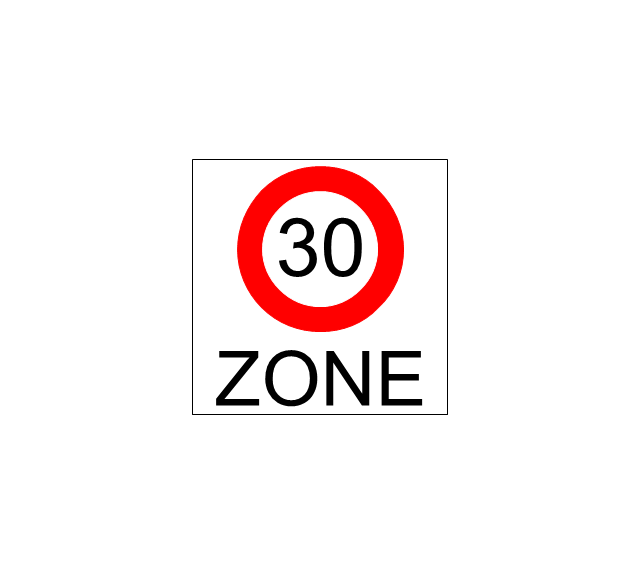
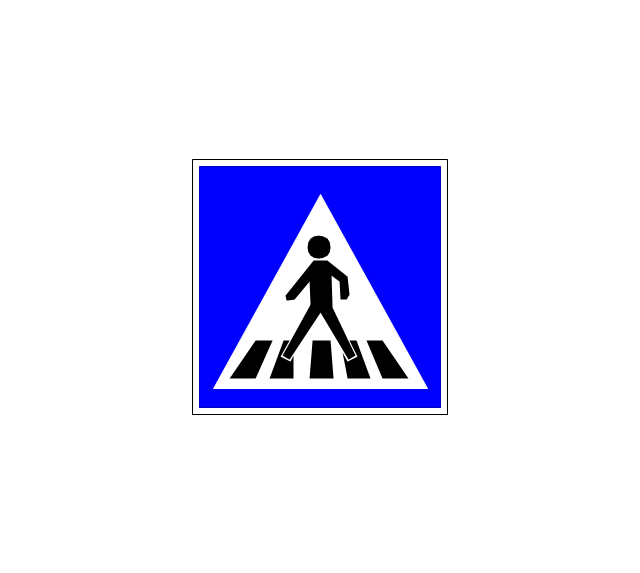
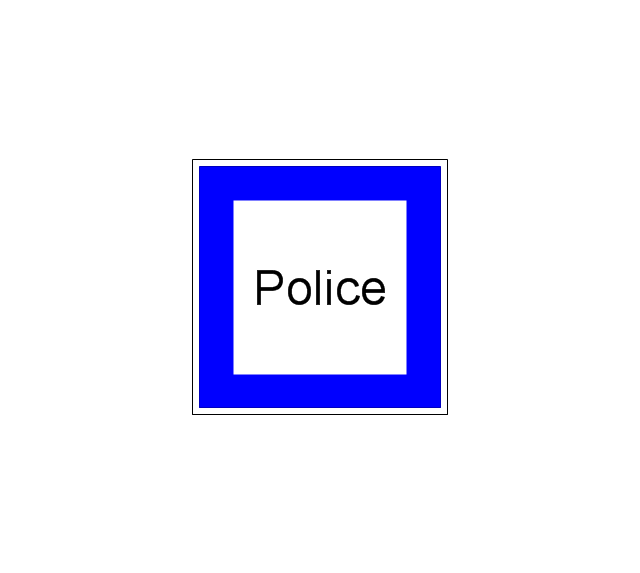
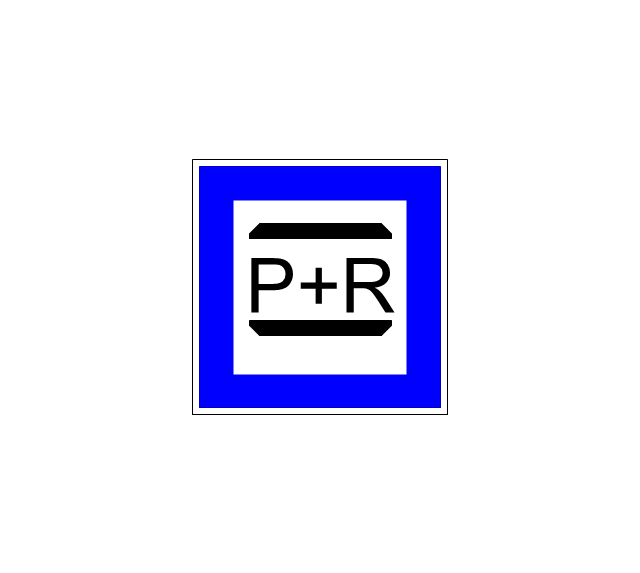
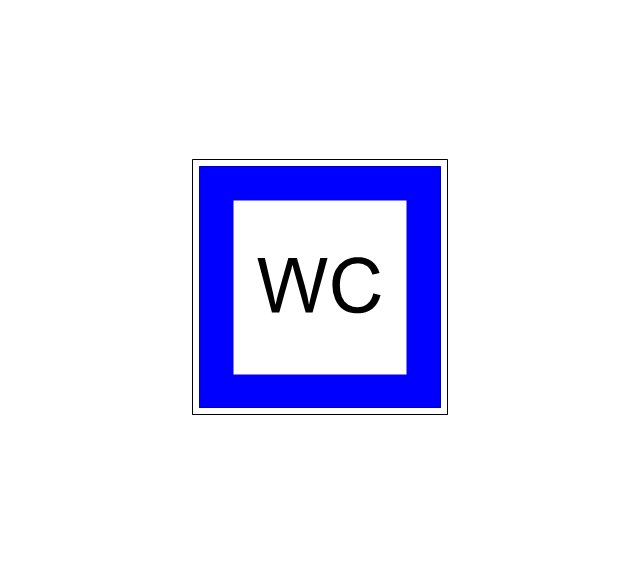
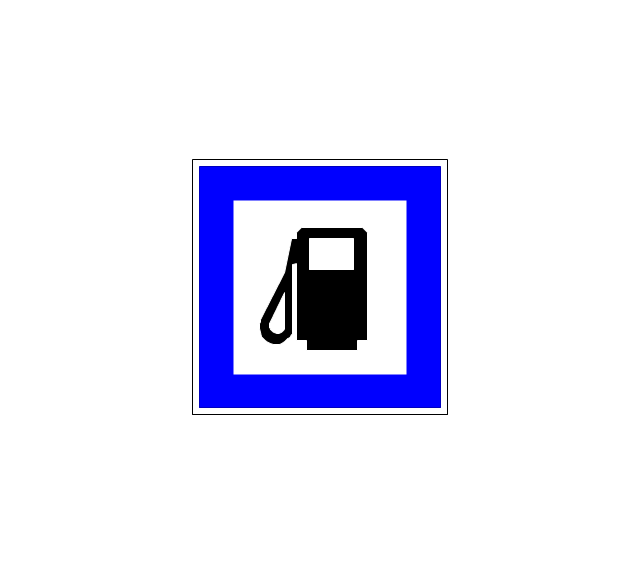
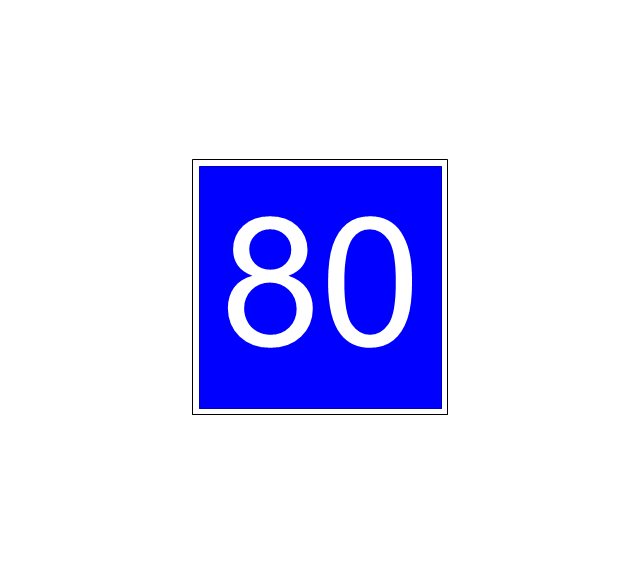
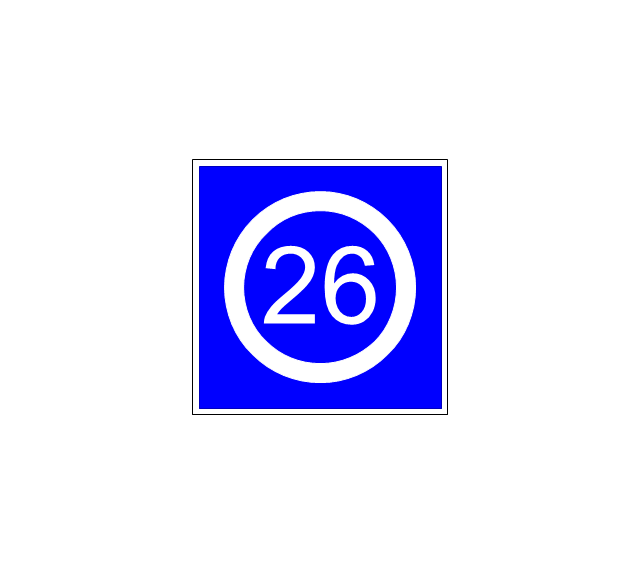
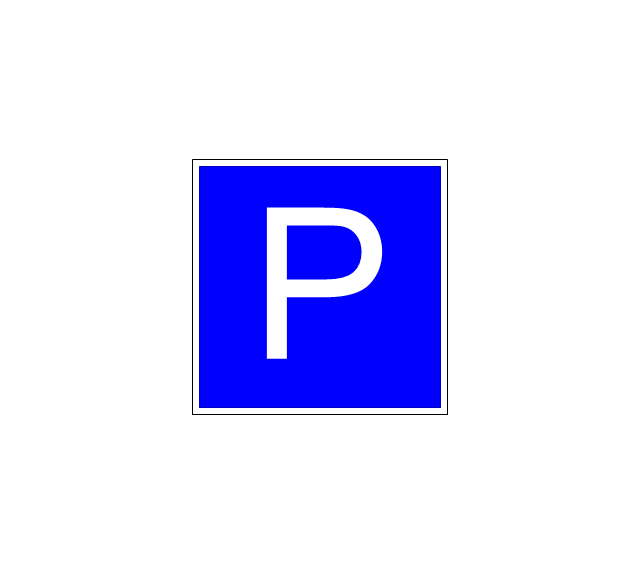
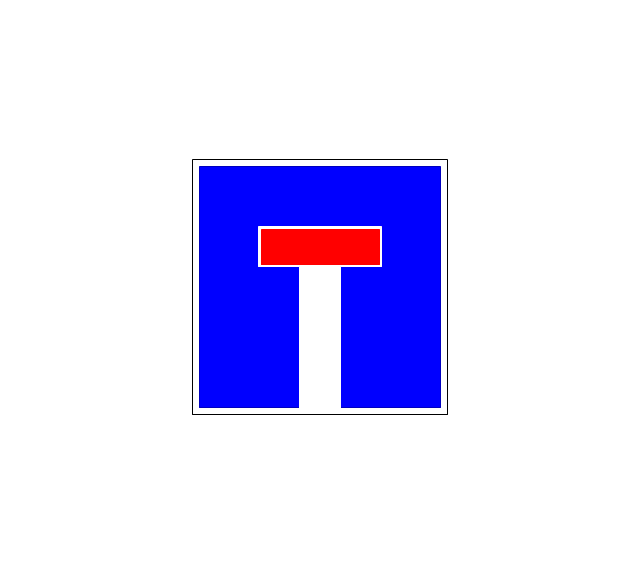
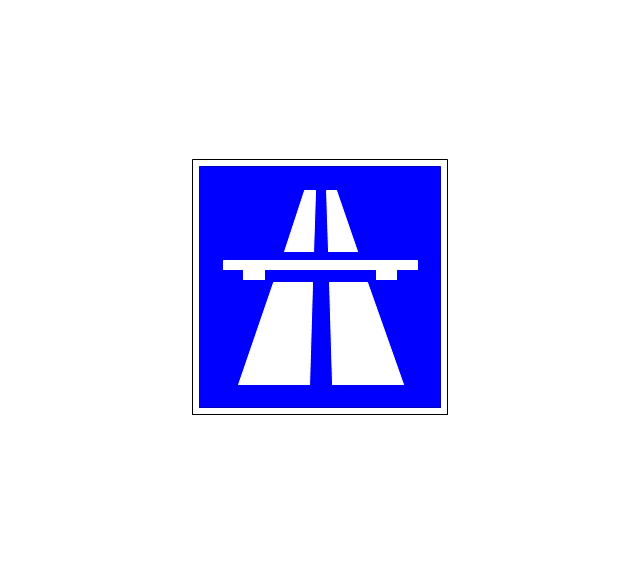
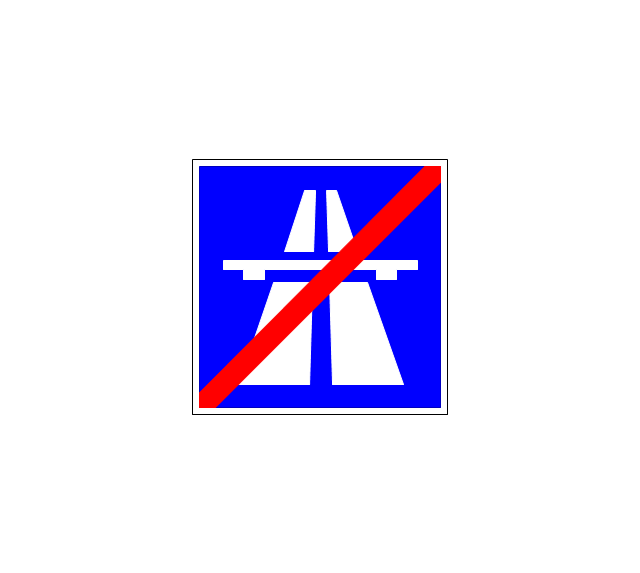
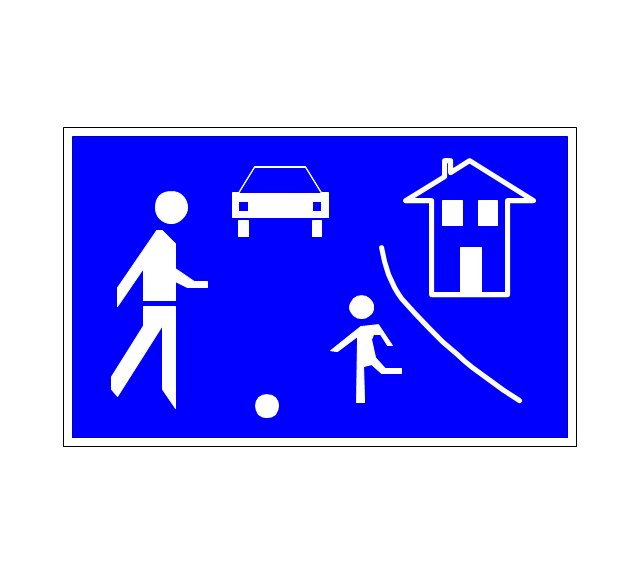
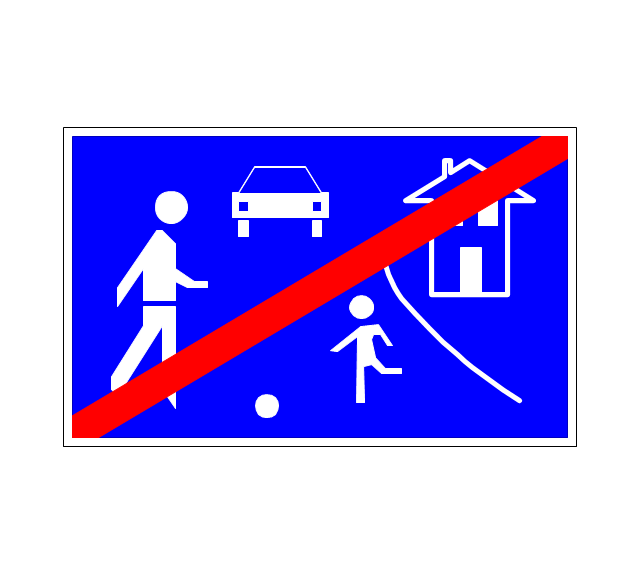
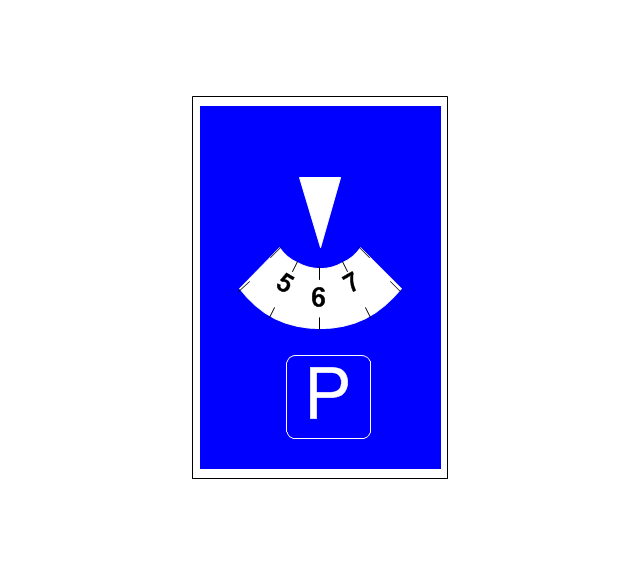
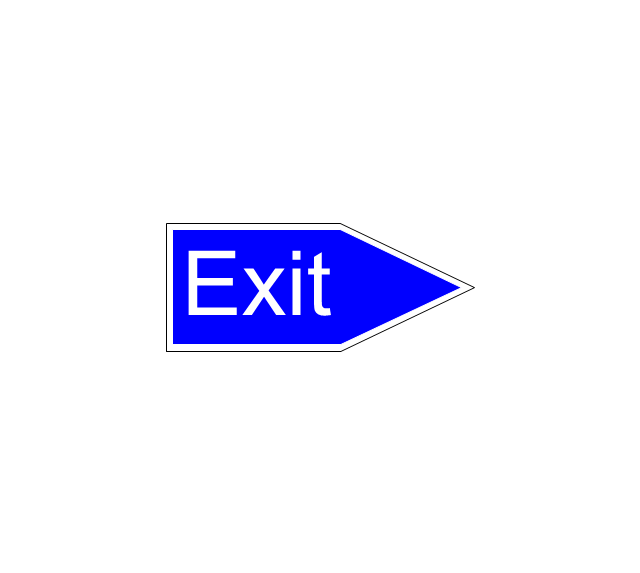
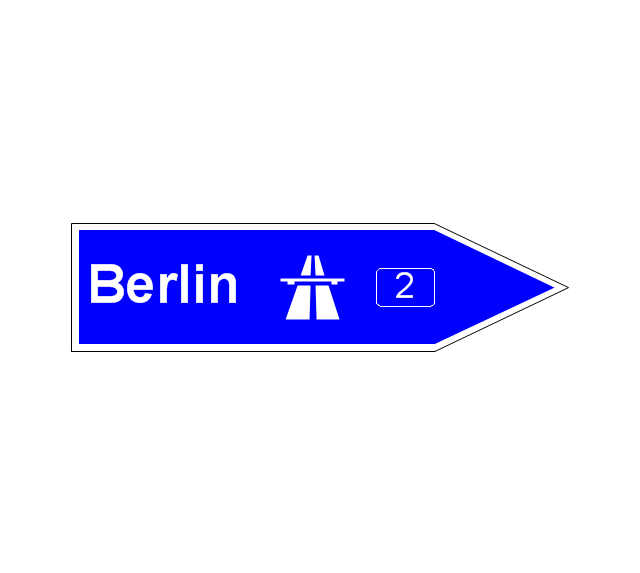
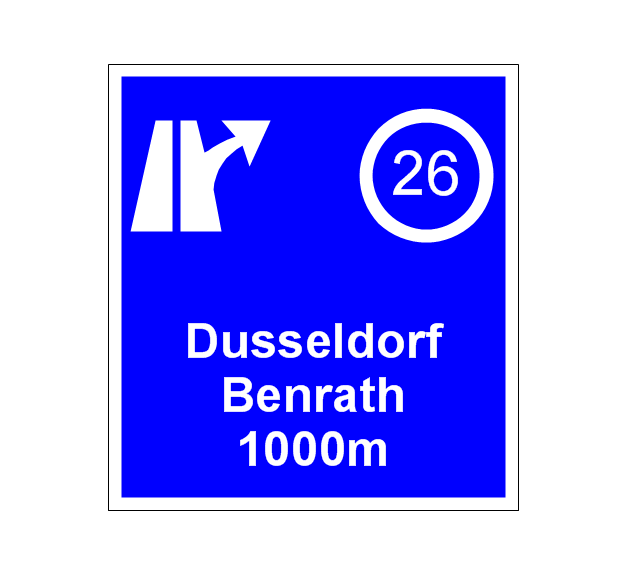
The vector stencils library "Road signs" contains 58 symbols of road signs for labeling the road and route maps, directional and transit maps, street and locator maps.
"Traffic signs or road signs are signs erected at the side of or above roads to give instructions or provide information to road users.
... many countries have adopted pictorial signs or otherwise simplified and standardized their signs to overcome language barriers, and enhance traffic safety. Such pictorial signs use symbols (often silhouettes) in place of words and are usually based on international protocols. Such signs were first developed in Europe, and have been adopted by most countries to varying degrees." [Traffic sign. Wikipedia]
The pictograms example "Road signs - Vector stencils library" was created using the ConceptDraw PRO diagramming and vector drawing software extended with the Directional Maps solution from the Maps area of ConceptDraw Solution Park.
www.conceptdraw.com/ solution-park/ maps-directional
"In mathematics, the Euclidean algorithm, or Euclid's algorithm, is a method for computing the greatest common divisor (GCD) of two (usually positive) integers, also known as the greatest common factor (GCF) or highest common factor (HCF). ...
The GCD of two positive integers is the largest integer that divides both of them without leaving a remainder (the GCD of two integers in general is defined in a more subtle way).
In its simplest form, Euclid's algorithm starts with a pair of positive integers, and forms a new pair that consists of the smaller number and the difference between the larger and smaller numbers. The process repeats until the numbers in the pair are equal. That number then is the greatest common divisor of the original pair of integers.
The main principle is that the GCD does not change if the smaller number is subtracted from the larger number. ... Since the larger of the two numbers is reduced, repeating this process gives successively smaller numbers, so this repetition will necessarily stop sooner or later - when the numbers are equal (if the process is attempted once more, one of the numbers will become 0)." [Euclidean algorithm. Wikipedia]
The flowchart example "Euclidean algorithm" was created using the ConceptDraw PRO diagramming and vector drawing software extended with the Mathematics solution from the Science and Education area of ConceptDraw Solution Park.
This interactive voice response (IVR) diagram sample illustrates how ENUM call forwarding can be achieved. It was designed on the base of the Wikimedia Commons file: Call Forwarding with ENUM.jpg. [commons.wikimedia.org/ wiki/ File:Call_ Forwarding_ with_ ENUM.jpg]
"Telephone number mapping is a system of unifying the international telephone number system of the public switched telephone network with the Internet addressing and identification name spaces. Internationally, telephone numbers are systematically organized by the E.164 standard, while the Internet uses the Domain Name System (DNS) for linking domain names to IP addresses and other resource information. Telephone number mapping systems provide facilities to determine applicable Internet communications servers responsible for servicing a given telephone number using DNS queries.
The most prominent facility for telephone number mapping is the E.164 Number Mapping (ENUM) standard. It uses special DNS record types to translate a telephone number into a Uniform Resource Identifier (URI) or IP address that can be used in Internet communications." [Telephone number mapping. Wikipedia]
The IVR diagram example "Call Forwarding with ENUM" was designed using ConceptDraw PRO diagramming and vector drawing software extended with the Interactive Voice Response Diagrams solution from the Computer and Networks area of ConceptDraw Solution Park.
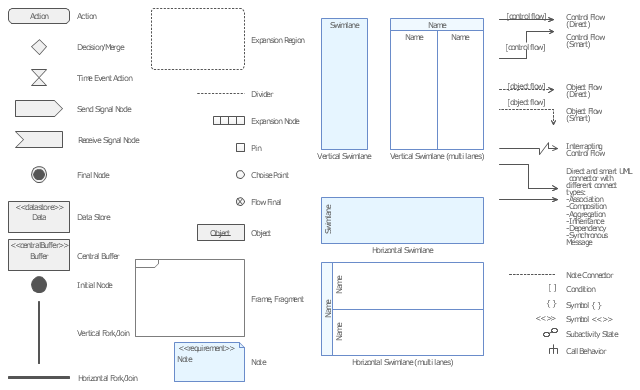
The vector stencils library "UML activity diagrams" contains 37 symbols for the ConceptDraw PRO diagramming and vector drawing software.
"Activity diagrams are constructed from a limited number of shapes, connected with arrows. The most important shape types:
(1) rounded rectangles represent actions;
(2) diamonds represent decisions;
(3) bars represent the start (split) or end (join) of concurrent activities;
(4) a black circle represents the start (initial state) of the workflow;
(5) an encircled black circle represents the end (final state).
Arrows run from the start towards the end and represent the order in which activities happen.
Hence they can be regarded as a form of flowchart. Typical flowchart techniques lack constructs for expressing concurrency. However, the join and split symbols in activity diagrams only resolve this for simple cases; the meaning of the model is not clear when they are arbitrarily combined with decisions or loops." [Activity diagram. Wikipedia]
The example "Design elements - UML activity diagrams" is included in the Rapid UML solution from the Software Development area of ConceptDraw Solution Park.
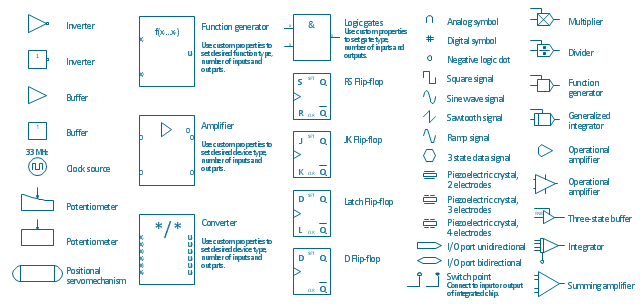
The vector stencils library "Analog and digital logic" contains 40 element symbols of logic (threshold) gates, bistable current switches, current controllers, regulators, electrical generators, and amplifiers.
Use it for drawing the digital and analog functions in electronic circuit diagrams and electrical schematics.
"Analogue electronics (or analog in American English) are electronic systems with a continuously variable signal, in contrast to digital electronics where signals usually take only two different levels. The term "analogue" describes the proportional relationship between a signal and a voltage or current that represents the signal." [Analogue electronics. Wikipedia]
"Digital electronics, or digital (electronic) circuits, represent signals by discrete bands of analog levels, rather than by a continuous range. All levels within a band represent the same signal state. Relatively small changes to the analog signal levels due to manufacturing tolerance, signal attenuation or parasitic noise do not leave the discrete envelope, and as a result are ignored by signal state sensing circuitry.
In most cases the number of these states is two, and they are represented by two voltage bands: one near a reference value (typically termed as "ground" or zero volts) and a value near the supply voltage, corresponding to the "false" ("0") and "true" ("1") values of the Boolean domain respectively.
Digital techniques are useful because it is easier to get an electronic device to switch into one of a number of known states than to accurately reproduce a continuous range of values.
Digital electronic circuits are usually made from large assemblies of logic gates, simple electronic representations of Boolean logic functions." [Digital electronics. Wikipedia]
The example "Design elements - Analog and digital logic" was drawn using the ConceptDraw PRO diagramming and vector drawing software extended with the Electrical Engineering solution from the Engineering area of ConceptDraw Solution Park.
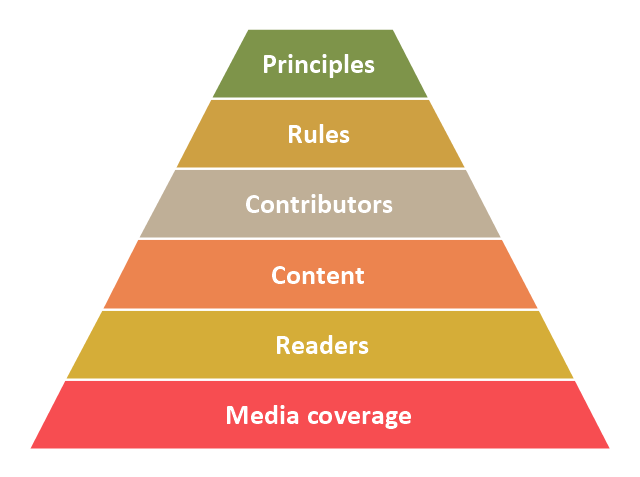
"Wikipedia's success metrics supersede each other in the following order:
1. Media coverage is the most basic metric for success – it provides notability and a public image for the project.
2. The number of readers supersedes media coverage – irrespective of the media, the number of actual readers matters more (high media coverage and low number of readers actually means the project is not successful; on the contrary, low media coverage and a high number of readers means the project is successful).
3. The quality and quantity of content is more important than the current number of readers – good content creates readership.
4. Content cannot be created without contributors, therefore the number of contributors and their ability to create meaningful content is more important than the current content.
5. Good contributors leave the project if they're not treated in a fair manner, and potential contributors are not interested in joining if they feel the project is misguided – therefore applying rules in a fair manner is more important than retaining contributors at any cost.
6. Misguided rules are guaranteed to ruin any enterprise, therefore all rules must necessarily be the result of applying healthy principles – the logic goes both ways, applying existing rules in fringe situations against the principles is disastrous." [Wikipedia's hierarchy of needs. Wikipedia]
This Wikipedia's hierarchy of priorities pyramid diagram was redesigned using the ConceptDraw PRO diagramming and vector drawing software from Wikimedia Commons file Wikipedia priority pyramid.png. [commons.wikimedia.org/ wiki/ File:Wikipedia_ priority_ pyramid.png]
This pyramid chart example is included in the Pyramid Diagrams solution from the Marketing area of ConceptDraw Solution Park.
This IVR diagram sample illustrates how ENUM works by giving an example: Subscriber A sets out to call Subscriber B:
1. The User Agent of an ENUM-enabled subscriber terminal device, or a PBX, or a Gateway, translates the request for the number +34 98 765 4321 in accordance with the rule described in RFC 3761 into the ENUM domain 1.2.3.4.5.6.7.8.9.4.3.e164.arpa.
2. A request is sent to the Domain Name System (DNS) asking it to look up the ENUM domain 1.2.3.4.5.6.7.8.9.4.3.e164.arpa.
3. The query returns a result in the form of so called Naming Authority Pointer Resource NAPTR records, as per RFC 3403. In the example above, the response is an address that can be reached in the Internet using the VoIP protocol, SIP per RFC 3261.
4. The terminal application now sets up a communication link, and the call is routed via the Internet.
This IVR diagram sample was designed on the base of the Wikimedia Commons file: Ejemplo ENUM.jpg. [commons.wikimedia.org/ wiki/ File:Ejemplo_ ENUM.jpg]
"Being able to dial telephone numbers the way customers have come to expect is considered crucial for the convergence of classic telephone service (PSTN) and Internet telephony (Voice over IP, VoIP), and for the development of new IP multimedia services. The problem of a single universal personal identifier for multiple communication services can be solved with different approaches. One simple approach is the Electronic Number Mapping System (ENUM), developed by the IETF, using existing E.164 telephone numbers, protocols and infrastructure to indirectly access different services available under a single personal identifier. ENUM also permits connecting the IP world to the telephone system in a seamless manner." [Telephone number mapping. Wikipedia]
The IVR diagram example "Example ENUM" was designed using ConceptDraw PRO diagramming and vector drawing software extended with the Interactive Voice Response Diagrams solution from the Computer and Networks area of ConceptDraw Solution Park.
This financila dashboard example was drawn on the base of the Enterprise dashboard from the Mecklenburg County Government website.
[charmeck.org/ mecklenburg/ county/ CountyManagersOffice/ OMB/ dashboards/ Pages/ Enterprise.aspx]
"In management information systems, a dashboard is "an easy to read, often single page, real-time user interface, showing a graphical presentation of the current status (snapshot) and historical trends of an organization’s key performance indicators to enable instantaneous and informed decisions to be made at a glance."
For example, a manufacturing dashboard may show key performance indicators related to productivity such as number of parts manufactured, or number of failed quality inspections per hour. Similarly, a human resources dashboard may show KPIs related to staff recruitment, retention and composition, for example number of open positions, or average days or cost per recruitment.
Types of dashboards.
Dashboard of Sustainability screen shot illustrating example dashboard layout.
Digital dashboards may be laid out to track the flows inherent in the business processes that they monitor. Graphically, users may see the high-level processes and then drill down into low level data. This level of detail is often buried deep within the corporate enterprise and otherwise unavailable to the senior executives.
Three main types of digital dashboard dominate the market today: stand alone software applications, web-browser based applications, and desktop applications also known as desktop widgets. The last are driven by a widget engine.
Specialized dashboards may track all corporate functions. Examples include human resources, recruiting, sales, operations, security, information technology, project management, customer relationship management and many more departmental dashboards.
Digital dashboard projects involve business units as the driver and the information technology department as the enabler. The success of digital dashboard projects often depends on the metrics that were chosen for monitoring. Key performance indicators, balanced scorecards, and sales performance figures are some of the content appropriate on business dashboards." [Dashboard (management information systems). Wikipedia]
The example "Enterprise dashboard" was created using the ConceptDraw PRO diagramming and vector drawing software extended with the Composition Dashboard solution from the area "What is a Dashboard" of ConceptDraw Solution Park.
- Basketball Court Dimensions | Picture Graphs Solution ...
- Pict Topology Wireless Lan Ad Hoc
- Pict Typography
- How to Create a Picture Graph in ConceptDraw PRO | Network ...
- Use Appropriate Examples Pictures And Graphs
- Pictures of Graphs | Pictures of Vegetables | Pictures of Food | Pict ...
- Pictures of Vegetables | Basketball Court Dimensions | Export from ...
- Picture Graphs | Infographic Maker | Chart Templates | Population ...
- Knowledge Pictures Png
- Fifa World Cup Pict
- Png Pict
- Pict Videos App Icons Vector Stencils Library 1 Png
- Pict Microsoft Apps
- Bar Chart Template for Word | Example of DFD for Online Store ...
- Underground Pict Vector
- Picture Graph
- Local area network (LAN). Computer and Network Examples ...
- Cisco Network Photo Sample Power Point
- Draw A Football Field And Number The Player Wings
- How to Create a Mechanical Diagram | Technical drawing - Machine ...























-road-signs---vector-stencils-library.png--diagram-flowchart-example.png)
-road-signs---vector-stencils-library.png--diagram-flowchart-example.png)


