Chart Templates
Easy charting software comes with beautiful chart templates and examples. This makes it easy to create professional charts without prior experience.The vector stencils library "Transport map" contains 96 pictograms for drawing transport maps.
Use it in your spatial infographics for visual representation of transport schemes and plans as metro maps in the ConceptDraw PRO diagramming and vector drawing software extended with the Spatial Infographics solution from the area "What is Infographics" of ConceptDraw Solution Park.
Use it in your spatial infographics for visual representation of transport schemes and plans as metro maps in the ConceptDraw PRO diagramming and vector drawing software extended with the Spatial Infographics solution from the area "What is Infographics" of ConceptDraw Solution Park.
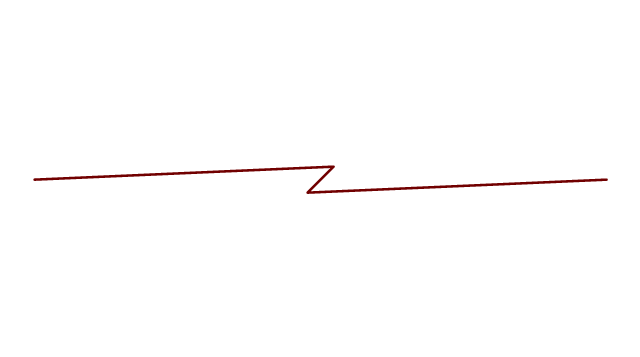
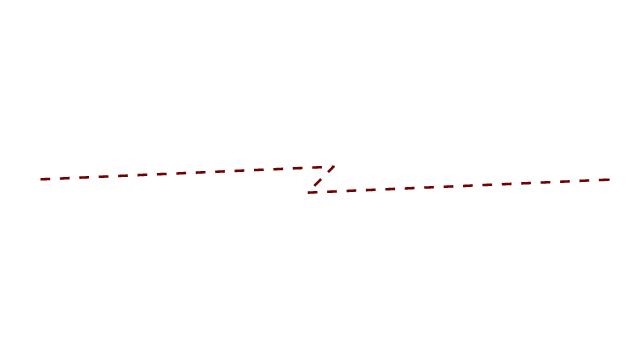
The vector stencils library "Cisco media" contains 10 symbols of Cisco media elements: token ring, FDDI ring, serial, circuit-switched and Ethernet lines.
"Token ring local area network (LAN) technology is a protocol which resides at the data link layer (DLL) of the OSI model. It used a special three-byte frame called a token that travels around the ring. Token-possession grants the possessor permission to transmit on the medium. Token ring frames travel completely around the loop.
Initially used only in IBM computers, it was eventually standardized with protocol IEEE 802.5." [Token ring. Wikipedia]
"Fiber Distributed Data Interface (FDDI) is a standard for data transmission in a local area network. It uses optical fiber as its standard underlying physical medium, although it was also later specified to use copper cable, in which case it may be called CDDI (Copper Distributed Data Interface), standardized as TP-PMD (Twisted-Pair Physical Medium-Dependent), also referred to as TP-DDI (Twisted-Pair Distributed Data Interface)." [Fiber Distributed Data Interface. Wikipedia]
The symbols example "Cisco media - Vector stencils library" was created using the ConceptDraw PRO diagramming and vector drawing software extended with the Cisco Network Diagrams solution from the Computer and Networks area of ConceptDraw Solution Park.
www.conceptdraw.com/ solution-park/ computer-networks-cisco
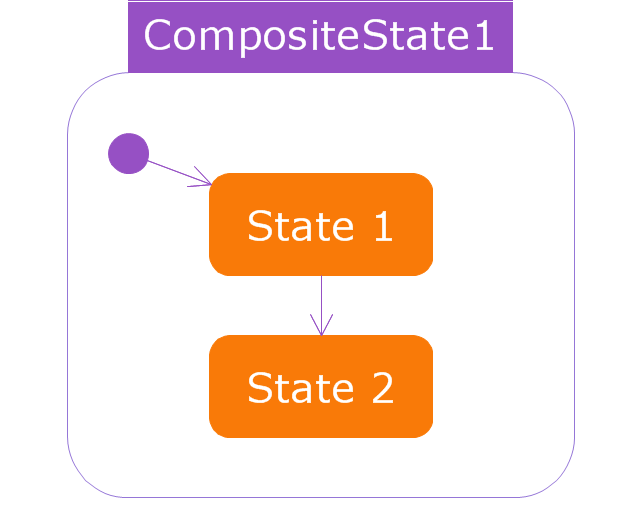
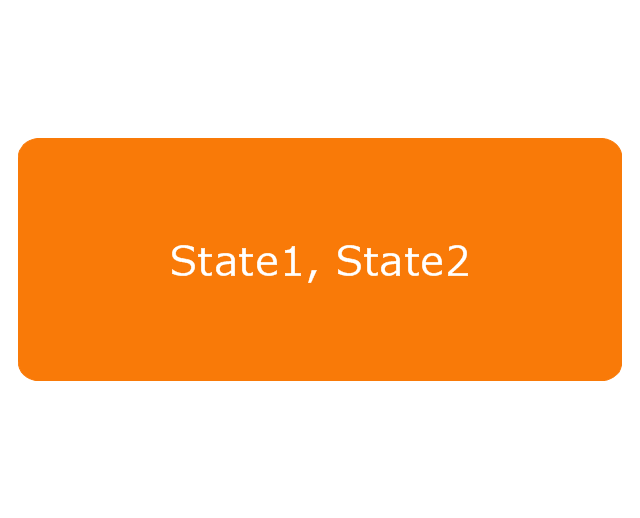
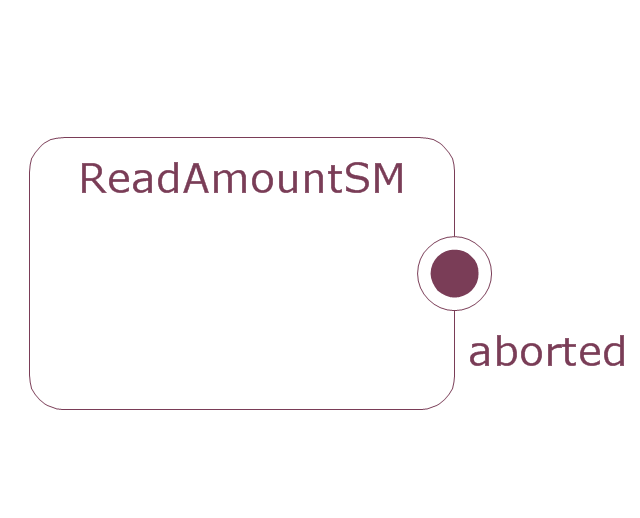
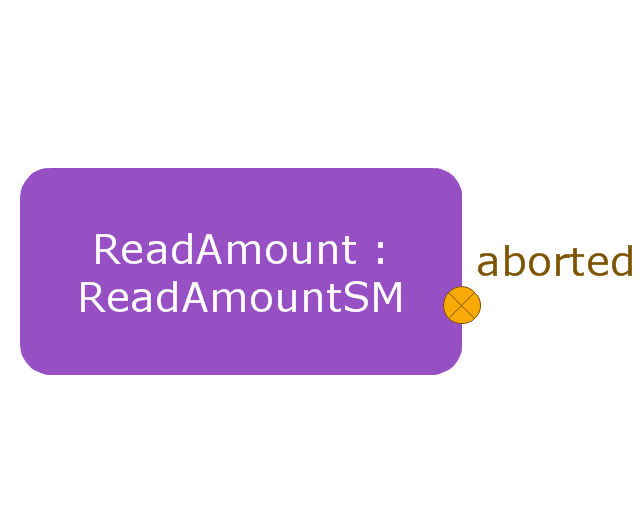
This vector stencils library contains 47 SysML symbols.
Use it to design your state machine diagrams using ConceptDraw PRO diagramming and vector drawing software.
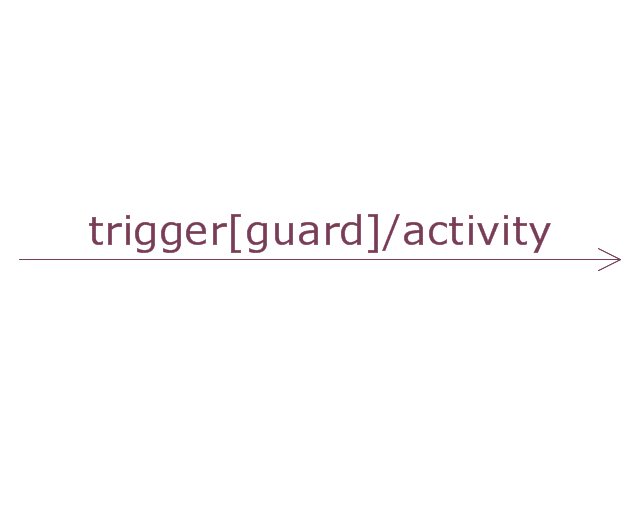
"The state diagram in the Unified Modeling Language is essentially a Harel statechart with standardized notation, which can describe many systems, from computer programs to business processes. In UML 2 the name has been changed to State Machine Diagram. The following are the basic notational elements that can be used to make up a diagram:
- Filled circle, representing to the initial state
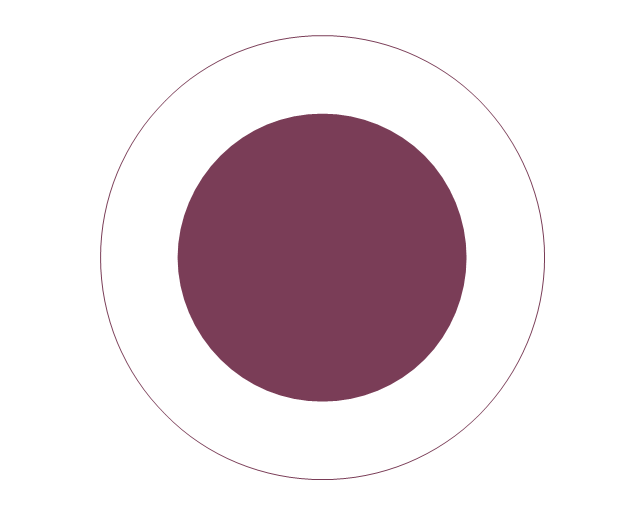
- Hollow circle containing a smaller filled circle, indicating the final state (if any)
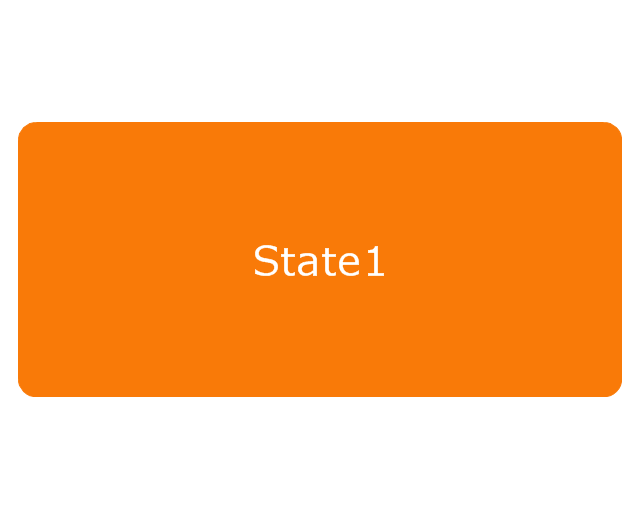
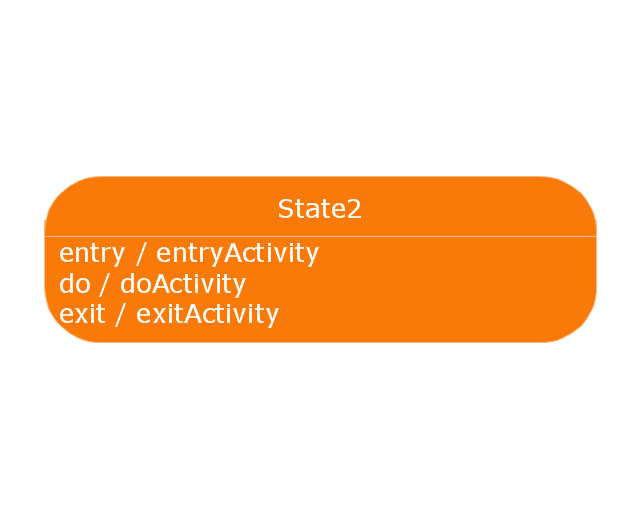
- Rounded rectangle, denoting a state. Top of the rectangle contains a name of the state. Can contain a horizontal line in the middle, below which the activities that are done in that state are indicated
- Arrow, denoting transition. The name of the event (if any) causing this transition labels the arrow body. A guard expression may be added before a "/ " and enclosed in square-brackets ( eventName[guardExpression] ), denoting that this expression must be true for the transition to take place. If an action is performed during this transition, it is added to the label following a "/ " ( eventName[guardExpression]/ action ).
- Thick horizontal line with either x>1 lines entering and 1 line leaving or 1 line entering and x>1 lines leaving. These denote join/ fork, respectively." [State diagram (UML). Wikipedia]
The vector stencils library "State machine diagram" is included in the SysML solution from the Software Development area of ConceptDraw Solution Park.
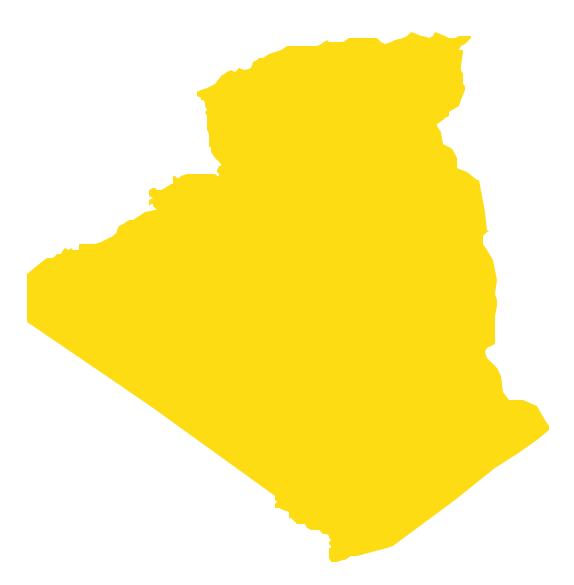
Geo Map - Africa - Algeria
Algeria, officially The People's Democratic Republic of Algeria, is a country in the Maghreb region of North Africa on the Mediterranean coast. The vector stencils library Algeria contains contours for ConceptDraw DIAGRAM diagramming and vector drawing software. This library is contained in the Continent Maps solution from Maps area of ConceptDraw Solution Park.This vector stencils library contains 32 SysML symbols.
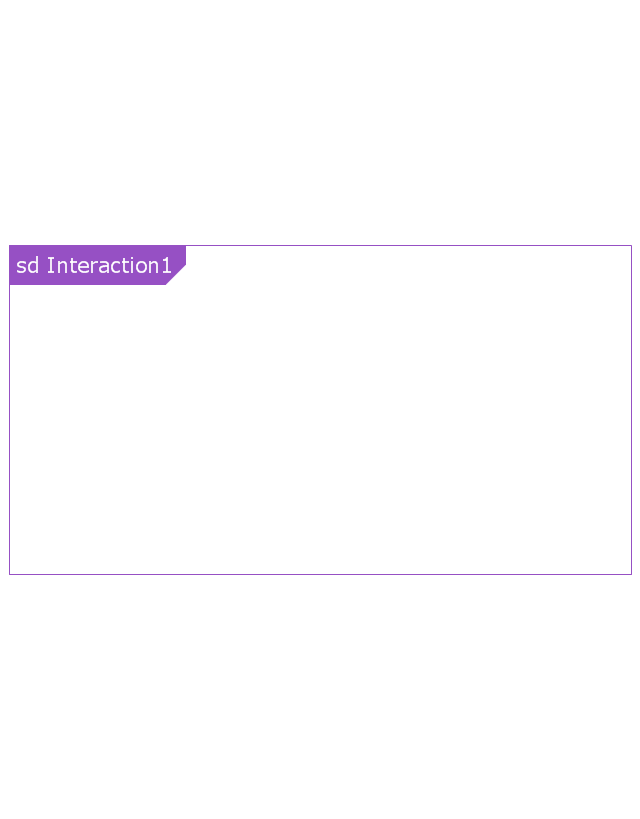
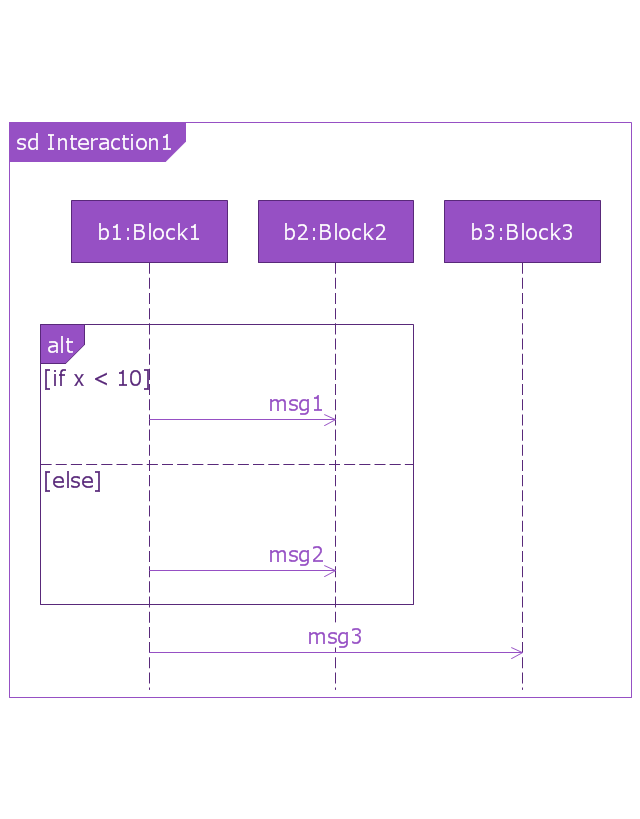
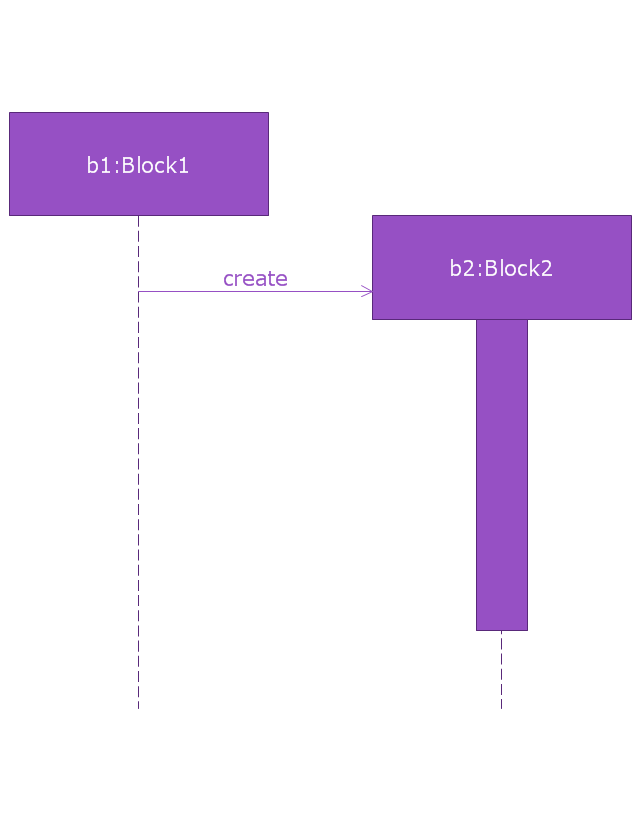
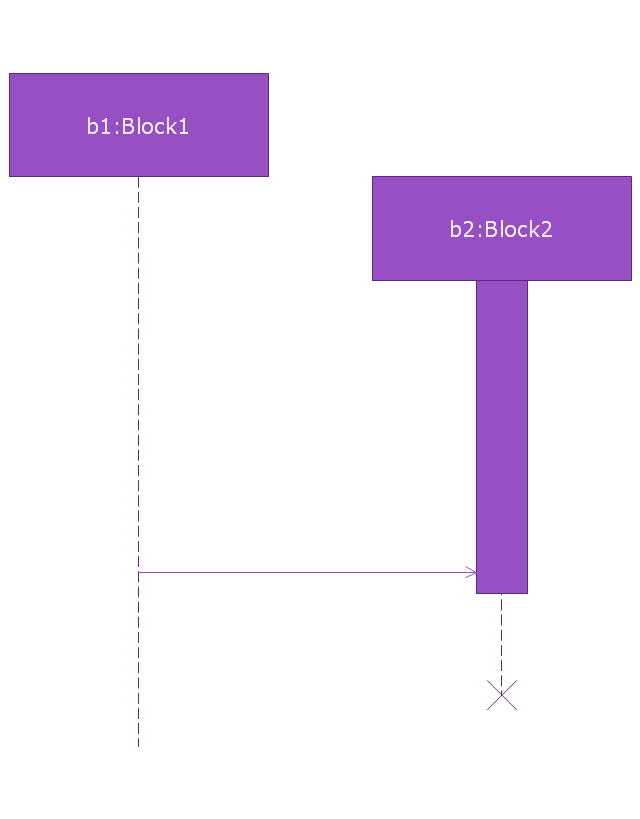
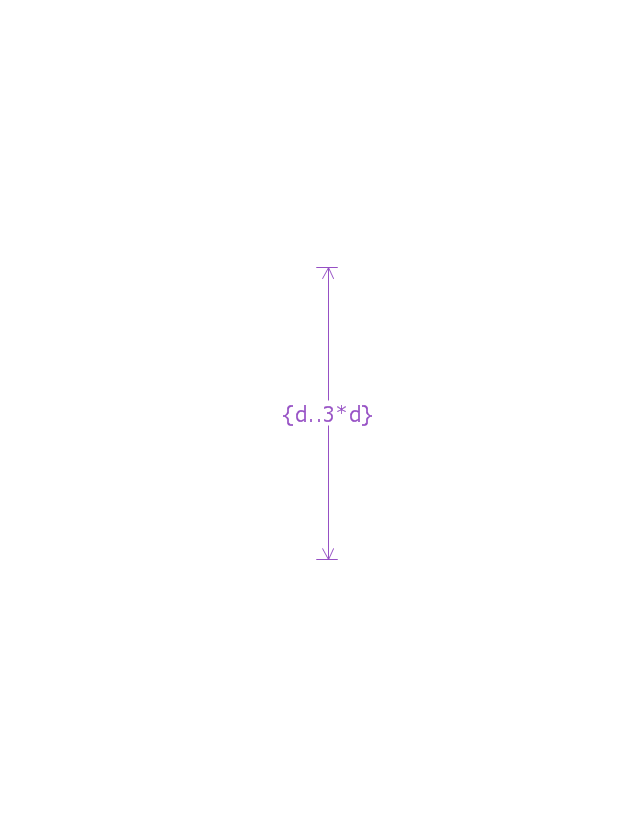
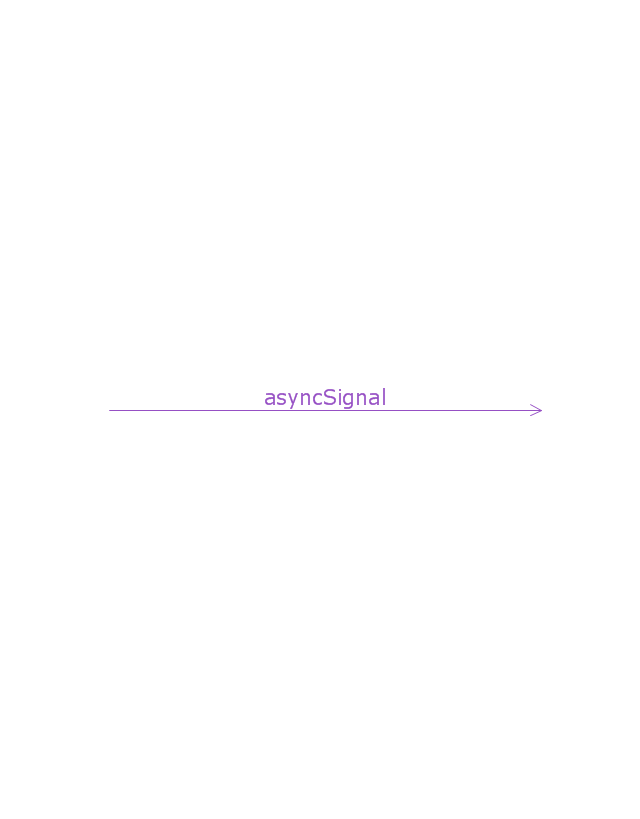
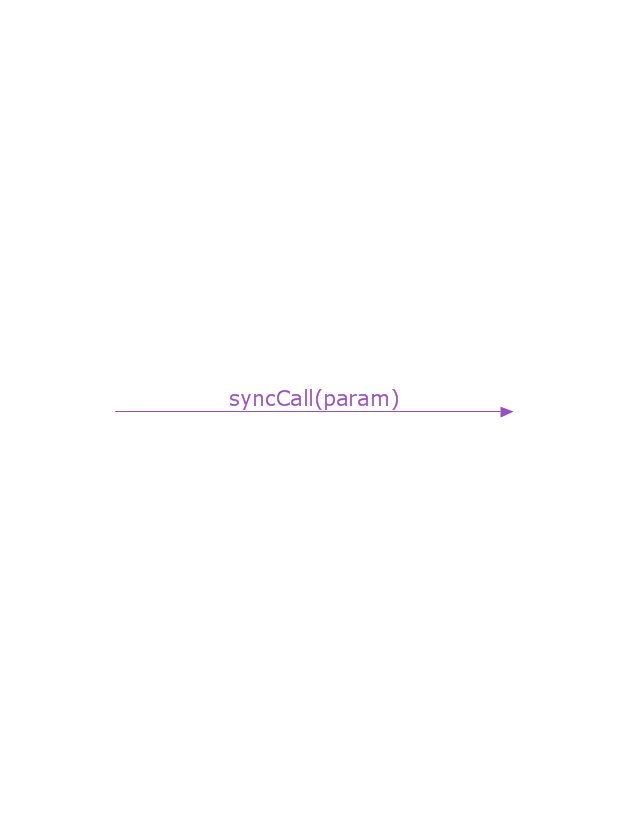
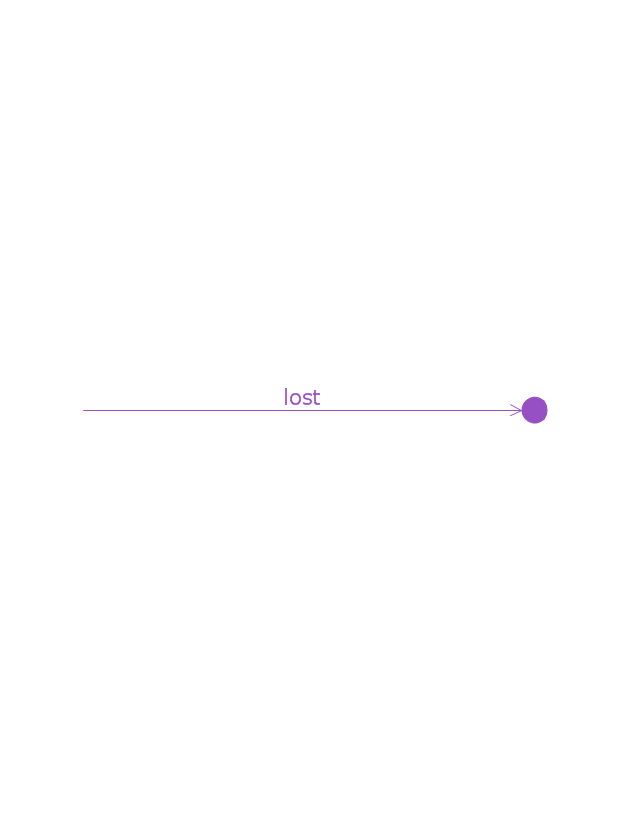
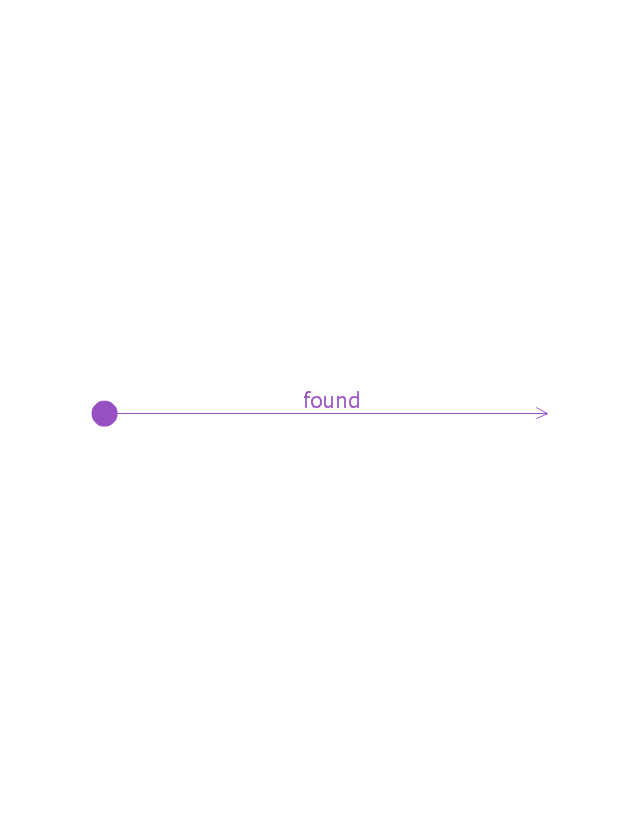
Use it to design your sequence diagrams using ConceptDraw PRO diagramming and vector drawing software.
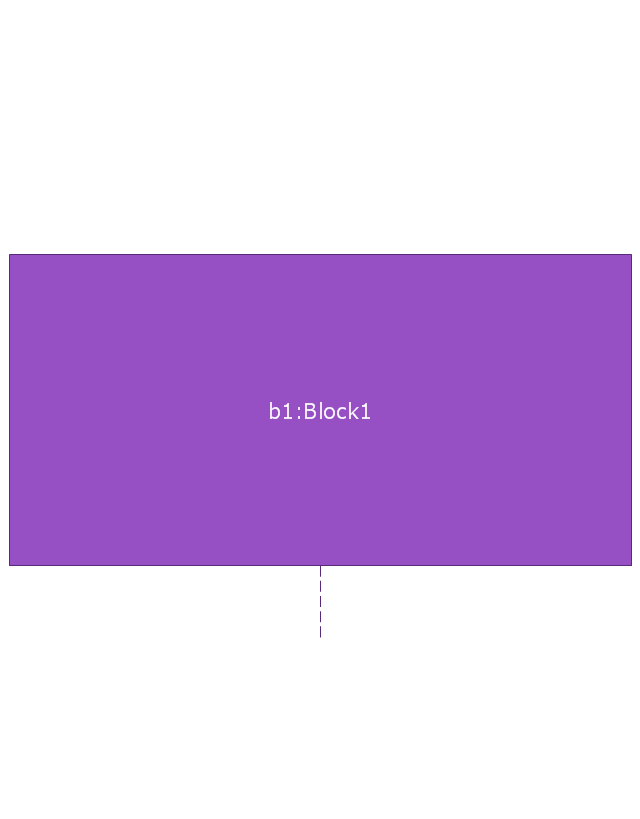
"A sequence diagram shows, as parallel vertical lines (lifelines), different processes or objects that live simultaneously, and, as horizontal arrows, the messages exchanged between them, in the order in which they occur. This allows the specification of simple runtime scenarios in a graphical manner. ...
If the lifeline is that of an object, it demonstrates a role. Leaving the instance name blank can represent anonymous and unnamed instances.
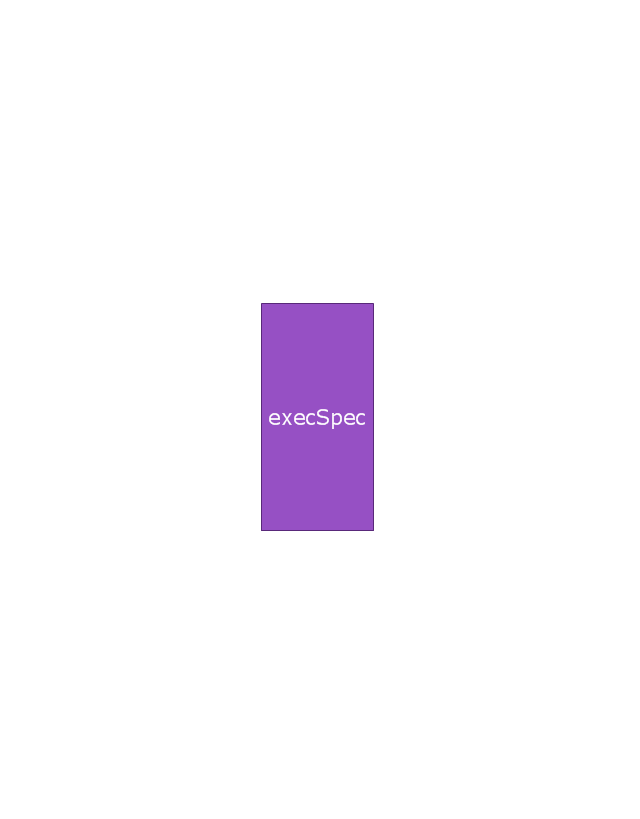
Messages, written with horizontal arrows with the message name written above them, display interaction. Solid arrow heads represent synchronous calls, open arrow heads represent asynchronous messages, and dashed lines represent reply messages. If a caller sends a synchronous message, it must wait until the message is done, such as invoking a subroutine. If a caller sends an asynchronous message, it can continue processing and doesn’t have to wait for a response. Asynchronous calls are present in multithreaded applications and in message-oriented middleware. Activation boxes, or method-call boxes, are opaque rectangles drawn on top of lifelines to represent that processes are being performed in response to the message (ExecutionSpecifications in UML).
Objects calling methods on themselves use messages and add new activation boxes on top of any others to indicate a further level of processing.
When an object is destroyed (removed from memory), an X is drawn on top of the lifeline, and the dashed line ceases to be drawn below it (this is not the case in the first example though). It should be the result of a message, either from the object itself, or another.
A message sent from outside the diagram can be represented by a message originating from a filled-in circle (found message in UML) or from a border of the sequence diagram (gate in UML)." [Sequence diagram. Wikipedia]
The vector stencils library "Sequence diagram" is included in the SysML solution from the Software Development area of ConceptDraw Solution Park.
HelpDesk
How to Draw a Circular Arrows Diagram
The cyclic recurrence is a fundamental property of multiple systems. The cycle is a process which consists from elements (phases, stages, stages) following each other. Many processes in astronomy, biology, chemistry, physics, mathematics, etc. have a cycle properties. It is also widely used in information technologies and marketing analysis. Graphical representation of cyclic processes can have many forms. It can be a circle, parabola, hyperbola, ellipse and others. A Circular Arrows Diagram is used as one of the statistical charts in the business, mass media and marketing. ConceptDraw DIAGRAM provides its users tools for making easy drawing Circular Arrows Diagrams.Financial Comparison Chart
This sample shows the Bar Chart of the leverage ratios for two major investment banks. The leverage ratio is the ratio of the total debt to the total equity; it is a measure of the risk taken by the bank. The higher of the leverage ratio denotes the more risk, the greater risks can lead to the subprime crisis.The vector stencils library "Transport map" contains 96 pictograms for drawing transport maps.
Use it in your spatial infographics for visual representation of transport schemes and plans as metro maps in the ConceptDraw PRO diagramming and vector drawing software extended with the Spatial Infographics solution from the area "What is Infographics" of ConceptDraw Solution Park.
Use it in your spatial infographics for visual representation of transport schemes and plans as metro maps in the ConceptDraw PRO diagramming and vector drawing software extended with the Spatial Infographics solution from the area "What is Infographics" of ConceptDraw Solution Park.


