 Seven Management and Planning Tools
Seven Management and Planning Tools solution extends ConceptDraw DIAGRAM and ConceptDraw MINDMAP with features, templates, samples and libraries of vector stencils for drawing management mind maps and diagrams.
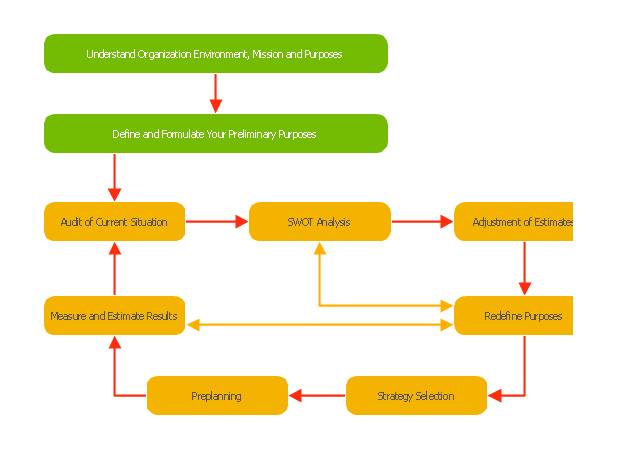
"Planning (also called forethought) is the process of thinking about and organizing the activities required to achieve a desired goal.
Planning involves the creation and maintenance of a plan. As such, planning is a fundamental property of intelligent behavior. This thought process is essential to the creation and refinement of a plan, or integration of it with other plans; that is, it combines forecasting of developments with the preparation of scenarios of how to react to them.
An important, albeit often ignored aspect of planning, is the relationship it holds with forecasting. Forecasting can be described as predicting what the future will look like, whereas planning predicts what the future should look like. The counterpart to planning is spontaneous order." [Planning. Wikipedia]
The block diagram example "Planning process" was created using the ConceptDraw PRO diagramming and vector drawing software extended with the Block Diagrams solution from the area "What is a Diagram" of ConceptDraw Solution Park.
Bubble diagrams in Landscape Design with ConceptDraw DIAGRAM
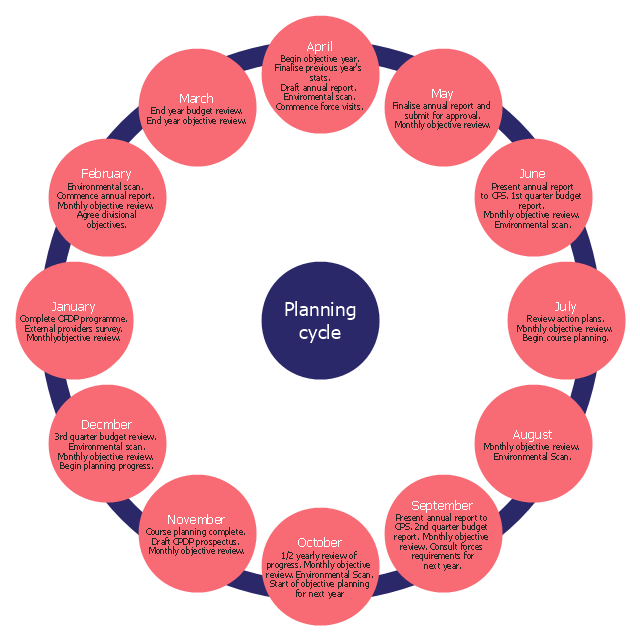
Bubble Diagrams are the charts with a bubble presentation of data with obligatory consideration of bubble's sizes. They are analogs of Mind Maps and find their application at many fields, and even in landscape design. At this case the bubbles are applied to illustrate the arrangement of different areas of future landscape design, such as lawns, flowerbeds, playgrounds, pools, recreation areas, etc. Bubble Diagram helps to see instantly the whole project, it is easy for design and quite informative, in most cases it reflects all needed information. Often Bubble Diagram is used as a draft for the future landscape project, on the first stage of its design, and in case of approval of chosen design concept is created advanced detailed landscape plan with specification of plants and used materials. Creation of Bubble Diagrams for landscape in ConceptDraw DIAGRAM software is an easy task thanks to the Bubble Diagrams solution from "Diagrams" area. You can use the ready scanned location plan as the base or create it easy using the special ConceptDraw libraries and templates.The cycle diagram sample was created on the base of the figure illustrating the webpage "2. POLICY & STRATEGY" of "Scottish Police College Primary Inspection 2006: A Report by Her Majesty's Inspectorate of Constabulary" from the Scottish Government website.
"Strategic Planning.
2.1 The planning process for the College currently follows a structured approach, starting in April and extending through the financial year. The planning cycle is illustrated in figure 2. ...
2.2 The College recognises the need to consult with its customers and stakeholders in the process of setting objectives and directing the training programme. The planning cycle to date refers to force visits, environmental scanning, the course planning process which involves consultation with all forces and other common police services, as well as to a survey of external providers.
2.3 The information from consultation feeds into an EFQM framework from which the College has identified four key policies, namely:
(1) developing and delivering quality training;
(2) developing our people through lifelong learning;
(3) continuous improvement of our service; and
(4) embracing the changing environment.
2.4 The objectives set at divisional level are designed to contribute to delivering these policies. HMIC found that whilst the selected objectives were presented in line with the structure, not all could be considered to meet SMART (Specific, Measurable, Achievable, Relevant and Timed) criteria. This failure indicates that while the process appears suitably structured to deliver a robust result, some of those involved could perhaps have a better understanding of the process." [scotland.gov.uk/ Publications/ 2007/ 02/ 15134652/ 8]
The cycle diagram example "Strategic planning" was created using the ConceptDraw PRO diagramming and vector drawing software extended with the Target and Circular Diagrams solution from the Marketing area of ConceptDraw Solution Park.
www.conceptdraw.com/ solution-park/ marketing-target-and-circular-diagrams
This arrow loop diagram sample was created on the base of the figure illustrating the webpage "Safe Roads for a Safer Future A Joint Safety Strategic Plan" from the website of US Department of Transportation - Federal Highway Administration (FHWA) Office of Safety.
"STRATEGIC PLANNING CYCLE.
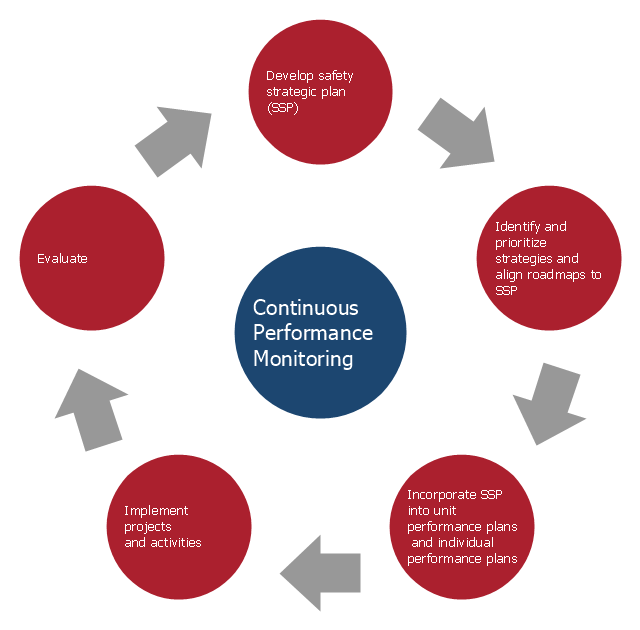
After the safety units issue the SSP, they will identify and prioritize strategies to support the established goals. Many strategies will originate in existing roadmaps or in other program planning activities. The safety units will also use this information when developing their Unit Performance Plans and individual performance plans. Teams within each safety unit will carry out projects and activities to support identified strategies and achieve the SSP goals.
The SSP process also includes continuous performance monitoring and evaluation through which the safety units will review past accomplishments against the established goals, consider how well strategies are implemented, assess progress toward goals, identify risks, consider changes in the environment, and discuss future strategic direction. As a part of the evaluation process, the three safety units will recognize achievements and discuss the need for adjustments. Figure ... shows the strategic planning cycle.
The safety units will update the SSP every 3 to 5 years using input from a variety of sources, including evaluations, safety trends, and legislative changes." [safety.fhwa.dot.gov/ ssp/ ]
The arrow loop diagram example "Strategic planning cycle" was created using the ConceptDraw PRO diagramming and vector drawing software extended with the Target and Circular Diagrams solution from the Marketing area of ConceptDraw Solution Park.
www.conceptdraw.com/ solution-park/ marketing-target-and-circular-diagrams
 Electric and Telecom Plans
The Electric and Telecom Plans solution providing the electric and telecom-related stencils, floor plan electrical symbols and pre-made examples is useful for electricians, interior designers, telecommunications managers, builders and other technicians when creating the electric visual plans and telecom drawings, home electrical plan, residential electric plan, telecom wireless plan, electrical floor plans whether as a part of the building plans or the independent ones.
 Fire and Emergency Plans
It's a good idea to have an emergency exit strategy in place for your home or business. ConceptDraw gives you the tools to create your own fire and emergency plan, tailored to your setting.
Network Layout
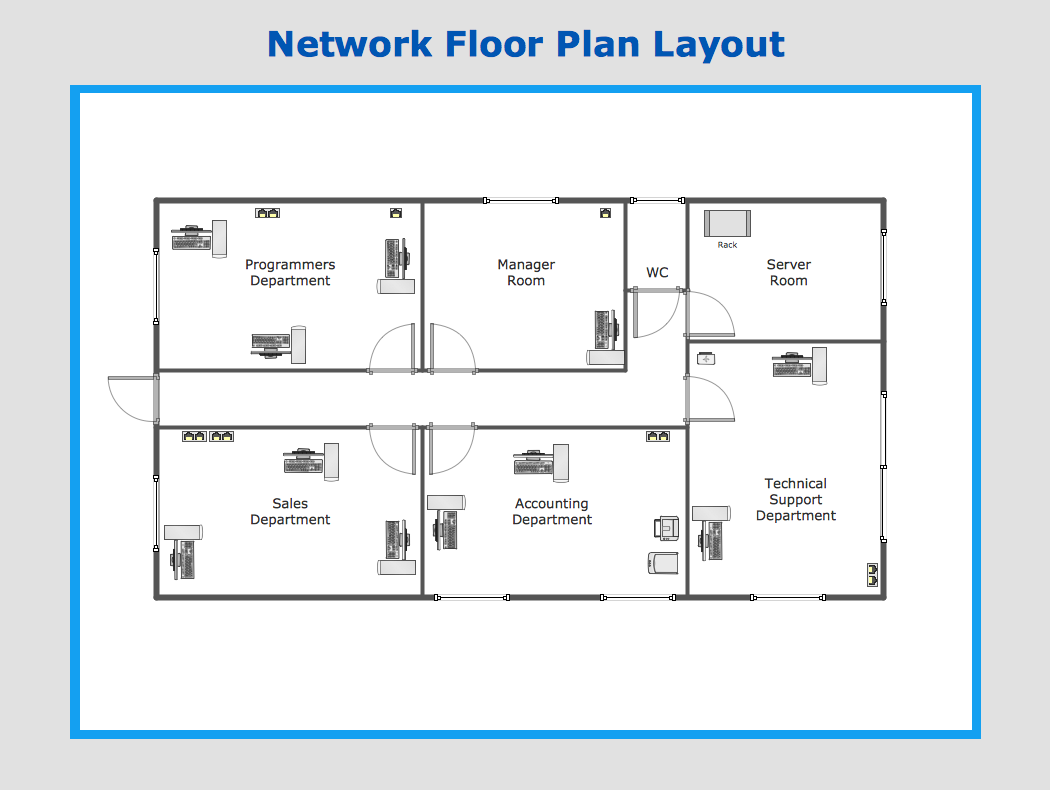
The Network Layout Diagram visually illustrates the arrangement of computers, nodes and other network appliances, such as servers, printers, routers, switches, hubs, and their relationships between each other. The network layout and placement of servers greatly influence on the network security and network performance. Elaboration of robust Network Layout Diagram is especially important when visualizing already existing network in order to understand its complexity; when troubleshooting the network issues; designing, documenting and implementing new network configurations; extending, modifying, or moving an existing network to other location. Through the careful thinking the network plan and designing the clear Network Layout Diagram, you can be confident in result on the stage of network implementation and to solve faster the problems appearing in network infrastructure. ConceptDraw DIAGRAM enhanced with Computer Network Diagrams solution from Computer and Networks area perfectly suits for drawing Network Layout Diagrams for different network topologies.
 Block Diagrams
Block diagrams solution extends ConceptDraw DIAGRAM software with templates, samples and libraries of vector stencils for drawing the block diagrams.
- Seven Management and Planning Tools | Root cause analysis tree ...
- HVAC Plans | Block diagram - Automotive HVAC system | Design ...
- Block diagram - Personal planning process | Seven Management ...
- Seven Management and Planning Tools | Seven Management and ...
- Bubble diagrams in Landscape Design with ConceptDraw PRO ...
- Seven Management and Planning Tools | Bubble diagrams in ...
- Office wireless network plan | Network Diagram Examples | Wireless ...
- Strategic planning - Cycle diagram | SWOT analysis for a small ...
- CORRECTIVE ACTIONS PLANNING . Risk Diagram (PDPC) | How ...
- How To Draw Building Plans | Network Diagram Examples | Network ...
- Event-driven Process Chain Diagrams EPC | Block diagram ...
- Strategic planning - Cycle diagram | Strategic planning cycle - Arrow ...
- Root cause analysis tree diagram - Sale problem solution | Seven ...
- Block diagram - Personal planning process | Basic Diagramming ...
- Fishbone Diagram | Seven Management and Planning Tools | Event ...
- Strategic planning - Cycle diagram | BPR Diagram . Business ...
- Seven Management and Planning Tools | Affinity diagram ...
- Best Strategic Planning Diagram Software
- Risk Analysis | CORRECTIVE ACTIONS PLANNING Risk Diagram ...
- Fishbone Diagram Strategic Planning


