This typography infographics example was redesigned from the Wikimedia Commons file: Sentido jerarquico de las normas.png. [commons.wikimedia.org/ wiki/ File:Sentido_ jerarquico_ de_ las_ normas.png]
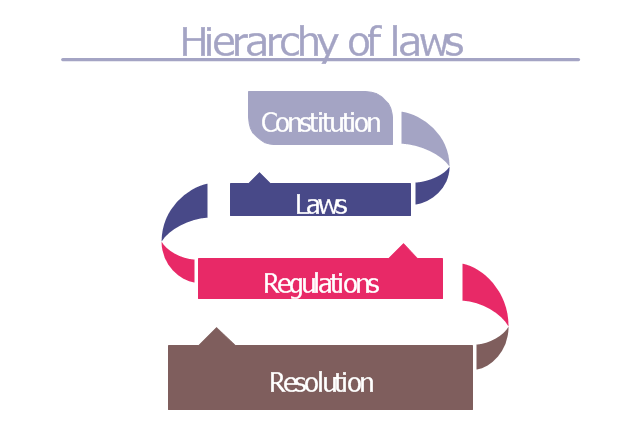
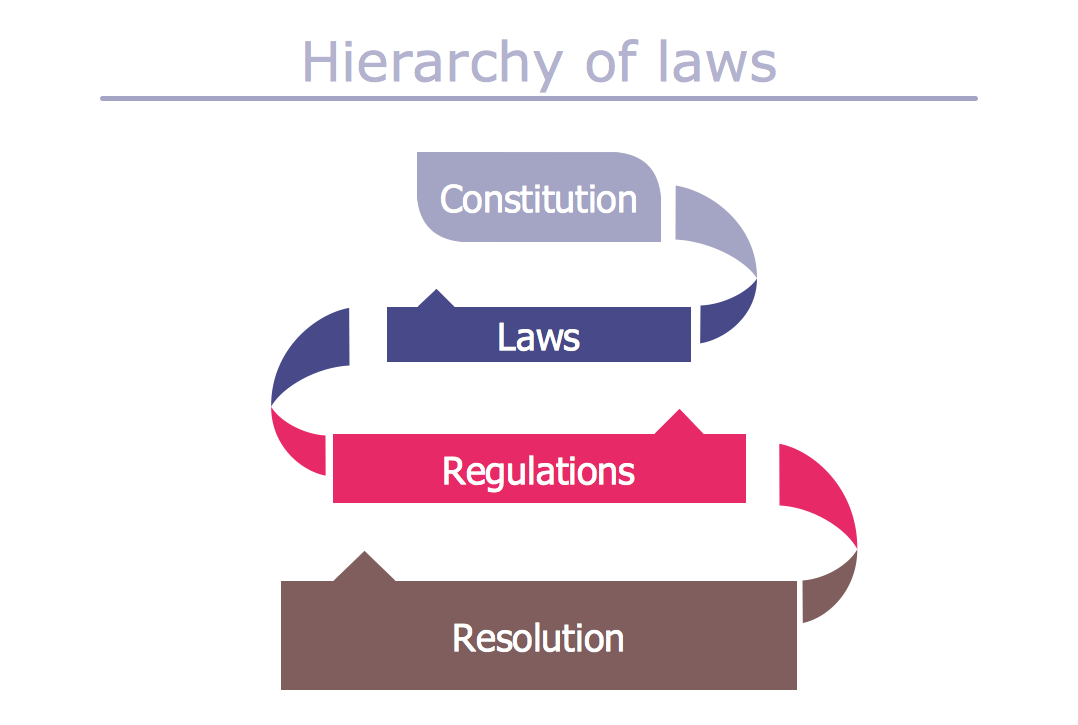
"Hierarchy of laws.
Article 1.2 of the Spanish Civil Code establishes that inferior and superior laws to be distinguished. However, the relationship between laws is not limited to a question of hierarchy, but also relationships of competency exist between some laws and others.
With effect to this, the Spanish Constitution of 1978 is the supreme law, which regulates all the complex relationships between the different laws and their place in the hierarchy.
The hierarchy of Spanish laws is thus:
(1) The Constitution.
(2) International treaties.
(3) The law in its strict sense: Organic Law (which requires an absolute majority from the Cortes Generales), ordinary law and regulatory laws (amongst which are found the Royal Decree of Law and the Legislative Royal Decree).
(4) Laws stemming from the executive, with its own hierarchy based on the function of the body that made them (Royal Decree, Decree, Ministerial Order, etc.)." [Law of Spain. Wikipedia]
The infographics example "Hierarchy of laws" was created using the ConceptDraw PRO diagramming and vector drawing software extended with the Typography Infographics solition from the area "What is infographics" in ConceptDraw Solution Park.
Typography Art
Typography Infographics Solution for ConceptDraw Solution Park is the best answer on the question “How to create an Infographic?”. The Typography Infographics created in ConceptDraw DIAGRAM using the Typography Infographics Solution are the real typography art.Pyramid Diagram
The representation of data in a hierarchical or pyramid-like form is one of the most effective and illustrative ways of structuring the data, information, ideas in different fields, among them marketing, management, business, finances, sales, consulting, media, and some others. Pyramid Diagram perfectly suits for this goal, especially if we talk about the representing some marketing strategies, information systems, social strategies. Pyramid Diagram looks like a triangle or reversed triangle that is divided visually on several layers. Each layer can be colored with its own color, this lets visually highlight important moments. ConceptDraw DIAGRAM diagramming and vector graphics software extended with Pyramid Diagrams solution from the Marketing area provides powerful drawing tools, templates, samples, and built-in vector pyramid objects, thus all required tools for equally easy drawing Three level pyramid diagram, Four level pyramid model, Five level pyramid, etc., at this your Pyramid diagrams can have 2D or 3D view as you like.Typography Infographic Examples
ConceptDraw DIAGRAM extended with Typography Infographics Solution from the “Infographics” Area is a powerful infographic software that offers you variety of infographics examples. Use of predesigned examples as the base for your own Typography Infographics is a timesaving and useful way. Simply open the desired example, change for your needs and then successfully use it in any field of your activity.Typography Font
How to create an infographic and make it successful and professional looking? It is a complex process with great quantity of important moments that you should consider. Design and Typography Font play the significant role in the success of typography graphic. Typography Font makes your Typography Infographic unique and attractive. ConceptDraw DIAGRAM extended with Typography Infographics Solution from the “Infographics” Area provides you the useful tools for simple and quick designing various Typography Infographics.- Hierarchy of laws | Design elements - Tabbed text blocks | Ribbon ...
- U.S. Medicare spending per capita | Hierarchy of laws | EU ...
- Hierarchy of laws | Ribbon interface - Vector stencils library | U.S. ...
- Text All Png
- Titles Elements Png
- Ribbon Png
- Diagram Png
- Design elements - Management title blocks | Design elements ...
- Pyramid Png
- Goods And Services Png
- Typography Png
- Infographic Elements Png
- Hierarchical Network Topology | Venn Diagram Examples for ...
- Law Icon Png
- Png Diagram
- Knowledge hierarchy triangle diagram | Pyramid Diagram | Pyramid ...
- Ribbon Design Png
- Hierarchy System Example
- Hierarchy Information System


