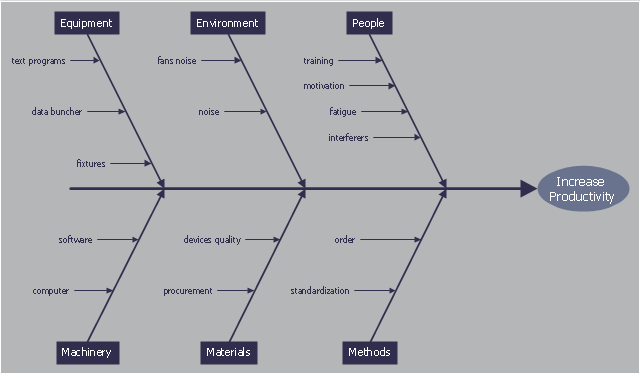
This cause and effect diagram sample was redesigned from the Wikimedia Commons file: Ursache Wirkung Diagramm Beispiel.png. [commons.wikimedia.org/ wiki/ File:Ursache_ Wirkung_ Diagramm_ Beispiel.png]
This file is licensed under the Creative Commons Attribution-Share Alike 3.0 Unported license. [creativecommons.org/ licenses/ by-sa/ 3.0/ deed.en]
"Productivity is the ratio of output to inputs in production; it is an average measure of the efficiency of production. Efficiency of production means production’s capability to create incomes which is measured by the formula real output value minus real input value.
Productivity is a crucial factor in production performance of firms and nations. Increasing national productivity can raise living standards because more real income improves people's ability to purchase goods and services, enjoy leisure, improve housing and education and contribute to social and environmental programs. Productivity growth also helps businesses to be more profitable." [Productivity. Wikipedia]
The fishbone diagram example "Increase in productivity" was created using the ConceptDraw PRO diagramming and vector drawing software extended with the Fishbone Diagrams solution from the Management area of ConceptDraw Solution Park.
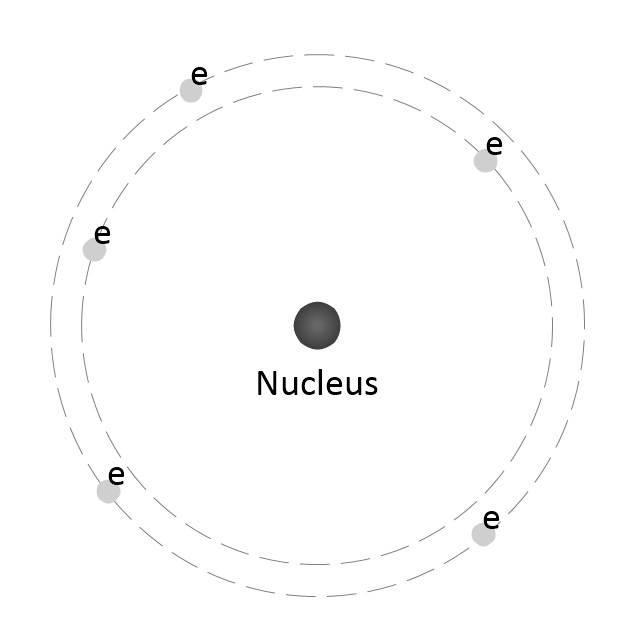
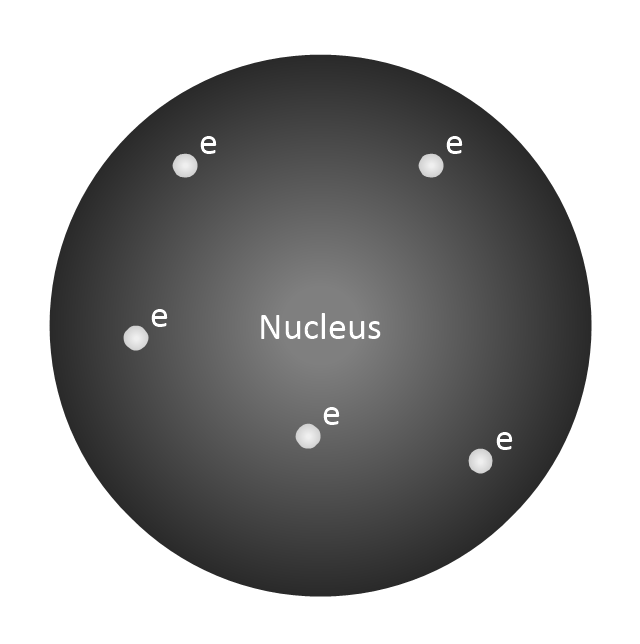
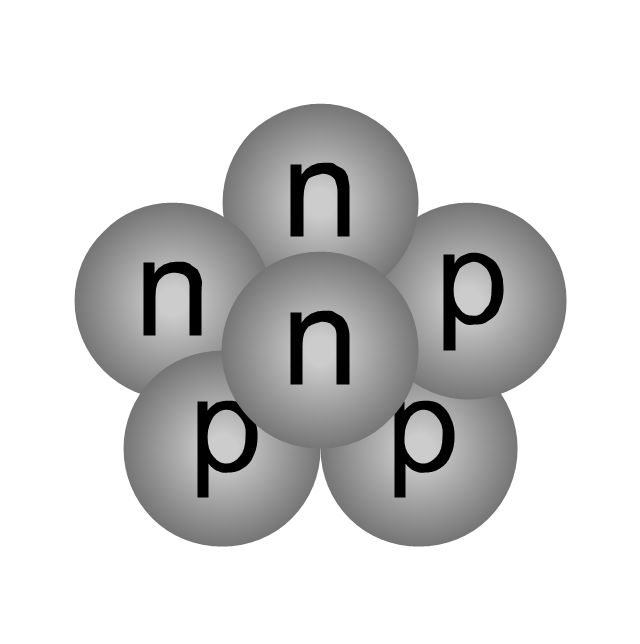
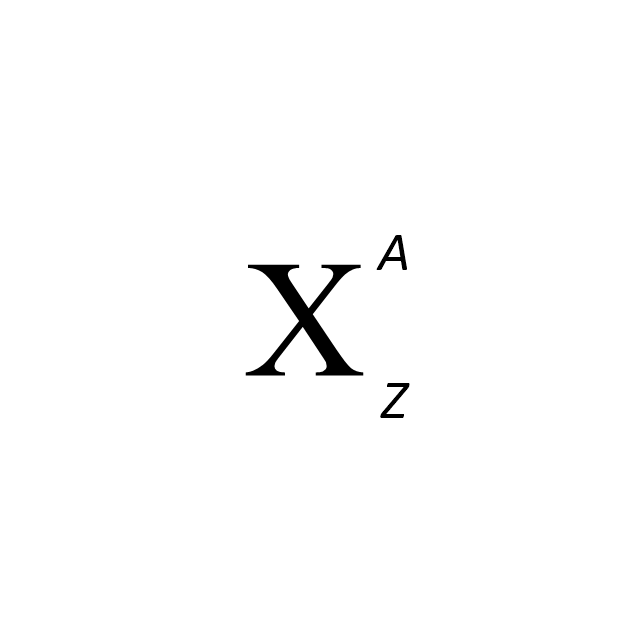
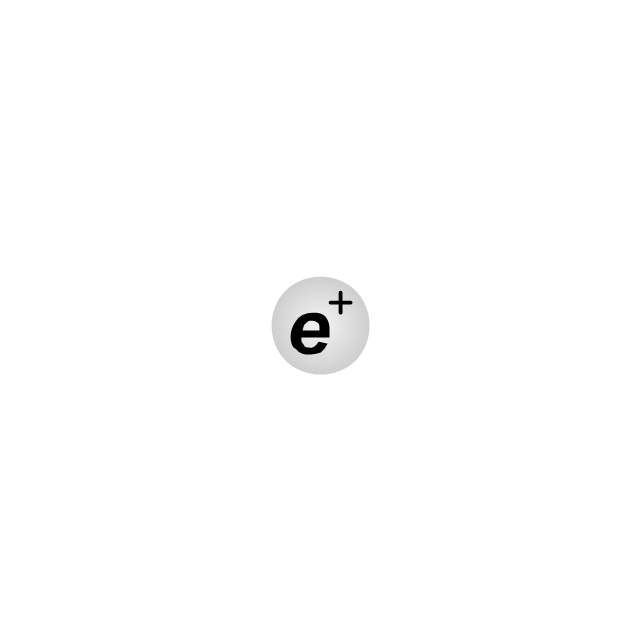
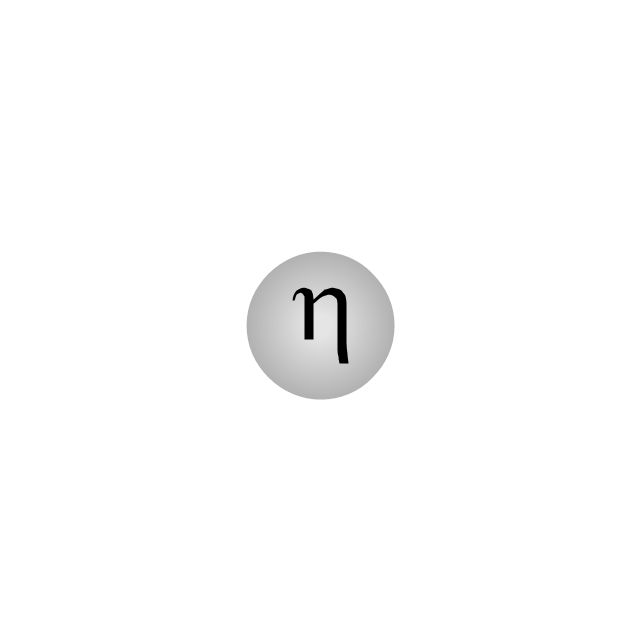
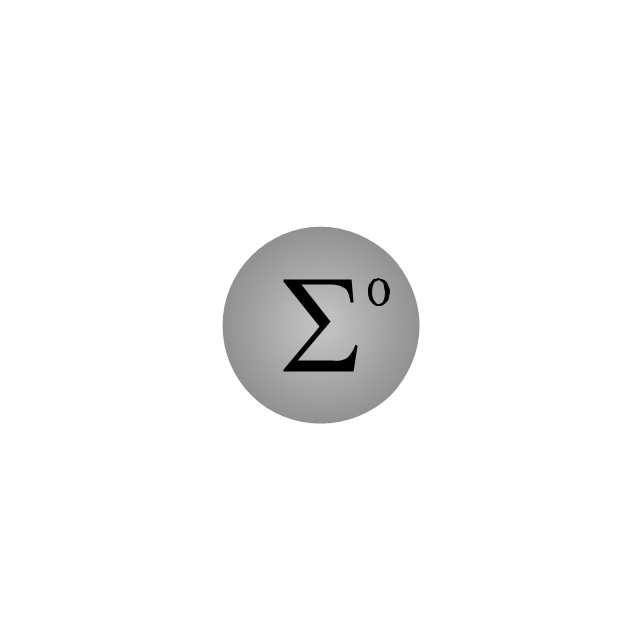
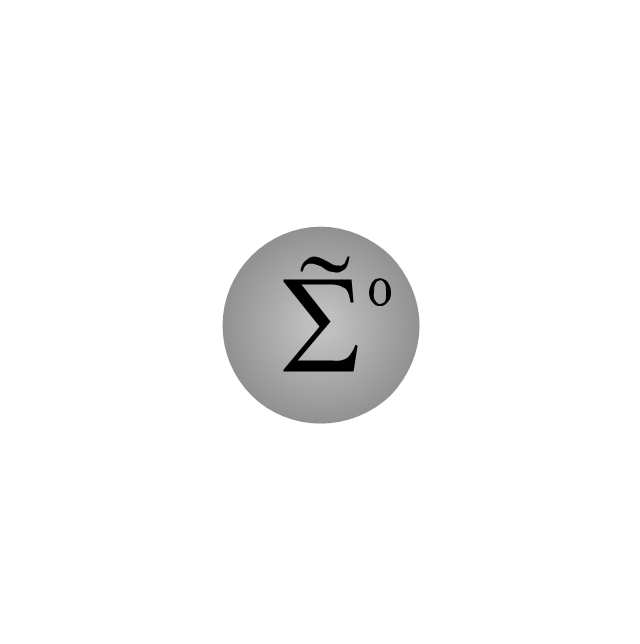
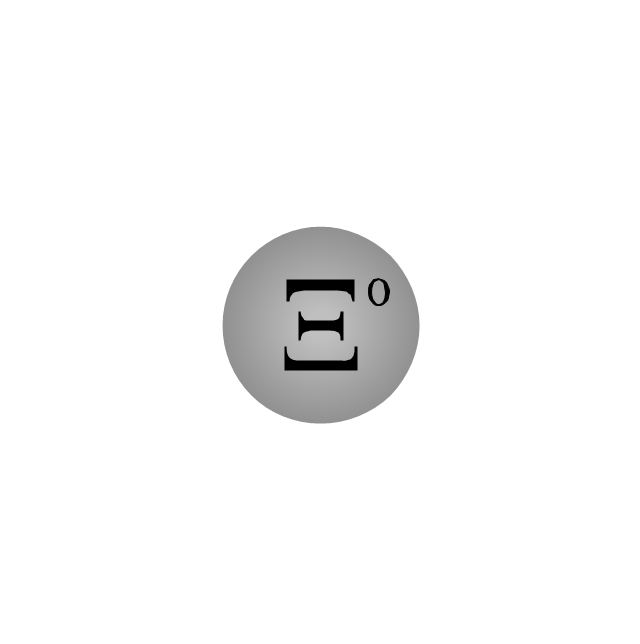
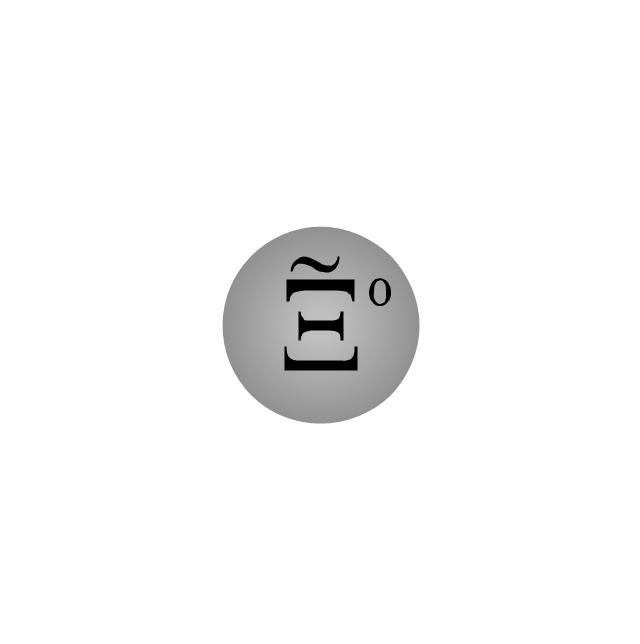
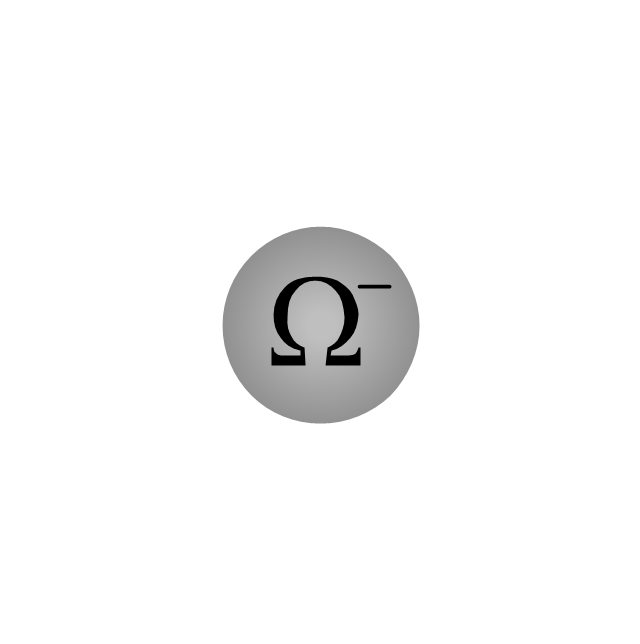
The vector shapes library "Nuclear physics" contains 39 symbol icons of elementary particles.
Use these shapes for drawing nuclear physics diagrams of nuclear reactions and experiments in the ConceptDraw PRO diagramming and vector drawing software extended with the Physics solution from the Science and Education area of ConceptDraw Solution Park.
www.conceptdraw.com/ solution-park/ science-education-physics
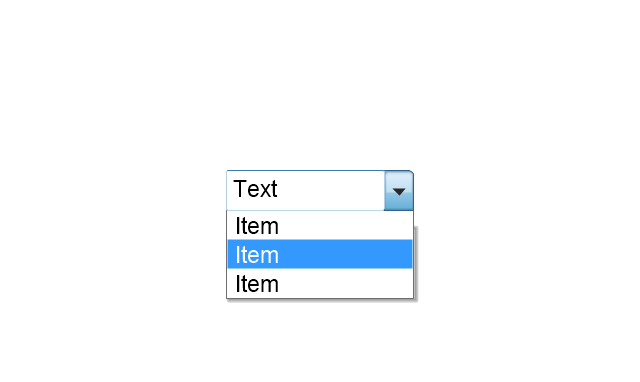
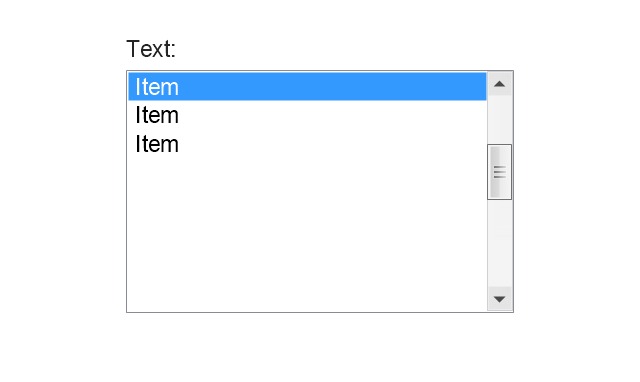
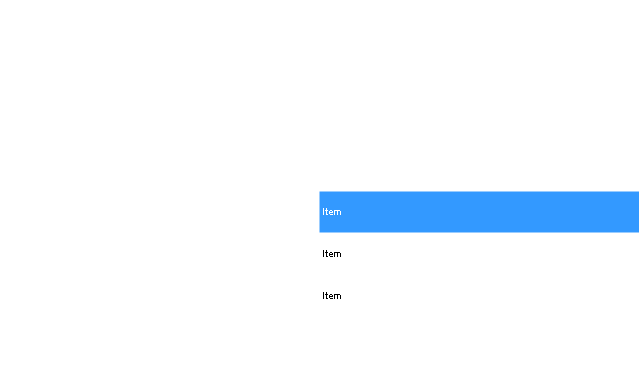
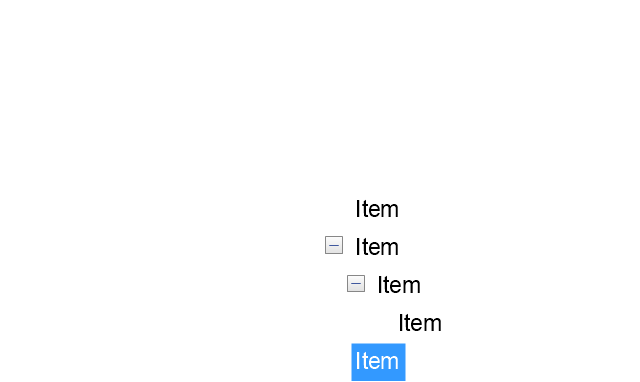
The vector stencils library "Progressive disclosure controls" contains 12 icons of Windows 8 progressive disclosure controls.
Use it to design graphic user interface (GUI) prototypes of your software applications for Windows 8.
"With a progressive disclosure control, users can show or hide additional information including data, options, or commands. Progressive disclosure promotes simplicity by focusing on the essential, yet revealing additional detail as needed. ...
Chevrons show or hide the remaining items in completely or partially hidden content. Usually the items are shown in place, but they can also be shown in a pop-up menu. When in place, the item stays expanded until the user collapses it. ...
Arrows show a pop-up command menu. The item stays expanded until the user makes a selection or clicks anywhere.
If the arrow button is an independent control, it receives input focus and is activated with the space bar. If the arrow button has a parent control, the parent receives input focus and the arrow is activated with Alt+down arrow and Alt+up arrow keys, as with the drop-down list control. ...
Plus and minus controls expand or collapse to show container content in place when navigating through a hierarchy. The item stays expanded until the user collapses it. Although these look like buttons, their behavior is in-place.
The associated object receives input focus. The plus is activated with the right arrow key, and the minus with the left arrow key. ...
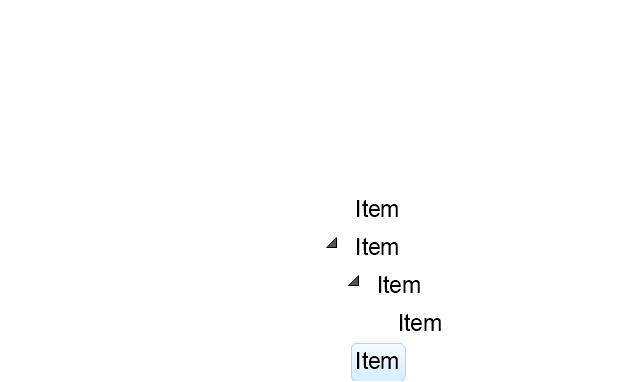
Rotating triangles show or hide additional information in place for an individual item. They are also used to expand containers. The item stays expanded until the user collapses it.
The associated object receives input focus. The collapsed (right-pointing) triangle is activated with the right arrow key, and the expanded (downward-pointing) triangle with the left arrow key. ...
Like chevrons, additional information is shown or hidden in place. The item stays expanded until the user collapses it. Unlike chevrons, the glyphs have a graphical representation of the action, typically with an arrow indicating what will happen. ... Preview arrows are best reserved for situations where a standard chevron doesn't adequately communicate the control's behavior, such as when the disclosure is complex or there is more than one type of disclosure." [msdn.microsoft.com/ en-us/ library/ windows/ desktop/ dn742409%28v=vs.85%29.aspx]
The icons example "Progressive disclosure controls - Vector stencils library" was created using the ConceptDraw PRO diagramming and vector drawing software extended with the Windows 8 User Interface solution from the Software Development area of ConceptDraw Solution Park.
Making Mechanical Diagram
The engineering diagrams produced with ConceptDraw DIAGRAM are vector graphic documents and are available for reviewing, modifying, and converting to a variety of formats (image, HTML, PDF file, MS PowerPoint Presentation, Adobe Flash or MS Visio XML).The vector clipart library "Presentation design elements" contains 45 presentation symbols and arrows which you can easy use in your slides and illustrations.
"A presentation is the process of presenting a topic to an audience. It is typically a demonstration, lecture, or speech meant to inform, persuade, or build good will. ... the use of visuals reduced meeting times... audiences believe presenters who use visuals are more professional and credible than presenters who merely speak. ... meetings and presentations reinforced with visuals help participants reach decisions and consensus more quickly." [Presentation. Wikipedia]
The clip art example "Presentation design elements - Vector clipart library" was created in the ConceptDraw PRO diagramming and vector drawing software using the Presentation Clipart solution from the Illustration area of ConceptDraw Solution Park.
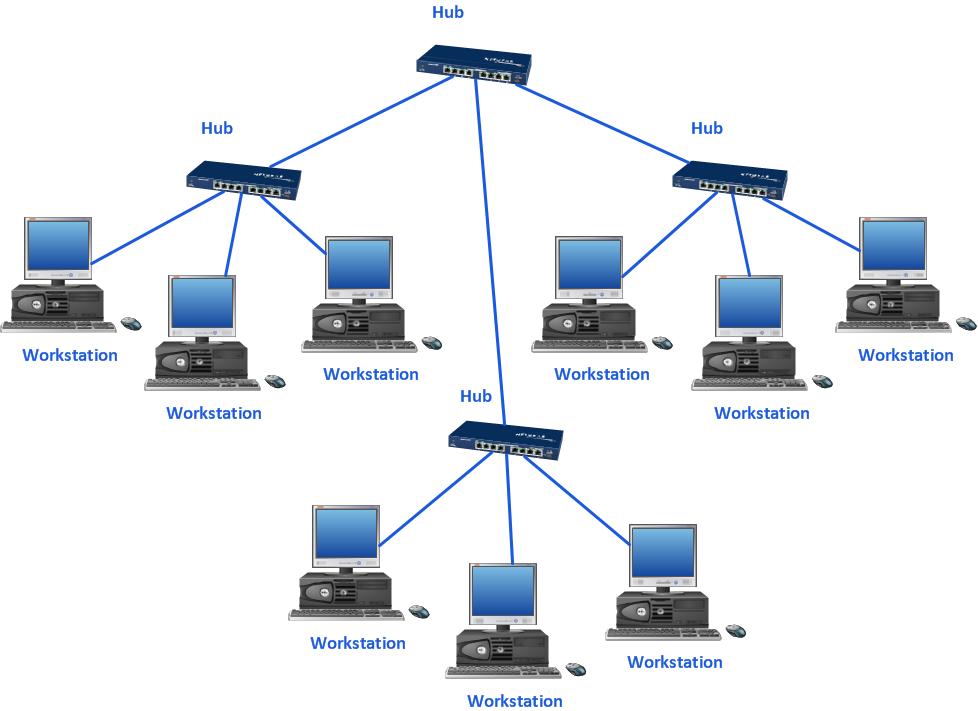
Local area network (LAN). Computer and Network Examples
Local Area Network (LAN) is a network which consists of computers and peripheral devices connected each other and to the local domain server, and covers a little territory or small number of buildings, such as home, school, laboratory, office, etc. LAN serves for few hundreds of users. It includes many cables and wires, and demands to design previously a Network diagram. All local area network devices can use the shared printers and disk storage. ConceptDraw DIAGRAM is a perfect network diagramming software with examples of LAN Diagrams, templates and predesigned vector objects. ConceptDraw DIAGRAM is the ideal choice for network engineers and network designers who need to draw fast and easy Local Area Network Diagrams, for IT specialists, developers and other IT professionals which need to visualize the communication schemes of LAN and visually document the LAN's physical structure and arrangement in houses, offices and other buildings. Ready-to-use vector objects from Computer Network Diagrams solution will help you design LAN diagrams in minutes.
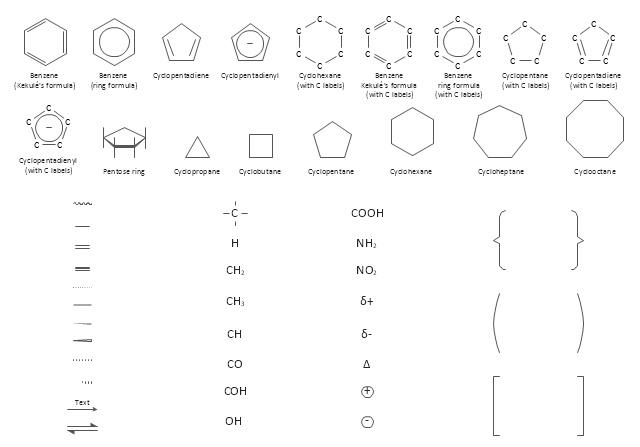
The vector stencils library "Chemical drawings" contains 81 symbols of organic compounds and functional groups for chemical drawing.
Use it to draw structural formulas of organic molecules, schemes of chemical reactions and organic chemistry diagrams.
"Structural drawings.
Organic molecules are described more commonly by drawings or structural formulas, combinations of drawings and chemical symbols. The line-angle formula is simple and unambiguous. In this system, the endpoints and intersections of each line represent one carbon, and hydrogen atoms can either be notated explicitly or assumed to be present as implied by tetravalent carbon. The depiction of organic compounds with drawings is greatly simplified by the fact that carbon in almost all organic compounds has four bonds, nitrogen three, oxygen two, and hydrogen one. ...
Organic reactions.
Organic reactions are chemical reactions involving organic compounds. While pure hydrocarbons undergo certain limited classes of reactions, many more reactions which organic compounds undergo are largely determined by functional groups. The general theory of these reactions involves careful analysis of such properties as the electron affinity of key atoms, bond strengths and steric hindrance. These issues can determine the relative stability of short-lived reactive intermediates, which usually directly determine the path of the reaction.
The basic reaction types are: addition reactions, elimination reactions, substitution reactions, pericyclic reactions, rearrangement reactions and redox reactions. ...
Each reaction has a stepwise reaction mechanism that explains how it happens in sequence - although the detailed description of steps is not always clear from a list of reactants alone.
The stepwise course of any given reaction mechanism can be represented using arrow pushing techniques in which curved arrows are used to track the movement of electrons as starting materials transition through intermediates to final products." [Organic chemistry. Wikipedia]
The chemical symbols example "Design elements - Chemical drawings" was created using the ConceptDraw PRO software extended with the Chemistry solution from the Science and Education area of ConceptDraw Solution Park.
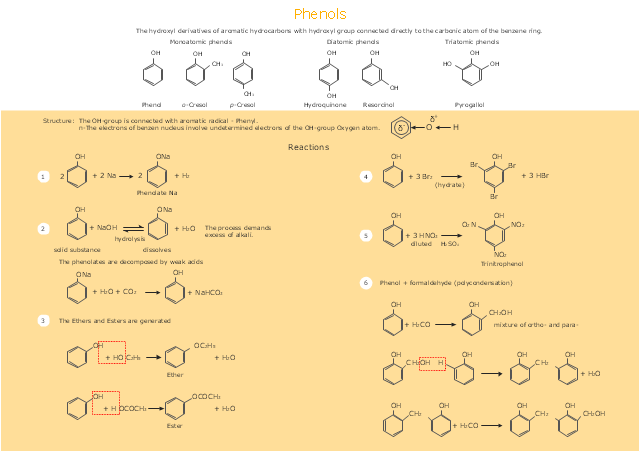
This drawing illustrates examples o f phenolic compounds molecular structures, and chemical reactions of phenols.
"In organic chemistry, phenols, sometimes called phenolics, are a class of chemical compounds consisting of a hydroxyl group (-OH) bonded directly to an aromatic hydrocarbon group. The simplest of the class is phenol, which is also called carbolic acid C6H5OH. Phenolic compounds are classified as simple phenols or polyphenols based on the number of phenol units in the molecule. ...
Although similar to alcohols, phenols have unique properties and are not classified as alcohols (since the hydroxyl group is not bonded to a saturated carbon atom). They have higher acidities due to the aromatic ring's tight coupling with the oxygen and a relatively loose bond between the oxygen and hydrogen. The acidity of the hydroxyl group in phenols is commonly intermediate between that of aliphatic alcohols and carboxylic acids (their pKa is usually between 10 and 12).
Loss of a positive hydrogen ion (H+) from the hydroxyl group of a phenol forms a corresponding negative phenolate ion or phenoxide ion, and the corresponding salts are called phenolates or phenoxides, although the term aryloxides is preferred according to the IUPAC Gold Book. Phenols can have two or more hydroxy groups bonded to the aromatic ring(s) in the same molecule. The simplest examples are the three benzenediols, each having two hydroxy groups on a benzene ring." [Phenols. Wikipedia]
The chemical drawing example "Phenols" was created using the ConceptDraw PRO software extended with the Chemistry solution from the Science and Education area of ConceptDraw Solution Park.
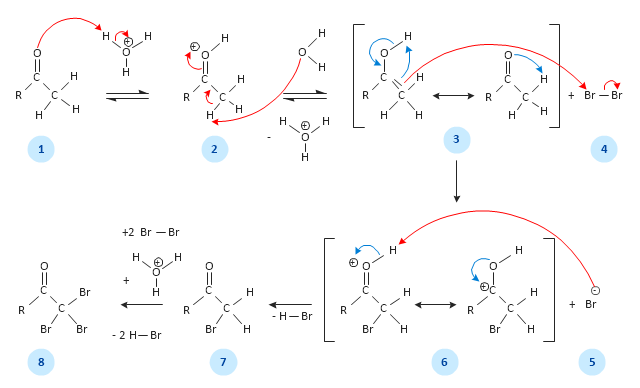
This chemical reaction mechanism drawing depicts steps of carbonyl compound halogenation reaction.
"Alpha-substitution reactions occur at the position next to the carbonyl group, the α-position, and involve the substitution of an α hydrogen atom by an electrophile, E, through either an enol or enolate ion intermediate. ...
Alpha Halogenation of Aldehydes and Ketones.
A particularly common α-substitution reaction in the laboratory is the halogenation of aldehydes and ketones at their α positions by reaction Cl2, Br2 or I2 in acidic solution. Bromine in acetic acid solvent is often used. ...
The halogenation is a typical α-substitution reaction that proceeds by acid catalyzed formation of an enol intermediate." [Carbonyl Alpha-Substitution Reactions. Wikipedia]
This example was redesigned from the Wikimedia Commons file: Halogenierung Mechanismus Version 3-Seite001.svg. [commons.wikimedia.org/ wiki/ File:Halogenierung_ Mechanismus_ Version_ 3-Seite001.svg]
This image is available under the Creative Commons Attribution-ShareAlike 3.0 Unported License. [creativecommons.org/ licenses/ by-sa/ 3.0/ ]
The chemical drawing example "Carbonyl compound halogenation mechanism" was created using the ConceptDraw PRO diagramming and vector drawing software extended with the Chemistry solution from the Science and Education area of ConceptDraw Solution Park.
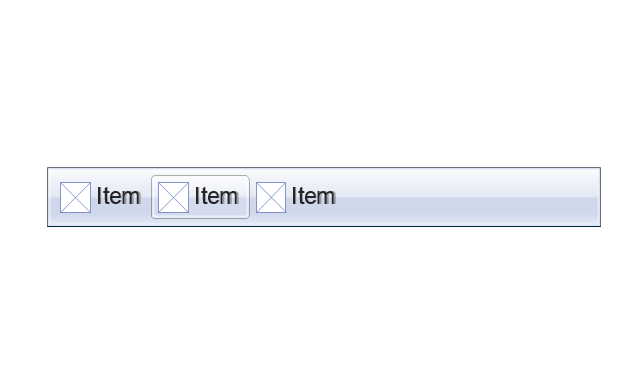
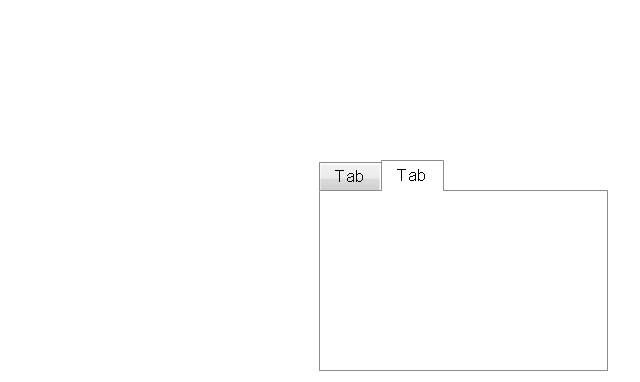
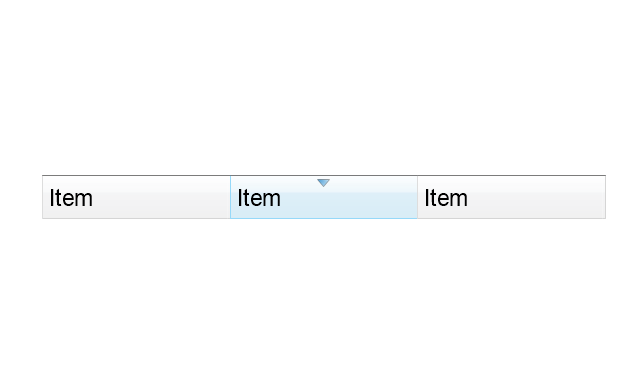
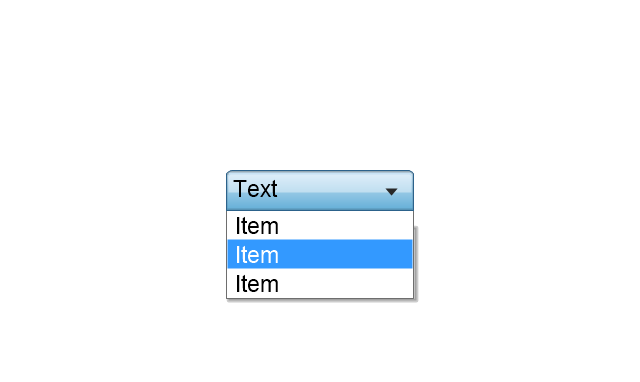
The vector stencils library "MS Windows Vista user interface" contains 76 MS Windows Vista design elements.
Use it for designing Microsoft ribbon graphic user interface (GUI) of software for computers with MS Windows Vista OS in the ConceptDraw PRO diagramming and vector drawing software extended with the Graphic User Interface solution from the Software Development area of ConceptDraw Solution Park.
Use it for designing Microsoft ribbon graphic user interface (GUI) of software for computers with MS Windows Vista OS in the ConceptDraw PRO diagramming and vector drawing software extended with the Graphic User Interface solution from the Software Development area of ConceptDraw Solution Park.
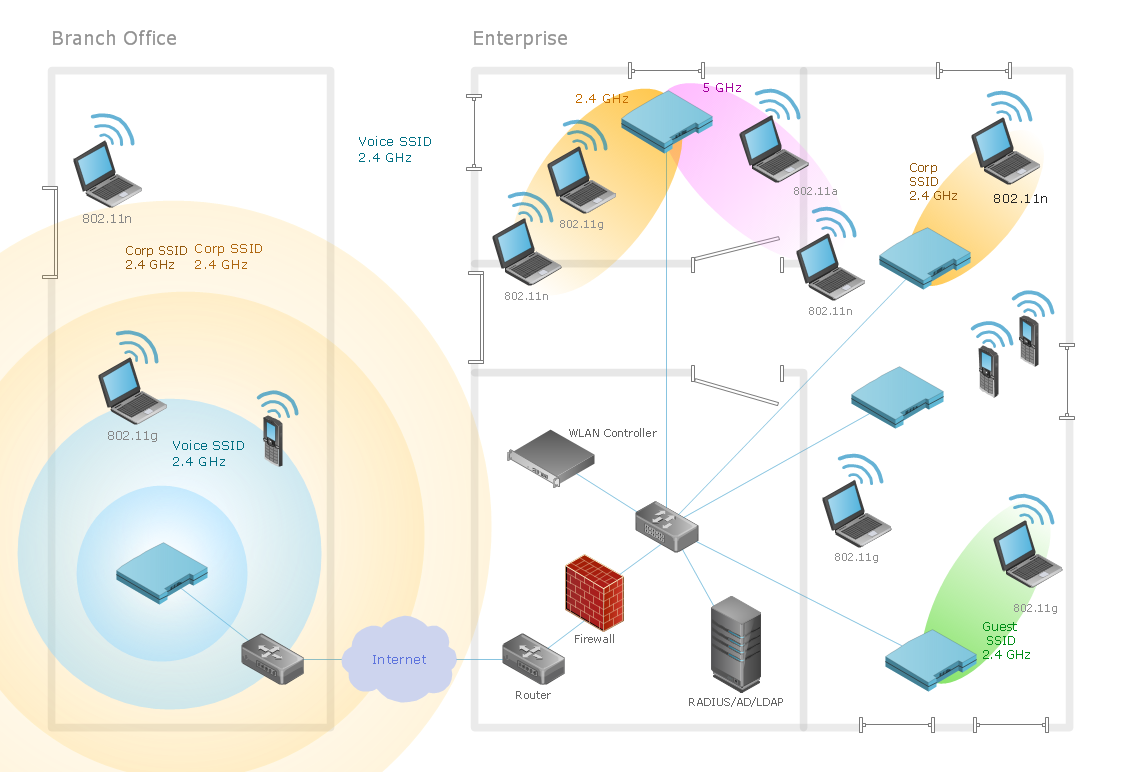
Diagram of a Wireless Network
ConceptDraw DIAGRAM is a Wireless Network Drawing software to create and illustrate wireless network diagrams.Using Both Wired and Wireless Connections
The ConceptDraw Wireless Networks solution helps users to quickly transit from an idea to the implementation of a both wired and wireless computer networks.Mac Diagramming Software
ConceptDraw DIAGRAM software is the best Mac diagramming software for drawing any type of diagrams. Its rich set of samples and templates, and specific features to draw with great visual appeal on Mac OS X.Bar Diagrams for Problem Solving. Create manufacturing and economics bar charts with Bar Graphs Solution
Create bar charts for visualizing problem solving in manufacturing and economics using the ConceptDraw DIAGRAM diagramming and vector drawing software extended with the Bar Graphs Solution from the Graphs and Charts area of ConceptDraw Solition Park.This vector stencils library contains 195 cloud computing icons.
Use it to design cloud computing infographic and diagrams with ConceptDraw PRO software.
"Cloud computing, also on-demand computing, is a kind of Internet-based computing that provides shared processing resources and data to computers and other devices on demand. It is a model for enabling ubiquitous, on-demand access to a shared pool of configurable computing resources (e.g., networks, servers, storage, applications and services), which can be rapidly provisioned and released with minimal management effort. Cloud computing and storage solutions provide users and enterprises with various capabilities to store and process their data in third-party data centers.
Cloud computing has become a highly demanded service or utility due to the advantages of high computing power, cheap cost of services, high performance, scalability, accessibility as well as availability." [Cloud computing. Wikipedia]
The vector stencils library "Cloud clipart" is included in the Cloud Computing Diagrams solution from the Computer and Networks area of ConceptDraw Solution Park.
- Plus And Minus Sign Png Firm Cartoon
- Meeting Cartoon Png
- Chevron Focus Indicator Icon Png
- Blue Wedding Background Design Png
- Lever Png
- Physics Icon Png
- Medical Meeting Png Vector
- Time Clipart Png
- Time For Expansion Clip Art Png
- Cubetto Flowchart | How To Do A Mind Map In PowerPoint | How to ...
- Clipart Background Designs Png
- Market Clipart Png
- Growth Png Clipart
- Cliparts Design Png
- Meeting Clipart Png
- Pro Con Clipart Png
- Vector Backgrounds Png
- Png Button For Collapse Up Down
- White Clock Hands Png
- Triangle Back Icon Png White






-nuclear-physics---vector-shapes-library.png--diagram-flowchart-example.png)
-nuclear-physics---vector-shapes-library.png--diagram-flowchart-example.png)
-nuclear-physics---vector-shapes-library.png--diagram-flowchart-example.png)
-nuclear-physics---vector-shapes-library.png--diagram-flowchart-example.png)
-nuclear-physics---vector-shapes-library.png--diagram-flowchart-example.png)
-nuclear-physics---vector-shapes-library.png--diagram-flowchart-example.png)
-nuclear-physics---vector-shapes-library.png--diagram-flowchart-example.png)
-nuclear-physics---vector-shapes-library.png--diagram-flowchart-example.png)
-nuclear-physics---vector-shapes-library.png--diagram-flowchart-example.png)
-nuclear-physics---vector-shapes-library.png--diagram-flowchart-example.png)
-nuclear-physics---vector-shapes-library.png--diagram-flowchart-example.png)
-nuclear-physics---vector-shapes-library.png--diagram-flowchart-example.png)
-nuclear-physics---vector-shapes-library.png--diagram-flowchart-example.png)






























































-cloud-clipart---vector-stencils-library.png--diagram-flowchart-example.png)
-cloud-clipart---vector-stencils-library.png--diagram-flowchart-example.png)


-cloud-clipart---vector-stencils-library.png--diagram-flowchart-example.png)


-cloud-clipart---vector-stencils-library.png--diagram-flowchart-example.png)
-cloud-clipart---vector-stencils-library.png--diagram-flowchart-example.png)


