Risk Positioning Diagram
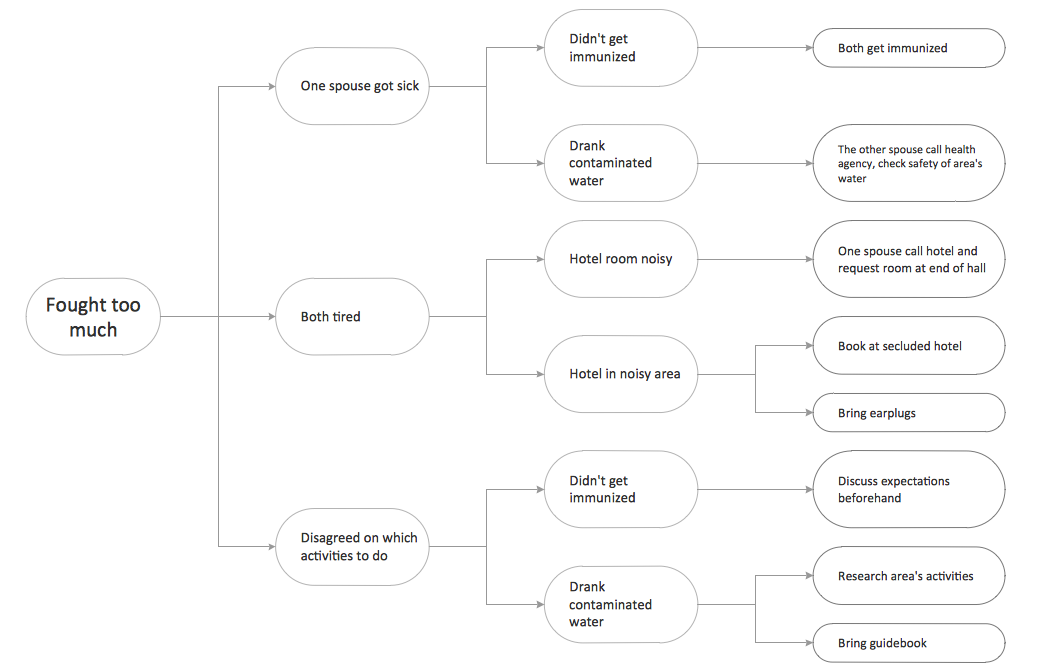
Risk Positioning Diagram - This sample was created in ConceptDraw DIAGRAM diagramming and vector drawing software using the Seven Management and Planning Tools Solution from the Business Productivity area of ConceptDraw Solution Park. This sample shows the Risk positioning diagram. There are visually displayed problems and solutions near them. You can view and analyze the causations and solutions.Infield Positioning for Baseball Situations
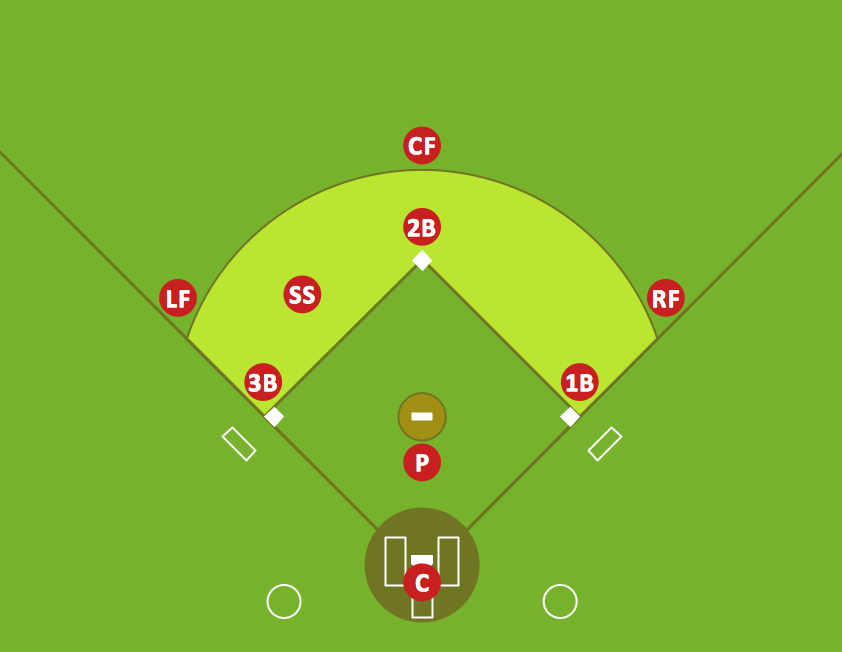
Infield Positioning for Baseball Situations - Baseball is very interesting and popular sport game. As each sport game it includes large quantity of game situations, positions and rules. If you are baseball coach or fan, you need convenient and useful software to design the baseball-related diagrams. In this case ConceptDraw DIAGRAM diagramming and vector drawing software is a real godsend for you!Positioning Map
ConceptDraw DIAGRAM is a powerful diagramming and vector drawing software. Extended with Matrices Solution from the Marketing Area of ConceptDraw Solution Park it became the best software for quick and easy designing various types of Matrix Diagrams, including Positioning Map.In marketing perceptual or positioning maps are used for developing the market positioning strategy for product or service.
"Perceptual mapping is a diagrammatic technique used by asset marketers that attempts to visually display the perceptions of customers or potential customers. Typically the position of a product, product line, brand, or company is displayed relative to their competition." [Perceptual mapping. Wikipedia]
This positioning map diagram example was created using the ConceptDraw PRO diagramming and vector drawing software extended with the Matrices solution from the Marketing area of ConceptDraw Solution Park.
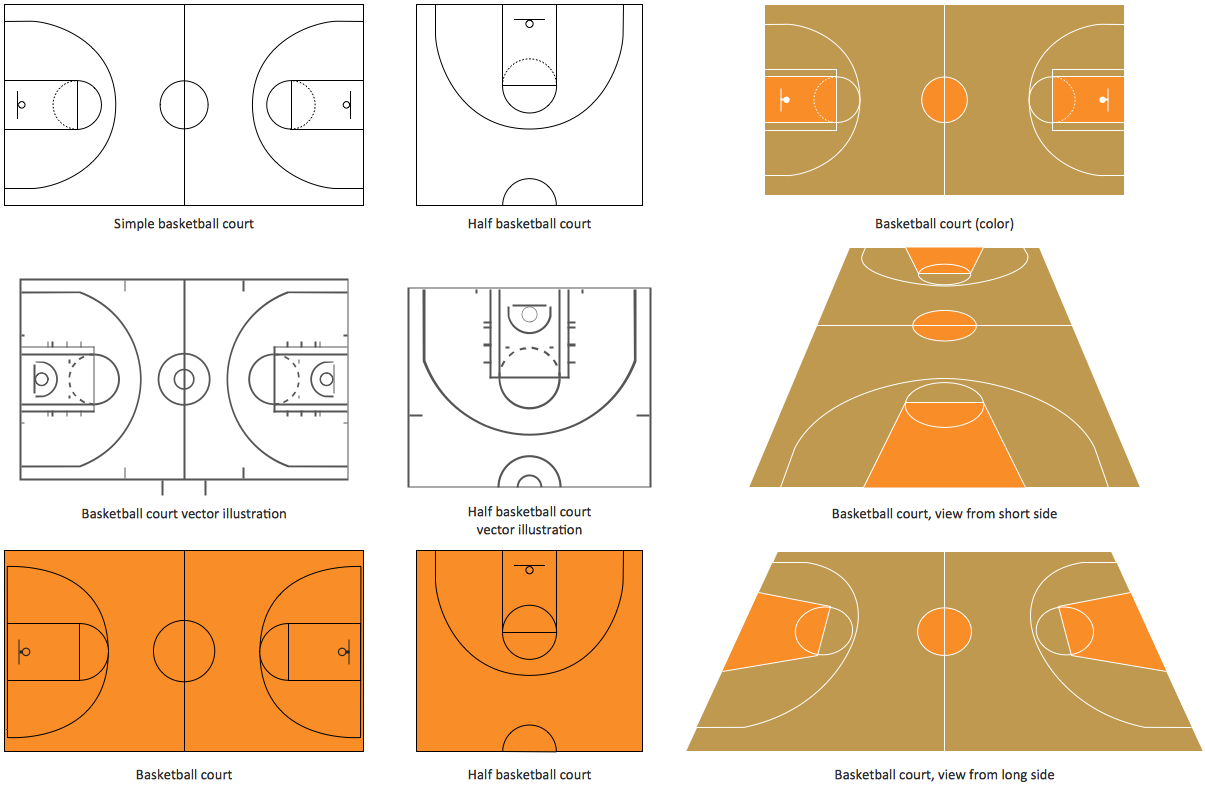
Basketball Court Diagram and Basketball Positions
The illustration of possible situations during the basketball matches, presentation of basketball positions and the best tactics, explanation of rules and training to successful game, become much more easier and time saving with visual illustrations and drawings. Creation of several illustrations and comparing them lets effectively show the differences and advantages in positions of players. ConceptDraw DIAGRAM software extended with Basketball solution from Sport area of ConceptDraw Solution Park provides the shapes' libraries with different kinds of basketball courts and basketball positions, templates and samples, which will render great help for basketball specialists and fans in drawing professional-looking and illustrative basketball-related diagrams and schematics of any complexity in a few minutes. Extensive export capabilities of ConceptDraw DIAGRAM to varied graphical formats open before you wide field for activities and possibility to easy communicate with large quantity of people, which have different software installed on their devices.HelpDesk
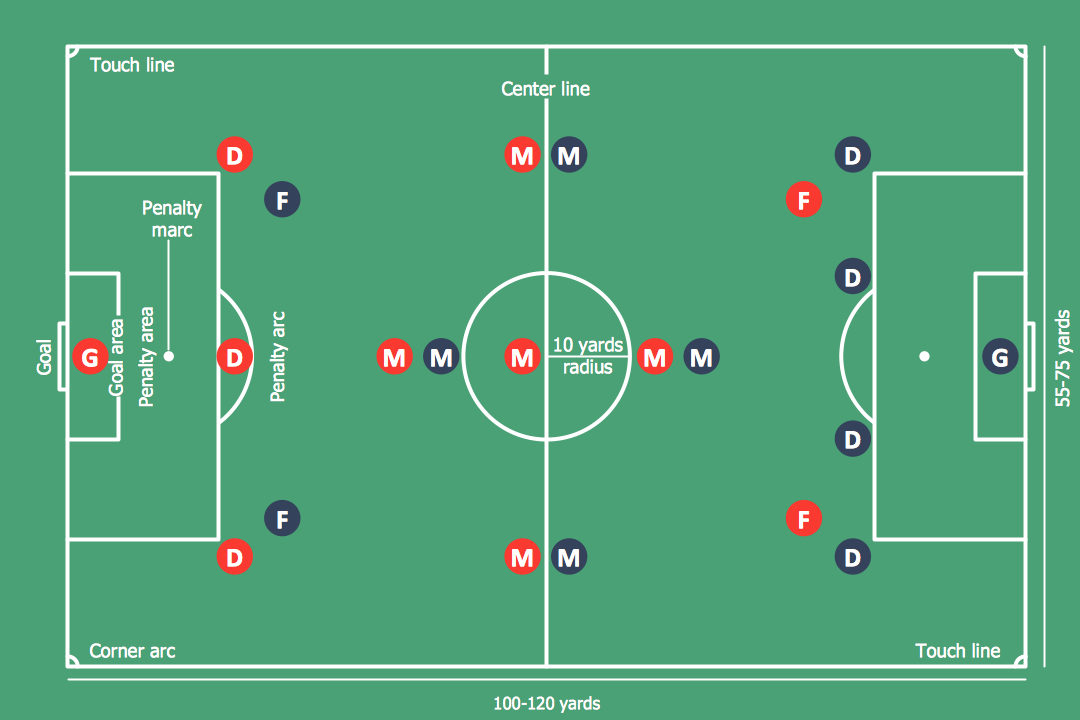
How to Make Soccer Position Diagram
The soccer field has the form of a large rectangle, covered with grass. Dimensions of soccer fields may vary slightly, depending on the level of the game, but all fields have some common characteristics. Soccer players may take different positions. Each soccer position has its own name and implies certain player functions. Every soccer position has a very specific name and task: Goalkeeper, Defenders, Midfielders and Forwards. During preparation for the game, coach met a challenge: how to explain each player's position and his role in the game. The difficulty is the fact that in the course of the game players will often move on the field and do not stay in one place. Football field diagram with dimensions and marking, and positions - it is an important tool for the coach. ConceptDraw DIAGRAM helps both coach and players to understand exactly their roles during the particular game. The ability to create Soccer diagrams is contained in the ConceptDraw Soccer solution. The solution providesCompetitor Analysis
Competitor analysis is a first and obligatory step in elaboration the proper corporate marketing strategy and creating sustainable competitive advantage. Use powerful opportunities of numerous solutions from ConceptDraw Solution Park for designing illustrative diagrams, charts, matrices which are necessary for effective competitor analysis."The Global Positioning System (GPS) is a space-based satellite navigation system that provides location and time information in all weather conditions, anywhere on or near the Earth where there is an unobstructed line of sight to four or more GPS satellites. The system provides critical capabilities to military, civil and commercial users around the world. It is maintained by the United States government and is freely accessible to anyone with a GPS receiver." [Global Positioning System. Wikipedia]
This GPS operation diagram example was created using the ConceptDraw PRO diagramming and vector drawing software extended with the Telecommunication Network Diagrams solution from the Computer and Networks area of ConceptDraw Solution Park.
This GPS operation diagram example was created using the ConceptDraw PRO diagramming and vector drawing software extended with the Telecommunication Network Diagrams solution from the Computer and Networks area of ConceptDraw Solution Park.
Swot Analysis Examples for Mac OSX
SWOT is an acronym of the words Strengts, Weaknesses, Opportunities and Тhreats. SWOT analysis is used to show the real situation and prospects of the company on the market, the internal environment of the company is reflected by S and W, and external by O and T. SWOT analysis is a quality tool for structuring available information, which is successfully used in the process of strategy planning, it helps analysts in formulation recommendations on the basis of collected information and data, structured in a form of SWOT Matrix. The SWOT analysis is effective and simple in use, however its results in great depend on the completeness and quality of initial information, from the depth of understanding of the current state and development trends of the market, and also from the used software. ConceptDraw DIAGRAM extended with powerful tools of SWOT and TOWS Matrix Diagrams solution, containing templates and SWOT analysis examples for Mac OSX and Windows, is ideal software for creation professional SWOT Matrices and SWOT Analysis Matrices.Ice Hockey Positions Diagram
ConceptDraw Ice Hockey Solution for ConceptDraw DIAGRAM delivers the "Ice Hockey Positions" library that contains predesigned objects for all ice hockey positions. A set of templates and samples demonstrates best practice of using this library.Matrices
ConceptDraw DIAGRAM extended with Matrices Solution from the Marketing Area of ConceptDraw Solution Park is a powerful software for drawing various types of Marketing Matrices: Ansoff Matrix, BCG Matrix, Deployment Chart, Feature Comparison Chart, Competitive Strategies Matrix, Flow Process Chart, Porter's Value Chain Diagram, Positioning Map, and many others.Marketing Analysis Diagram
An example of marketing analysis diagram, can be used to analyse product market and define marketing strategy. This types of charts used by small business project management for making presentations on market shares, it used by marketing project management software and project management tracking tools for reporting results and statuses.
 Marketing
This solution extends ConceptDraw DIAGRAM and ConceptDraw MINDMAP with Marketing Diagrams and Mind Maps (brainstorming, preparing and holding meetings and presentations, sales calls).
 Matrices
This solution extends ConceptDraw DIAGRAM software with samples, templates and library of design elements for drawing the business matrix diagrams.
Business Tools Perceptual Mapping
This sample shows the Perceptual map. It was created in ConceptDraw DIAGRAM diagramming and vector drawing software using the Matrices Solution from the Marketing area of ConceptDraw Solution Park. Perception Mapping helps organizations measure and transform all aspects of their business, people and culture. Perception Mapping allows to represent the complex relationships graphically, helps identify potential problems of the organization and make the best decisions.- Competitor Analysis | Positioning Map | Marketing Analysis Diagram ...
- Positioning Map | SWOT analysis positioning matrix - Template ...
- Product Positioning Diagram
- Brand Positioning Diagram
- Diagram Positioning Strategy Marketing
- Marketing | Target Market Positioning Diagram
- Positioning Map | SWOT analysis matrix diagram templates | Swot ...
- Positioning map | Competitor Analysis | Positioning Map | Market ...
- Positioning Map | SWOT analysis positioning matrix - Template ...
- Global Positioning System Simple Line Diagram
- Colored Baseball Field Diagram | Infield Positioning for Baseball ...
- Positioning map | SWOT analysis matrix diagram templates | What is ...
- Positioning Map Diagram
- Diagram On How To Product Position
- Competitor Analysis | Brand essence model - Wheel diagram ...
- Marketing | Positioning Map | How to Make Soccer Position Diagram ...
- Swot Analysis Examples for Mac OSX | Positioning map | SWOT ...
- Risk Positioning Diagram | SWOT Matrix Template | Diagram Of ...
- Ice Hockey Positions Diagram | Infield Positioning for Baseball ...


