PROBLEM ANALYSIS. Prioritization Matrix
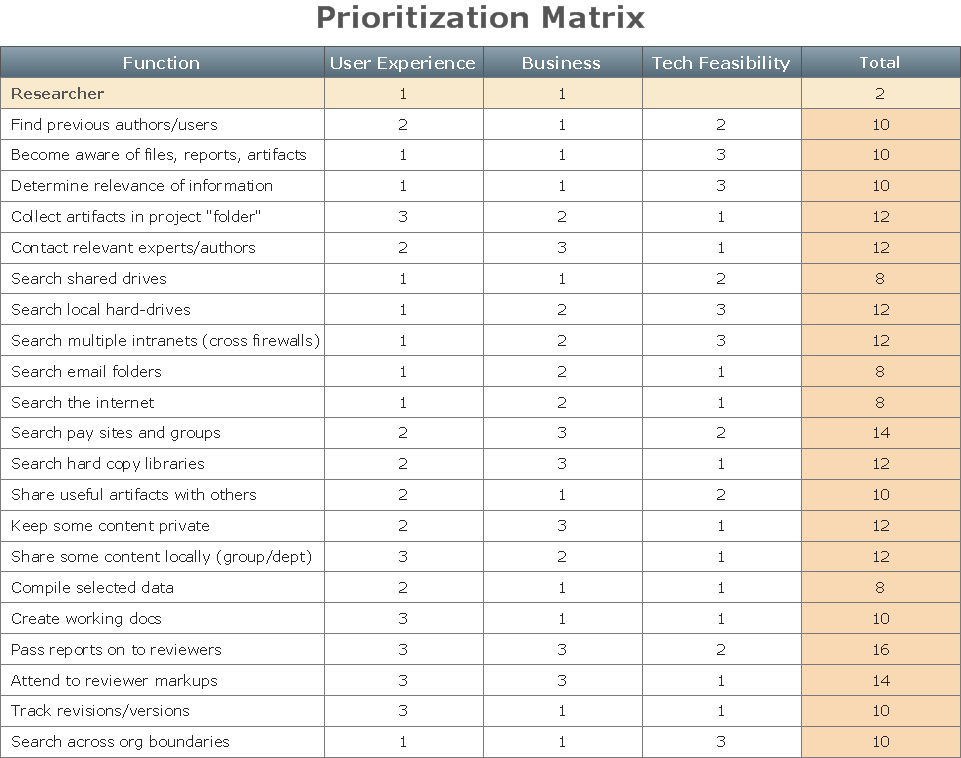
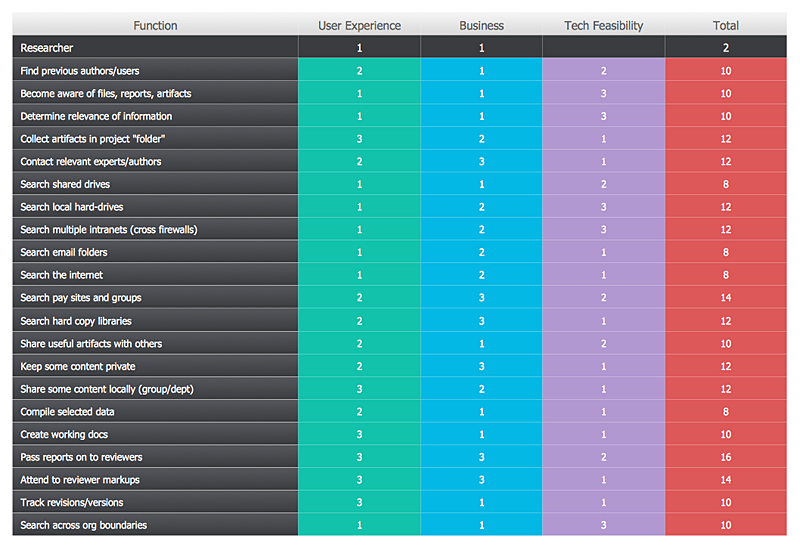
ConceptDraw Office suite is a software for Prioritization Matrix diagram making. This diagram ranks the drivers’ factors to determine priority. It identifies the factors of the first priority for analysis of possible corrective actions. It assesses the weight of each factor for each criterion and specifies it in the Prioritization Matrix. The total sum of weights for a factor’s criteria indicates its priority.
Corrective Action Planning
One of the stages of the problem's solving process scenario is Corrective Action Planning. Corrective action planning define people and groups involvement in corrective actions by roles, identify logical sequences of scheduled actions and critical path of problem solving, identify possible risks of action plan and propose preventive actions.
Prioritization Matrix
You can design the Prioritization Matrix by hand on the paper, but we offer you the most easier way - to use the ConceptDraw PRO diagramming and vector drawing software extended with Seven Management and Planning Tools Solution from the Management Area.
 Marketing
This solution extends ConceptDraw PRO v9 and ConceptDraw MINDMAP v7 with Marketing Diagrams and Mind Maps (brainstorming, preparing and holding meetings and presentations, sales calls).
 Seven Management and Planning Tools
Seven Management and Planning Tools solution extends ConceptDraw PRO and ConceptDraw MINDMAP with features, templates, samples and libraries of vector stencils for drawing management mind maps and diagrams.
HelpDesk
How to Manage Problem Solving Using Seven Management and Planning Tools
Stage by stage gouide on using visual tools to move toward solving the problem.
PROBLEM ANALYSIS. Root Cause Analysis Tree Diagram
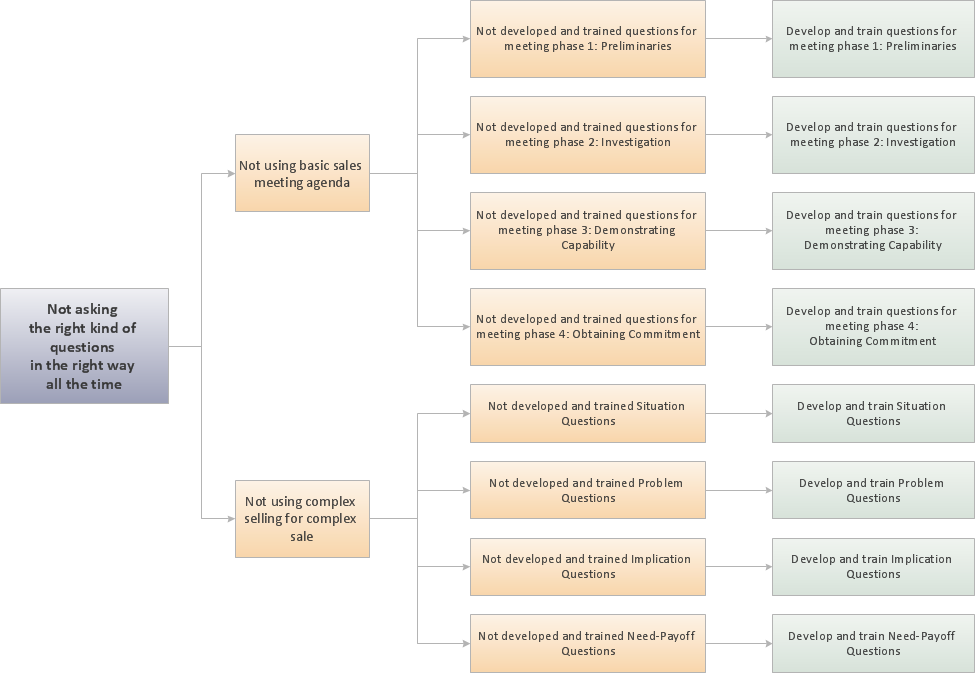
Root Cause Analysis Tree Diagram. Use the Root Cause Diagram to perform visual root cause analysis. Root Cause Analysis Tree Diagram is constructed separately for each highly prioritized factor. The goal of this is to find the root causes for the factor and list possible corrective action. ConceptDraw Office suite is a software for problem analysis.
HelpDesk
How To Create a Prioritization Matrix
Making the prioritization matrix is helpful when all cannot be done at the same time. Prioritization matrix diagram shows the relationships between factors and this helps , to prioritize tasks and resources. This helps you to narrow down variants. By selecting and weighing options you can quickly determine the best choices and direct team to the best destinations. Prioritization matrix helps to identify a best way of implementing the most priority tasks. It is helpful in a case when you have limited resources. ConceptDraw solution for management and planning compiled from the Seven Management and Planning Tools, provides the ability to quickly build Prioritization Matrix diagrams for your project using special template.CORRECTIVE ACTIONS PLANNING. Involvement Matrix
The Involvement Matrix can identify the distribution of responsibilities and identify roles in a group or team. Use the Involvement Matrix to specify roles and responsibilities of actions in problem solving. ConceptDraw Office suite is a software for corrective actions planning.
Cause and Effect Analysis
Cause and Effect Analysis - The Seven Management and Planning Tools is a tool for Cause and Effect Analysis that allows users to analyze the root causes for factors that influenced the problem. This diagram is constructed separately for each highly prioritized factor. The Diagram is then used for further formulation of potential actions.
Root Cause Analysis
The Seven Management and Planning Tools is a tool for Root Cause Analysis Tree Diagram drawing. This diagram is for Root Cause Analysis. Analyze the root causes for factors that influenced the problem. This diagram is constructed separately for each highly prioritized factor. The goal of this is to find the root causes for the factor and list possible corrective action.
The Action Plan
Action Plan - For the action planning define people and groups involvement in corrective actions by roles, identify logical sequences of scheduled actions and critical path of problem solving, identify possible risks of action plan and propose preventive actions. ConceptDraw Office suite is a software for decision making and action plan.
Decision Making
Decision Making - ConceptDraw Office suite provides visual tools that are given support on the stage of the decision making. The Seven Management and Planning Tools is a set for such diagrams: Affinity Diagram, Relations Diagram, Prioritization Matrix, Root Cause Tree Diagram, Involvement Matrix, PERT Chart, Risk Diagram (PDPC).
 Management Area
The solutions from Management area of ConceptDraw Solution Park collect templates, samples and libraries of vector stencils for drawing the management diagrams and mind maps.
PROBLEM ANALYSIS. Identify and Structure Factors
Identify and Structure Factors. Use the Affinity Diagram to collect and structure factors that impact on a problem. ConceptDraw Office suite is a software for identify and structure factors with affinity diagram. This is a grouping and structuring of factors that impact on a problem.
CORRECTIVE ACTIONS PLANNING. Risk Diagram (PDPC)
Risk Diagram (PDPC) - ConceptDraw Office suite is a software for Risks Diagram making. This diagram identifies possible risks in accomplishing corrective actions. With the Risks Diagram, one analyzes each action separately in a tree of all actions and develops a preventive action in response of each potential obstacles or circumstances which may be a risk.
Activity Network (PERT) Chart
Activity Network and Project Evaluation and Review Technique, or PERT, charts are a way of documenting and analyzing the tasks in a project. This diagram is constructed as part of the process in creating a schedule of corrective actions. The Activity Network Chart (PERT) shows the logical connections and consequence of tasks to be performed. It displays the time period for problem solving and the implementation of all activities through the critical path.- New business opportunity SWOT analysis matrix - Template portrait ...
- Seven Management and Planning Tools | PROBLEM ANALYSIS ...
- PROBLEM ANALYSIS Prioritization Matrix | Seven Management and ...
- PROBLEM ANALYSIS Prioritization Matrix | Seven Management and ...
- PROBLEM ANALYSIS. Prioritization Matrix | Prioritization matrix ...
- Corrective Action Planning | New business opportunity SWOT ...
- PROBLEM ANALYSIS. Prioritization Matrix | Authority Matrix ...
- PROBLEM ANALYSIS. Prioritization Matrix | Prioritization Matrix ...
- Matrices | Design elements - Prioritization matrix | Prioritization ...
- PROBLEM ANALYSIS Prioritization Matrix | PROBLEM ANALYSIS ...
- Authority Matrix Diagram Software | SWOT and TOWS Matrix ...
- Prioritization matrix - Health care problems | Seven Management ...
- Example Opportunity
- How To Create the Involvement Matrix | PROBLEM ANALYSIS ...
- PROBLEM ANALYSIS. Prioritization Matrix | PROBLEM ANALYSIS ...
- PROBLEM ANALYSIS Identify and Structure Factors | Seven ...
- Marketing | Mind Map Exchange | Sales Dashboard | Sales Plan
- Seven Management and Planning Tools | PROBLEM ANALYSIS ...
- SWOT Analysis | SWOT Analysis Software | Mac Tools - SWOT ...


