This site uses cookies. By continuing to browse the ConceptDraw site you are agreeing to our Use of Site Cookies.

SWOT Analysis matrix templates and samples

SWOT Analysis solution extends ConceptDraw MINDMAP and ConceptDraw DIAGRAM products with easy-to-use SWOT Analysis tools.

SWOT Analysis Solution - Strategy Tools

The condition and successful development of the company depends on how efficiently it is able to react on different outside influences. Analysis and interrelated consideration of external factors and the company's capabilities allow effectively solve appearing problems. One of the most common methods of evaluation together internal and external factors influencing the company's development is SWOT analysis elaborated for business and industry. It is a necessary element of researches and obligatory preliminary stage at the preparation of strategic and marketing plans of the company. Upon the results of SWOT analysis, we can assess does the company have the internal forces and resources to realize the existing opportunities and resist external threats, and what internal deficiencies require the prompt rectification. ConceptDraw DIAGRAM software enhanced with SWOT Analysis solution offers powerful drawing and strategy tools for effective execution the SWOT and TOWS analysis for your company with a goal of effectively realizing strategic planning and correct decision-making.

How to Create a Line Chart

Create a Line Chart with ConceptDraw using our tips. Here you can find an explanation of how to create a line chart quickly.

Porter's Value Chain

ConceptDraw DIAGRAM diagramming and vector drawing software offers you the Matrices Solution from the Marketing Area with extensive drawing tools for creating the Porter's Value Chain diagrams.

Ansoff Matrix

ConceptDraw DIAGRAM software extended with Matrices Solution from the Marketing Area of ConceptDraw Solution Park offers you the possibility to develop the Ansoff Matrix of any complexity.

Create Process Flowcharts

A process flowchart is a picture of the separate steps of a process in sequential order.Use ConceptDraw DIAGRAM software and the vector stencils from object libraries are designed objects you can use adding to process flowcharts for the best result.

Draw Flowcharts with ConceptDraw

Start design your own flowchart with ConceptDraw DIAGRAM and accomplish great results at the moment.

Mac Tools - SWOT Analysis

The SWOT analysis is a well-known method of the making a plan to identify and to evaluate the Strengths, Weaknesses, Opportunities, Threats that are involved in a project. The SWOT analysis involves obligatory specifying the objective of a project and identifying the internal and external causes allowing to accomplish the goals of a business or project. When making the analysis the decision makers should consider whether the objective is attainable. If not, the process is repeated and another objective can be selected. Among a lot of professional opportunities of ConceptDraw DIAGRAM diagramming and vector drawing software are also the Mac tools for holding the SWOT analysis and drawing the SWOT Analysis Diagrams and SWOT Matrices. The SWOT and TOWS Matrix Diagrams solution offered by the Management area at ConceptDraw Solution Park includes large variety of SWOT matrix samples and templates allowing the ConceptDraw DIAGRAM users to create own SWOT and TOWS diagrams fast and easy on both Mac and PC.

Feature Comparison Chart Software

An example of marketing analysis diagram, can be used to analyse product market and define marketing strategy. This sample shows the Feature Comparison Chart of the digital scouting cameras. It can be useful for digital cameras production field, marketing, sales, etc.

Swot Analysis Examples for Mac OSX

SWOT is an acronym of the words Strengts, Weaknesses, Opportunities and Тhreats. SWOT analysis is used to show the real situation and prospects of the company on the market, the internal environment of the company is reflected by S and W, and external by O and T. SWOT analysis is a quality tool for structuring available information, which is successfully used in the process of strategy planning, it helps analysts in formulation recommendations on the basis of collected information and data, structured in a form of SWOT Matrix. The SWOT analysis is effective and simple in use, however its results in great depend on the completeness and quality of initial information, from the depth of understanding of the current state and development trends of the market, and also from the used software. ConceptDraw DIAGRAM extended with powerful tools of SWOT and TOWS Matrix Diagrams solution, containing templates and SWOT analysis examples for Mac OSX and Windows, is ideal software for creation professional SWOT Matrices and SWOT Analysis Matrices.
"Product life cycle is a business analysis that attempts to identify a set of common stages in the life of commercial products. In other words the 'Product Life cycle' PLC is used to map the lifespan of the product such as the stages through which a product goes during its lifespan. ...
The stages of a product's life cycle... :
1. INTRODUCTION... 2. GROWTH... 3. MATURITY... 4. DECLINE...
The product life cycle is an important concept in marketing. It includes four stages that a product goes through from when it was first thought of until it is eliminated from the industry. Not all products reach this final stage. Some continue to grow and others rise and fall." [Product lifecycle. Wikipedia]
The flow chart example "Product life cycle process" was created using the ConceptDraw PRO diagramming and vector drawing software extended with the Flowcharts solution from the area "What is a Diagram" of ConceptDraw Solution Park.
Flowchart - Product life cycle process
Flowchart - Product life cycle process, terminator, process, group, document, decision,
Used Solutions

business process flow diagrams, business process diagram example, business process diagram, process diagrams Business Process Diagrams

business process flow diagrams, business process diagram example, business process diagram, process diagrams
Business Process Flow Diagrams solution extends the ConceptDraw DIAGRAM BPM software with RapidDraw interface, templates, business process diagrams examples and numerous libraries based on the BPMN 1.2 and BPMN 2.0 standards, which give you the possibility to visualize equally easy simple and complex processes, design business models, quickly develop and document in details any business processes on the stages of project’s planning and implementation.

logistics flow charts, logistics planning, logistics and supply chain, logistics management software, inventory flow chart Logistics Flow Charts

logistics flow charts, logistics planning, logistics and supply chain, logistics management software, inventory flow chart
Logistics Flow Charts solution extends ConceptDraw DIAGRAM functionality with opportunities of powerful logistics management software. It provides large collection of predesigned vector logistic symbols, pictograms, objects and clipart to help you design with pleasure Logistics flow chart, Logistics process flow diagram, Inventory flow chart, Warehouse flowchart, Warehouse management flow chart, Inventory control flowchart, or any other Logistics diagram. Use this solution for logistics planning, to reflect logistics activities and processes of an enterprise or firm, to depict the company's supply chains, to demonstrate the ways of enhancing the economic stability on the market, to realize logistics reforms and effective products' promotion.

process flow diagram, process flow chart Process Flowcharts

process flow diagram, process flow chart
This solution extends ConceptDraw DIAGRAM software with templates, samples, and library of vector shapes for drawing the Process Flowcharts.

What is SWOT Analysis in Marketing

What is SWOT analysis in marketing? SWOT analysis gives for analysts, marketing specialists and other professionals the perfect ability to identify the positives and negatives in an organization, as well as in the external environment. The SWOT and TOWS methods were developed for business and industry, they involve the specifying of a project's objective and identifying internal and external causes for accomplishing the project goals. A full awareness about the situation within and around your business can help effectively with both strategic planning and decision-making. ConceptDraw DIAGRAM and ConceptDraw MINDMAP software allow professionals to make the situation analysis, to develop strategies and plans for achievement defined objectives, to suppose the possible scenarios of further activity, to see the whole situation at a glance, to create well-designed SWOT and TOWS matrices in minutes. The SWOT and TOWS Matrix Diagrams solution from ConceptDraw Solution Park includes the SWOT matrix samples and templates that allow users quickly create their own SWOT and TOWS diagrams.

Flowchart of Products
Flowchart Examples

This sample shows the Flowchart of the Sustainment and Disposal. A Flowchart is a graphically representation of the process that step-by-step lead to the solution the problem. The geometric figures on the Flowchart represent the steps of the process and are connected with arrows that show the sequence of the actions. The Flowcharts are widely used in engineering, architecture, science, analytics, government, politics, business, marketing, manufacturing, administration, etc.

Purchasing Flowchart - Purchase Order
Flowchart Examples

Create your own flow charts of purchasing business processes using the ConceptDraw DIAGRAM diagramming and vector drawing software extended with the Accounting Flowcharts solution from the Finance and Accounting area of ConceptDraw Solution Park. The flow chart example shows the steps of purchasing business process.

sales process map, sales process flowchart, sales steps, sales process management Sales Flowcharts

sales process map, sales process flowchart, sales steps, sales process management
The Sales Flowcharts solution lets you create and display sales process maps, sales process workflows, sales steps, the sales process, and anything else involving sales process management.

Create Process Flowcharts

A process flowchart is a picture of the separate steps of a process in sequential order.Use ConceptDraw DIAGRAM software and the vector stencils from object libraries are designed objects you can use adding to process flowcharts for the best result.
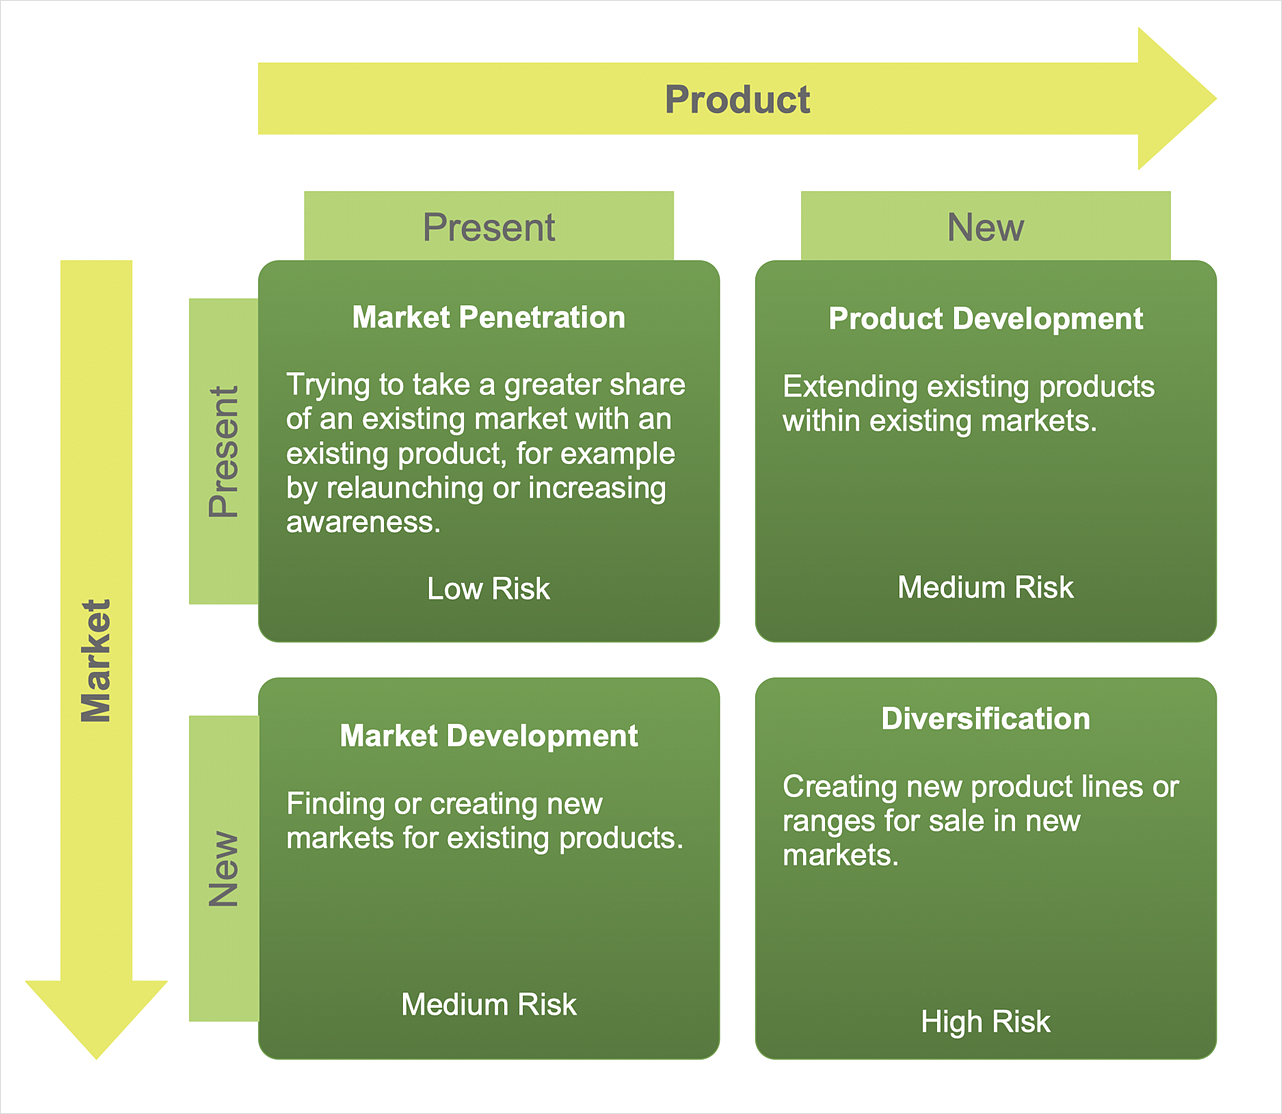
Diversification is a corporate strategy to increase sales volume from new products and new markets. Diversification can be expanding into a new segment of an industry that the business is already in, or investing in a promising business outside of the scope of the existing business.
Diversification is part of the four main growth strategies defined by Igor Ansoff's Product/ Market matrix.
Ansoff pointed out that a diversification strategy stands apart from the other three strategies. The first three strategies are usually pursued with the same technical, financial, and merchandising resources used for the original product line, whereas diversification usually requires a company to acquire new skills, new techniques and new facilities. [Diversification (marketing strategy). Wikipedia]
This Ansoff's Product/ Market matrix example was created using ConceptDraw PRO diagramming and vector drawing software extended with Matrices solution from Marketing area of ConceptDraw Solution Park.
Ansoff matrix
Ansoff matrix, Ansoff matrix,
Used Solutions