This SWOT analysis matrix template helps you in positioning of SWOT factors as bubbles on bubble chart by size/ scale (X axis) and relevance/ importance (Y axis). The diameter of bubbles shows strategic impact of SWOT factors.
The template "SWOT analysis positioning matrix" for the ConceptDraw PRO diagramming and vector drawing software is included in the SWOT Analysis solution from the Management area of ConceptDraw Solution Park.
The template "SWOT analysis positioning matrix" for the ConceptDraw PRO diagramming and vector drawing software is included in the SWOT Analysis solution from the Management area of ConceptDraw Solution Park.
In marketing perceptual or positioning maps are used for developing the market positioning strategy for product or service.
"Perceptual mapping is a diagrammatic technique used by asset marketers that attempts to visually display the perceptions of customers or potential customers. Typically the position of a product, product line, brand, or company is displayed relative to their competition." [Perceptual mapping. Wikipedia]
This positioning map diagram example was created using the ConceptDraw PRO diagramming and vector drawing software extended with the Matrices solution from the Marketing area of ConceptDraw Solution Park.
 Matrices
This solution extends ConceptDraw PRO software with samples, templates and library of design elements for drawing the business matrix diagrams.
 Telecommunication Network Diagrams
Telecommunication Network Diagrams solution extends ConceptDraw PRO software with samples, templates, and great collection of vector stencils to help the specialists in a field of networks and telecommunications, as well as other users to create Computer systems networking and Telecommunication network diagrams for various fields, to organize the work of call centers, to design the GPRS networks and GPS navigational systems, mobile, satellite and hybrid communication networks, to construct the mobile TV networks and wireless broadband networks.
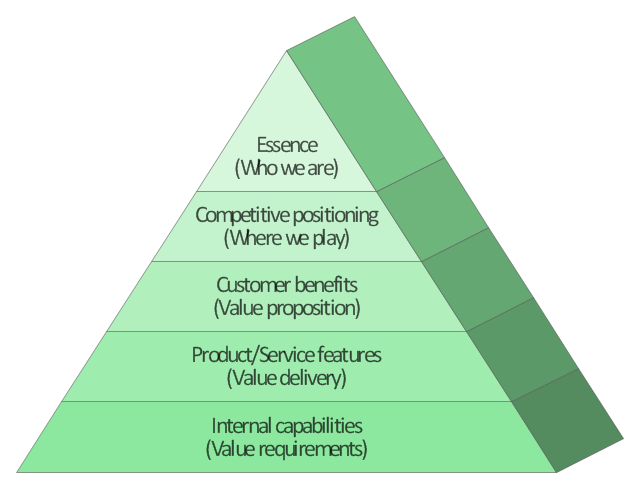
This market value pyramid diagram has 5 levels:
1) Essence (Who we are),
2) Competitive positioning (Where we play),
3) Customer benefits (Value proposition),
4) Product / Service features (Value delivery),
5) Internal capabilitiea (Value requirements).
Use this triangular scheme to develop your marketing strategy.
"Market value or OMV (Open Market Valuation) is the price at which an asset would trade in a competitive auction setting. Market value is often used interchangeably with open market value, fair value or fair market value, although these terms have distinct definitions in different standards, and may differ in some circumstances." [Market value. Wikipedia]
The triangle chart example "Market value" was created using the ConceptDraw PRO diagramming and vector drawing software extended with the Pyramid Diagrams solution from the Marketing area of ConceptDraw Solution Park.
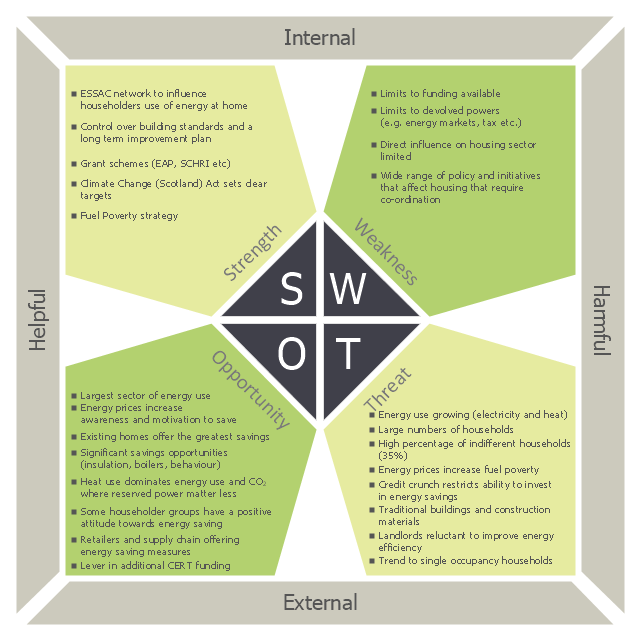
This sample was created on the base of the SWOT matrix illustrating the webpage "SWOT Analysis" of "Scottish Energy Study Volume 4: Issues, Opportunities and Barriers" from the website of the Scottish Government. [scotland.gov.uk/ Publications/ 2009/ 09/ 24094712/ 6]
The diagram example "Domestic sector SWOT" was created using the ConceptDraw PRO diagramming and vector drawing software extended with the SWOT Analysis solution from the Management area of ConceptDraw Solution Park.
The diagram example "Domestic sector SWOT" was created using the ConceptDraw PRO diagramming and vector drawing software extended with the SWOT Analysis solution from the Management area of ConceptDraw Solution Park.
 Sport Field Plans
Construction of sport complex, playgrounds, sport school, sport grounds and fields assumes creation clear plans, layouts, or sketches. In many cases you need represent on the plan multitude of details, including dimensions, placement of bleachers, lighting, considering important sport aspects and other special things.
- Positioning map (Perceptual map) | Ansoff product market ...
- Positioning map (Perceptual map) | SWOT Analysis Solution ...
- Positioning map (Perceptual map) | Swot Analysis Examples for Mac ...
- Ansoff product market - positioning matrix | SWOT Analysis Solution ...
- Ansoff's Product/ Market matrix | Ansoff product market - positioning
- Ansoff product / market growth matrix - Positioning matrix | SWOT ...
- Positioning map (Perceptual map) | Swot Analysis Examples for Mac ...
- Pyramid Chart Examples | Positioning map (Perceptual map) |
- Swot Analysis Examples for Mac OSX | SWOT analysis matrix ...
- Ansoff's Product / Market matrix | SWOT analysis matrix diagram ...
- Pyramid Chart Examples | MindTweet | Positioning map (Perceptual ...
- Positioning map (Perceptual map) | SWOT Analysis Solution ...
- SWOT Analysis Solution - Strategy Tools | Matrices | Pyramid Chart ...
- SWOT Analysis Solution - Strategy Tools | Swot Analysis Examples ...
- Ansoff product / market growth matrix - Positioning matrix | Ansoff ...
- Ansoff Product - Market Growth Matrix template
- Ansoff Product - Market Growth Matrix template | Ansoff product ...
- Ansoff Product - Market Growth Matrix template | Boston growth-share ...
- Swot Analysis Examples
- Positioning map (Perceptual map) | Service 8 Ps fishbone diagram ...


