HelpDesk
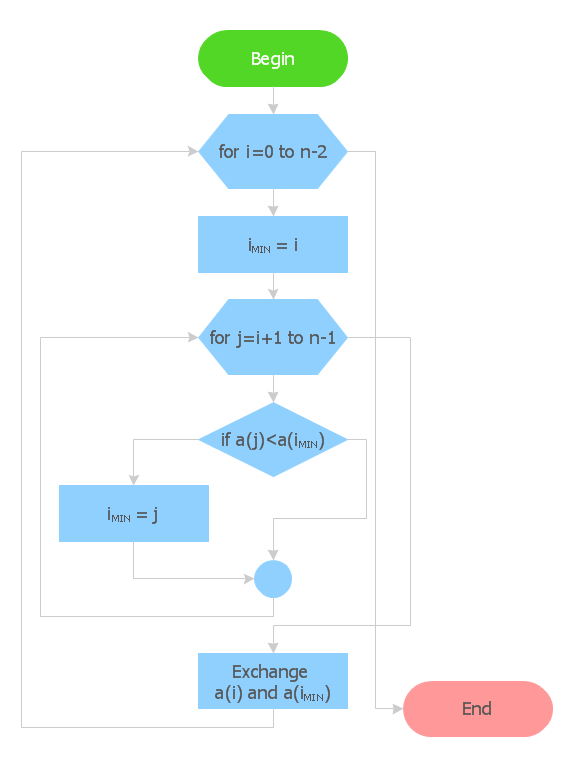
How to Create Flowchart Using Standard Flowchart Symbols
Flowcharts are used to display an algorithm for consistent execution of certain steps. Flowchart is probably the easiest way to make a graphical representation of any process. Flowcharts use the set of standard geometric symbols and arrows to define relationships. ConceptDraw PRO allows you to create professional flowchart quickly and easily. The ability to create flowcharts is contained in the Flowcharts solution. The solution provides a set of special tools for creating flowcharts.HelpDesk
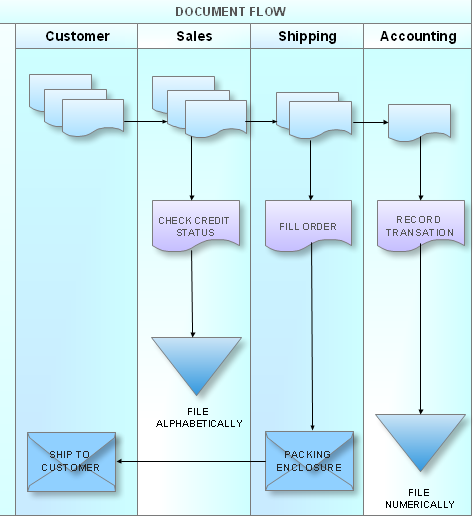
How to Create a Cross - Functional Flowchart Using ConceptDraw PRO
Cross-functional flowcharts are used to visualize cross-functional processes. Cross-functional process is a process that involves multiple divisions, each of which makes its part of the entire company workflow. For example: product development, lead management , client orders processing – and other critical processes. All of them are important both for business and customers, but the workflow and responsibilities distribution within these processes are divided between multiple departments and services. Cross-functional processes cannot be depicted with simple workflow diagrams, because of the specific interactions between company departments. ConceptDraw PRO has released the specialized solution to create cross-functional diagrams. Cross Functional Flowcharts solution includes a special set of templates and libraries to depict the cross-functional processes.
HelpDesk
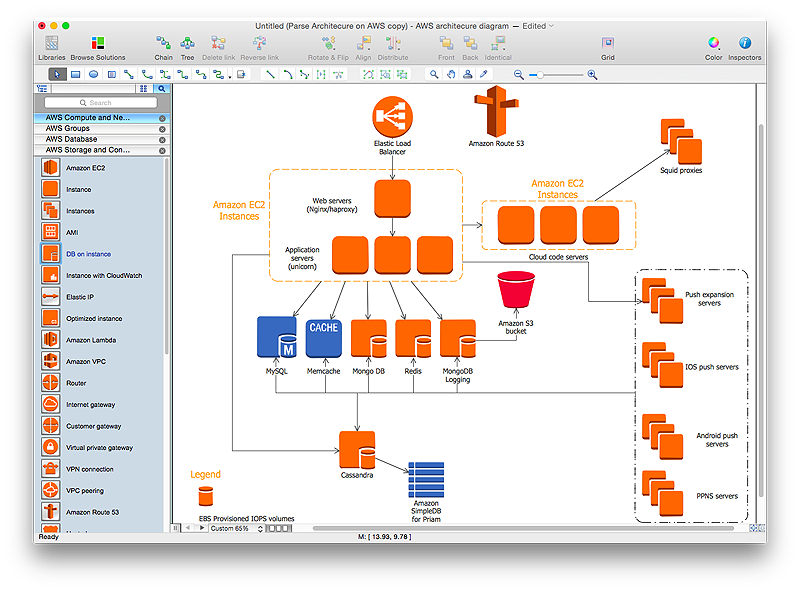
How to Create an AWS Architecture Diagram
Displaying an Amazon Web Service (AWS) cloud actually requires large amounts of attention to detail. Every element of technology has to be addressed: software, middle ware, transaction processing, scaling, data storage; the complete list is staggering. Using the ConceptDraw AWS Architecture Diagrams solution makes much easier the work on documenting the Amazon Web Service architecture. The ConceptDraw AWS Architecture Diagrams solution includes icons, sample and templates for some Amazon Web Services products and resources, to be used when buiding architecture diagrams. The icons are simple so that user can easily incorporate them in his drawings. AWS Architecture Diagrams can be used in presentations, datasheets, or any other technical visualizations.
 Flowcharts
The Flowcharts Solution for ConceptDraw PRO v10 is a comprehensive set of examples and samples in several different color themes for professionals that need to graphically represent a process. Solution value is added by basic flow chart template and shapes' library of Flowchart notation. ConceptDraw PRO flow chart creator lets one depict a processes of any complexity and length, as well design of the flowchart either vertically or horizontally.
HelpDesk
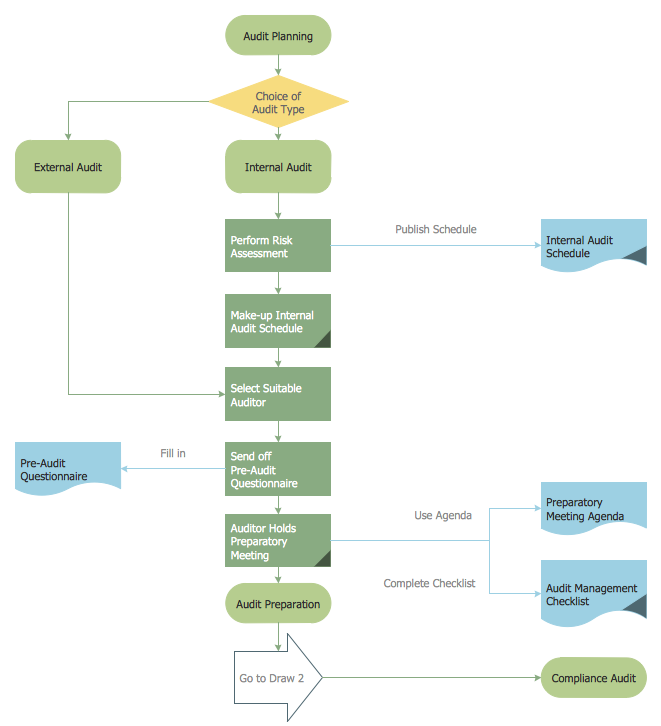
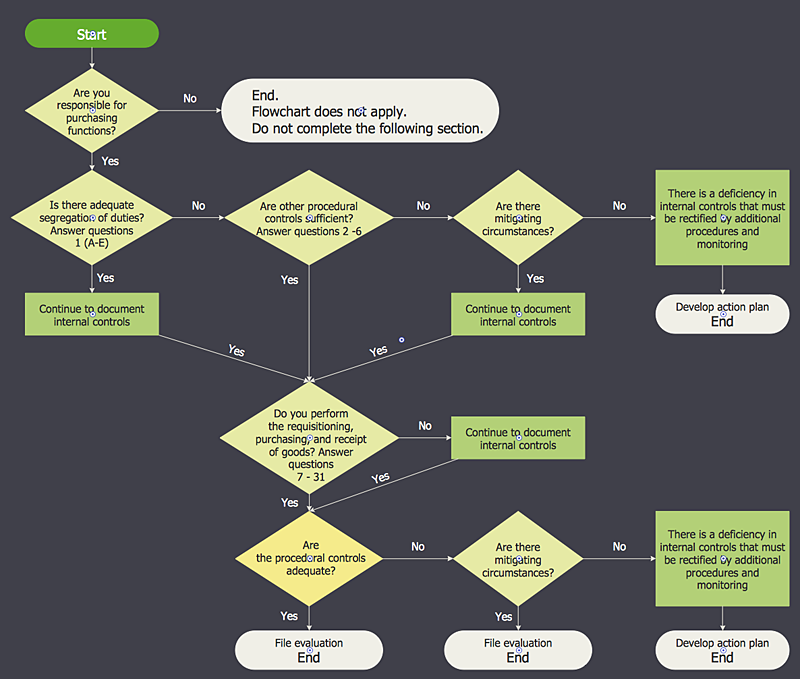
How to Create an Audit Flowchart Using ConceptDraw PRO
Audit flowcharts are often used in auditors activity. This is the most effective way of preparation and documentation of the audit process. Financial audit process has a clear structure, and therefore audit flowchart is often used to denote an audit process. This is the most effective way of preparation and documentation of the audit process. Flowcharts are often used in auditors activity. A flowchart may be created at any stage of an audit process as an aid in the determination and evaluation of a client's accounting system. ConceptDraw PRO allows you to create professional accounting flowchart quickly using the professional Audit Flowcharts solution.HelpDesk
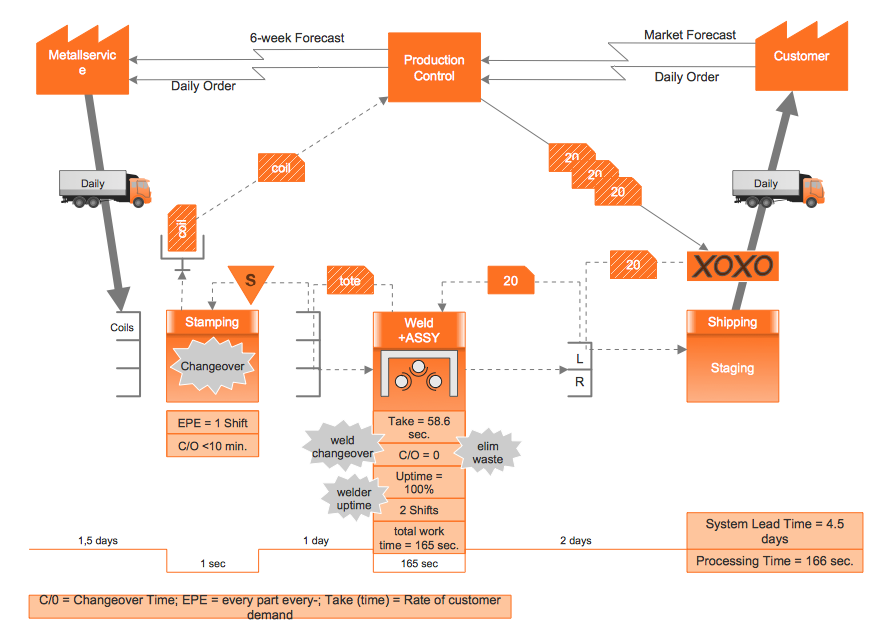
How to Create a VSM Diagram Using ConceptDraw Value Stream Mapping Solution
Value Stream Mapping is a Lean Manufacturing tool that uses a flow diagram to document in great detail every step of a manufacturing process. This graphical representation of a process is a powerful tool that helps in the diagnosis of process efficiency and allows companies to develop improved processes. Many lean practitioners use Value Stream Mapping as a fundamental tool to identify waste, cut process cycle times, and implement process improvement. Many organizations use value stream mapping as a key portion of their lean efforts. Value Stream Maps are used to analyze and design the flow of materials and information required to bring a product or service to a consumer. You can create a Value Stream Mapping flowchart using ConceptDraw PRO tools.
 HR Flowcharts
Human resource management diagrams show recruitment models, the hiring process and human resource development of human resources.
The vector stencils library "Sales symbols" contains 55 sales process pictograms.
Use it to design your sales flowcharts, workflow diagrams and process charts by the ConceptDraw PRO diagramming and vector drawing software.
"A sales process is an approach to selling a product or service.
... a "sales process" is presented as consisting of eight steps. These are:
(1) Prospecting / initial contact,
(2) Preapproach - planning the sale,
(3) Identifying and cross questioning,
(4) Need assessment,
(5) Presentation,
(6) Meeting objections,
(7) Gaining commitment,
(8) Follow-up." [Sales process. Wikipedia]
The icons example "Design elements - Sales symbols" is included in the Sales Flowcharts solution from the Marketing area of ConceptDraw Solution Park.
HelpDesk
How to Create an Accounting Flowchart Using ConceptDraw Solution Park
An Accounting flowchart is a specialized type of flowchart. With the help of an accounting flowchart you can visually describe tasks, documents, people responsible for execution at each stage of accounting workflow. Find out how you can easily create an accounting flowchart of any complexity using Accounting Flowchart Solution from the ConceptDraw Solution Park.- Basic Flowchart Symbols and Meaning | Flowchart design ...
- Types of Flowcharts | Basic Flowchart Symbols | Value stream with ...
- Invoice payment process - Flowchart | Accounting Flowchart ...
- Flowchart Software | Process Flowchart | Basic Flowchart Symbols ...
- Sales Process Flowchart . Flowchart Examples | Sales Process Steps ...
- Process Flowchart | Flow process chart | Flow chart Example ...
- Basic Flowchart Symbols and Meaning | Design elements - Cisco ...
- Process Flowchart | Basic Flowchart Symbols and Meaning | Flow ...
- Work Order Process Flowchart . Business Process Mapping ...
- Process Flowchart | Process Flow app for Mac | Basic Flowchart ...
- Basic Flowchart Symbols and Meaning | Process Flow Chart ...
- Copying Service Process Flowchart . Flowchart Examples | Flow ...
- Taxi service order procedure - BPMN 1.2 diagram | Basic Flowchart ...
- Process Flowchart | Sales Process Flowchart . Flowchart Examples ...
- Invoice payment process - Flowchart | Global Payment Solutions ...
- Process Flowchart | Basic Flowchart Symbols and Meaning ...
- Flowchart of Products . Flowchart Examples | Basic Flowchart ...
- New Product Development Process Flowchart Sample
- Cross-Functional Flowchart | Process Flowchart | Cross-Functional ...
