HelpDesk
How to Create a Sales Flowchart
A Sales flowchart is a specialized type of flowchart. With the help of a sales flowchart, you can visually describe tasks, documents, people responsible for execution at each stage of the sales process. For most commercial organizations, the sales process is inherent to its existence and ability to create profit. Although each company will achieve this aim in its own way, the core selling process remains similar throughout — a potential buyer or prospective customer exchanges money with an organization in return for goods or services. Despite this rather simplistic definition, there exists a huge scope as to which approach is taken. Indeed, it is not uncommon for the sales division to be the largest within a corporate structure, employing a team of salespeople, analysts, and the sales managers, who are in charge of sales division operations. The practical applications of sales process flowcharts are numerous and wide-ranging. At sales level, you might map the process of customer interact Flowchart of Products Flowchart Examples
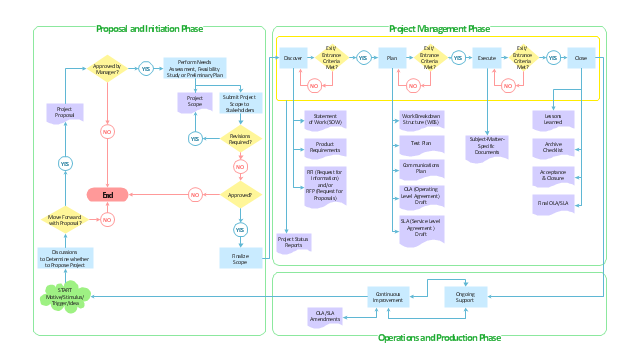
This sample shows the Flowchart of the Sustainment and Disposal.
A Flowchart is a graphically representation of the process that step-by-step lead to the solution the problem. The geometric figures on the Flowchart represent the steps of the process and are connected with arrows that show the sequence of the actions. The Flowcharts are widely used in engineering, architecture, science, analytics, government, politics, business, marketing, manufacturing, administration, etc.
Sales Process FlowchartFlowchart Examples
Sales Process Flowchart is an invaluable tool for business. It gives you opportunity to visualise and better understand the sales process, reveal and also visually highlight issues or bottlenecks, and predict the number of sales. The Flowchart is ideal method to represent in details all steps of the process, tasks and decisions needed to obtain maximum effectiveness and success. The steps are graphically represented by boxes linked with arrows indicating direction of the workflow, decision is shown by diamond. The sales process is closely linked to the company's success and usually includes the following main steps: Product knowledge, Prospecting, Planning the sale (Pre-approach), Approach, Need assessment, Presentation, Meeting objections, Gaining commitment, Follow-up.
Create fast and easy your own Flowcharts of sales business processes using the ConceptDraw DIAGRAM ector graphic software extended with Cross-Functional Flowcharts solution from Business Processes area and also Sales Flowcharts solution from Marketing area of ConceptDraw Solution Park.
Good Flow Chart app for Mac
The ConceptDraw DIAGRAM is a good flow chart app for Mac. Numerous vector stencils, samples and templates created by designers allows you to draw any type of flowchart.Accounting Flowchart Purchasing Receiving Payable and Payment
Accounting flowchart is a pictorial way to represent the flow of data in an organization and the flow of transactions process in a specific area of its accounting or financial department. Accounting Flowcharts solution contains the full set of standardized accounting flowchart symbols which will help you design in minutes various types of Accounting Flowcharts including such popular diagrams which represent the whole accounting process: Purchasing Flowchart, Receiving Flowchart, Voucher Payable Flowchart, Treasurer Flowchart, Payment Flowchart."Product life cycle is a business analysis that attempts to identify a set of common stages in the life of commercial products. In other words the 'Product Life cycle' PLC is used to map the lifespan of the product such as the stages through which a product goes during its lifespan. ...
The stages of a product's life cycle... :
1. INTRODUCTION... 2. GROWTH... 3. MATURITY... 4. DECLINE...
The product life cycle is an important concept in marketing. It includes four stages that a product goes through from when it was first thought of until it is eliminated from the industry. Not all products reach this final stage. Some continue to grow and others rise and fall." [Product lifecycle. Wikipedia]
The flow chart example "Product life cycle process" was created using the ConceptDraw PRO diagramming and vector drawing software extended with the Flowcharts solution from the area "What is a Diagram" of ConceptDraw Solution Park.
Sales Flowcharts
The Sales Flowcharts solution lets you create and display sales process maps, sales process workflows, sales steps, the sales process, and anything else involving sales process management.
HelpDesk
How to Create a Cross-Functional Flowchart Using ConceptDraw Solution
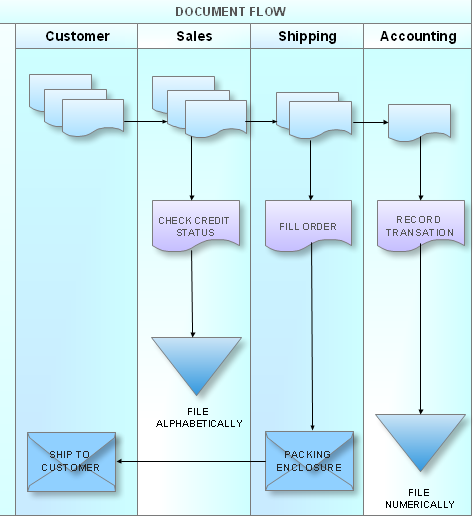
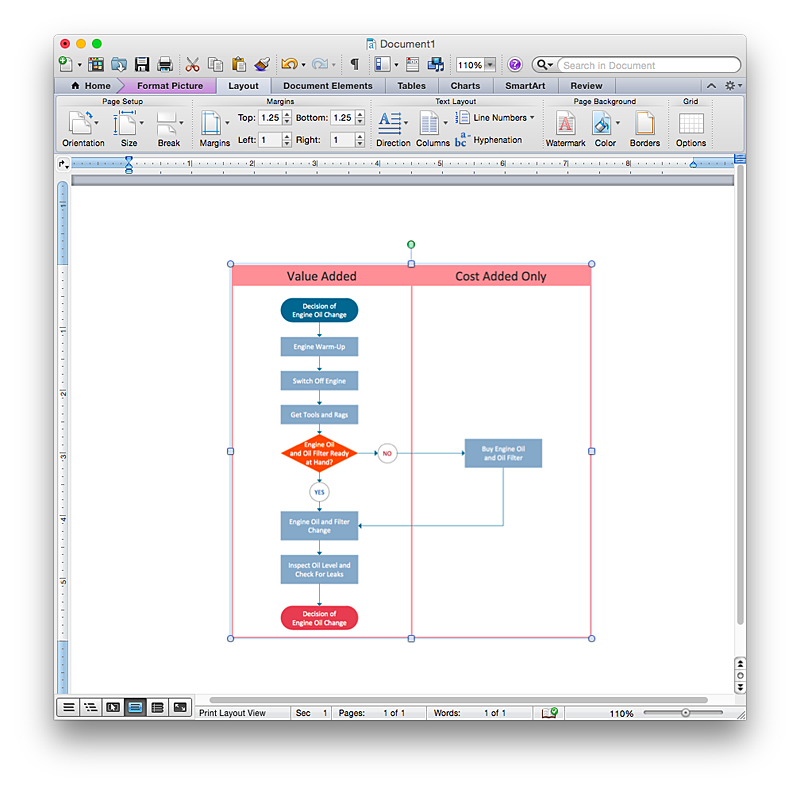
A cross-functional process is a process that involves multiple divisions, each of which makes its part of the entire company workflow. For example product development, lead management, client orders processing – and other critical processes. Using a Cross-Functional flowchart is a clear way of showing each team member’s responsibilities and how processes get shared or transferred between different teams and departments. The Cross-Functional flowchart is a clear way to visualize the document flow in your organization. The ability to create Cross-functional diagrams is provided by the Cross-Functional Flowcharts solution.Draw Flowcharts with ConceptDraw
Start design your own flowchart with ConceptDraw DIAGRAM and accomplish great results at the moment.Copying Service Process Flowchart. Flowchart Examples
This sample was created in ConceptDraw DIAGRAM diagramming and vector drawing software using the Flowcharts solution from the Diagrams area of ConceptDraw Solution Park. This sample shows the Flowchart on that it is displayed the process of the determination the permissibility according the Access Copyright license. The diamonds represent the decision points. Inside the diamonds are the questions that need the answer yes/no. It is necessary to answer on the question, make the decision that will determine the next step.Sales Process Flowchart Symbols
The most easier way of creating the visually engaging and informative Sales Process Flowchart is to create the new ConceptDraw document and to use the predesigned vector symbols offered in 6 libraries of the Sales Flowchart Solution. There are more than six types of sales process flow diagrams, ConceptDraw DIAGRAM software is flowchart maker which include six collections of extended flowchart symbols for effective diagramming. There are main collections of color coded flowchart symbols: Sales Department, Sales Steps, Sales Workflow, Sales Symbols and special set of Sales Arrows and Sales Flowchart.HelpDesk
How to Create a Cross-Functional Flowchart
Cross-functional flowcharts are used to visualize cross-functional processes. A cross-functional process is a process that involves multiple divisions, each of which makes its part of the entire company workflow. For example product development, lead management, client orders processing – and other critical processes. All of them are important both for business and customers, but the workflow and responsibilities distribution within these processes are divided between multiple departments and services. Cross-functional processes cannot be depicted with simple workflow diagrams, because of the specific interactions between company departments. ConceptDraw DIAGRAM has released a specialized solution to create cross-functional diagrams. Cross-Functional Flowcharts solution includes a special set of templates and libraries to depict the cross-functional processes.Flowchart Examples and Templates
ConceptDraw DIAGRAM ector diagramming software and ConceptDraw Solution Park provide a wide variety of diagrams, organizational charts, business charts and flowchart examples, templates and samples. You are free to choose any example or template you are interested in from the ConceptDraw STORE, then use it to simplify your work at the designing professional-looking flowcharts and diagrams. As for flowcharts, turn your attention for the Flowcharts solution from the "Diagrams" area of ConceptDraw Solution Park, Process Flowcharts and Cross-Functional Flowcharts solutions from the Business Processes area, Accounting Flowcharts and Audit Flowcharts solutions from the Finance and Accounting area, which are completely devoted to flowcharts creation and provide an enormous collection of helpful flowchart templates and samples. Each of them is specially developed, well thought-out, dedicated to a certain thematic and carries a specific purpose. You need only to determine with your needs and to decide which one corresponds them the best and suits for you.Accounting Flowchart: Purchasing, Receiving, Payable and Payment
Accounting flowchart is a system of processes to represent accounting system of an organization. How to create flowcharts for an accounting information system. Use ConceptDraw DIAGRAM with Accounting Flowcharts solution to document and communicate visually how accounting processes work, and how each operation is done.The vector stencils library "Sales flowchart" contains 62 sales process flow chart symbols.
Use these flow chart icon set to draw your sales flowcharts, workflow diagrams and process charts with the ConceptDraw PRO diagramming and vector drawing software.
The sales process flowchart symbols library "Sales flowchart" is included in the Sales Flowcharts solution from the Marketing area of ConceptDraw Solution Park.
Types of Welding in Flowchart
This sample was created in ConceptDraw DIAGRAM diagramming and vector drawing software using the Flowcharts solution from the Diagrams area of ConceptDraw Solution Park. This sample shows the Flowchart that displays the solid-state welding processes, the types of welding."An invoice, bill or tab is a commercial document issued by a seller to a buyer, relating to a sale transaction and indicating the products, quantities, and agreed prices for products or services the seller has provided the buyer.
Payment terms are usually stated on the invoice. These may specify that the buyer has a maximum number of days in which to pay, and is sometimes offered a discount if paid before the due date. The buyer could have already paid for the products or services listed on the invoice.
In the rental industry, an invoice must include a specific reference to the duration of the time being billed, so in addition to quantity, price and discount the invoicing amount is also based on duration. Generally each line of a rental invoice will refer to the actual hours, days, weeks, months, etc., being billed.
From the point of view of a seller, an invoice is a sales invoice. From the point of view of a buyer, an invoice is a purchase invoice. The document indicates the buyer and seller, but the term invoice indicates money is owed or owing. ...
Payment of invoices.
Organizations purchasing goods and services usually have a process in place for approving payment of invoices based on an employee's confirmation that the goods or services have been received.
Typically, when paying an invoice, a remittance advice will be sent to the supplier to inform them their invoice has been paid." [Invoice. Wikipedia]
The flow chart example "Invoice payment process" was created using the ConceptDraw PRO diagramming and vector drawing software extended with the Flowcharts solution from the area "What is a Diagram" of ConceptDraw Solution Park.
- Flowchart of Products . Flowchart Examples | Data Flow Diagram ...
- Product life cycle process - Flowchart
- Accounting Flowchart Symbols | Flow Chart Symbols | Invoice ...
- Flowchart Marketing Process. Flowchart Examples | Marketing Flow ...
- Flowchart of Products . Flowchart Examples | How to Create a Cross ...
- Design elements - Android product icons | Process Flowchart ...
- Basic Flowchart Symbols and Meaning | Flowchart of Products ...
- Logistics Flow Charts | Flowchart Marketing Process. Flowchart ...
- Flowchart of Products . Flowchart Examples | Process Flowchart ...
- Gantt chart examples | Flowchart of Products . Flowchart Examples ...