PERT Chart Software
PERT Chart Software - Activity Network and Project Evaluation and Review Technique, or PERT, charts are a way of documenting and analyzing the tasks in a project. ConceptDraw DIAGRAM is a powerful diagramming and vector drawing software for designing professional looking PERT Charts quick and easy.Computer Hardware - Reseller Business Plan
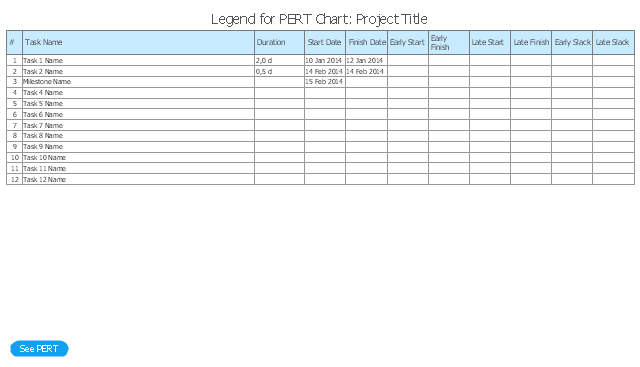
When developing a business plan it is very important to accurately represent the structure and visually outline all important information. A business plan usually has a clear hierarchical structure. The Mind Maps are particularly effective to describe such structures, they are one of the most powerful and visually intuitive tools for the tasks of structuring and memorizing large amounts of information. The Mind Maps are indispensable in development the complex projects, in preparation and discussion of business plans, in designing the presentations, in process of decision making, holding brainstorming, time management, etc. As for the software for working with Mind Maps, particularly effective is a cross-platform ConceptDraw MINDMAP software for Windows and Mac OS X. It provides many tools that help in business plan preparation for organizing the new business, in developing a business plan for promotion some product, etc. ConceptDraw MINDMAP supports the multipage documents, the export and import into popular applications MS PowerPoint, MS Word, PDF, MindManager, in project management applications ConceptDraw Project and MS Project, and in various graphical formats. You can to observe a Mind Map of a business plan for computer hardware reseller designed in ConceptDraw MINDMAP.The PERT chart shows the logical connections and consequence of a set of tasks. PERT charts the time period for problem solving and the implementation plan for all activities along the critical path. The PERT chart is also known as a precedence diagram or project network diagram.
"The Program (or Project) Evaluation and Review Technique, commonly abbreviated PERT, is a statistical tool, used in project management, that is designed to analyze and represent the tasks involved in completing a given project. ...
PERT is a method to analyze the involved tasks in completing a given project, especially the time needed to complete each task, and to identify the minimum time needed to complete the total project.
PERT was developed primarily to simplify the planning and scheduling of large and complex projects. ...
A network diagram can be created by hand or by using diagram software. There are two types of network diagrams, activity on arrow (AOA) and activity on node (AON). Activity on node diagrams are generally easier to create and interpret." [Program Evaluation and Review Technique. Wikipedia]
The PERT chart is one of the Seven Management and Planning Tools (7 MP tools, Seven New Quality Tools).
The PERT chart template for the ConceptDraw PRO diagramming and vector drawing software is included in the solution "Seven Management and Planning Tools" from the Management area of ConceptDraw Solution Park.
How to Report Task's Execution with Gantt Chart
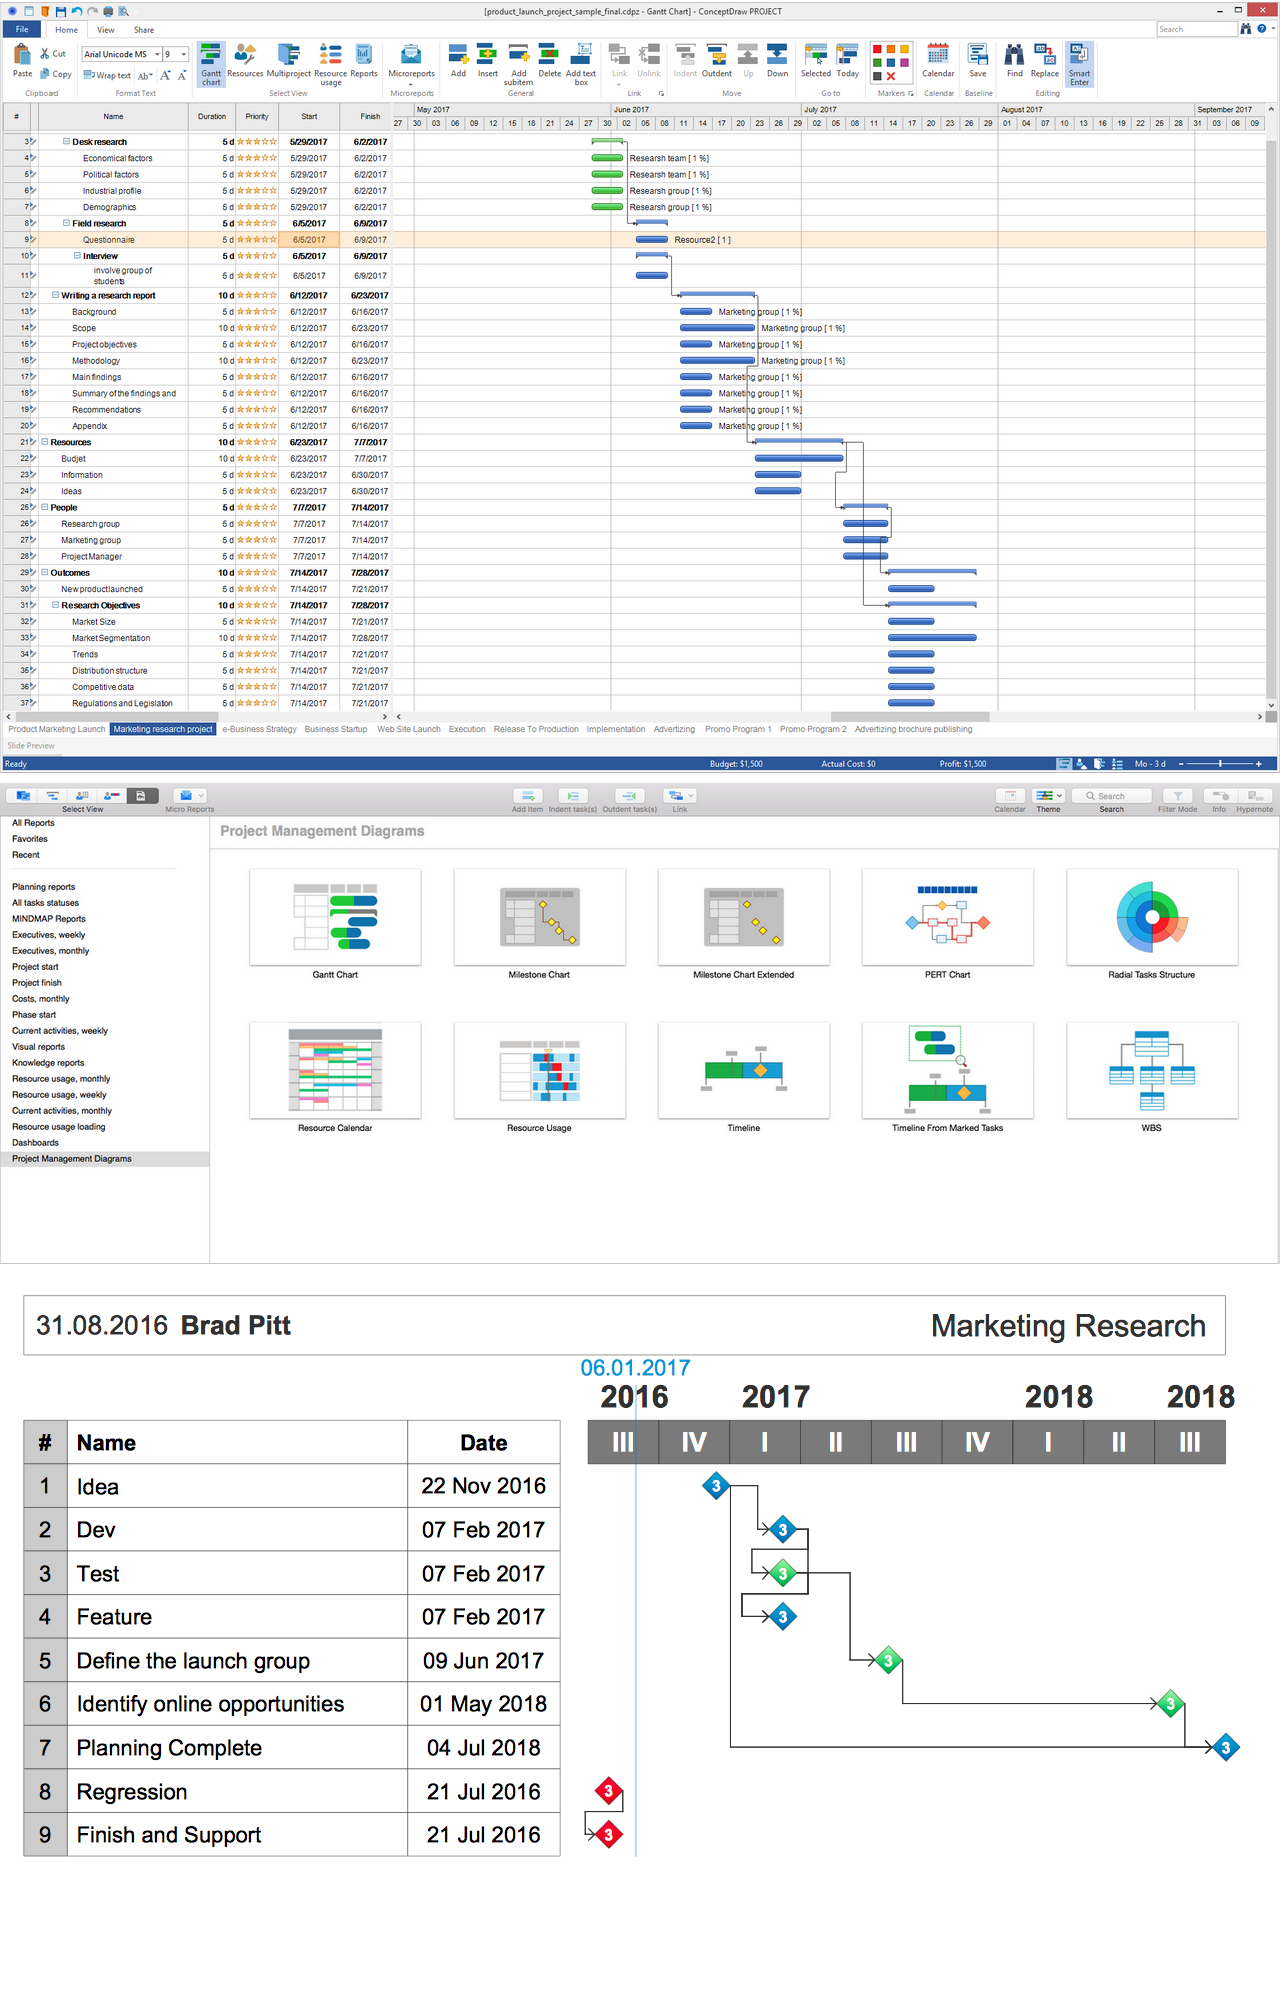
ConceptDraw PROJECT’s powerful reporting engine lets you generate a set of tabular reports with just one click, or visualize your project as Radial Tasks Structures, Work Breakdown Structures and Resource Calendars. It also provides you with dynamic Project Dashboards.Milestone Chart
Milestones are a useful and high-effective tool in project management, they help mark the control points or important key moments in the course of project execution, and accordingly, they contribute to the effective development of the project productivity and monitoring any project‘s progress. The milestones are the perfect way to accurately determine whether the project runs exactly on schedule or not, is ahead of a plan or behind it. They are also perfect for representing the tasks or even the whole phases of the project that are implemented by some external companies.Project Timeline
Project timeline is a type of chart which allows visually represent the chronology of works for the project, placing the key points of the project (milestones) on a timescale. You need to make professional looking project timeline? Create it with ConceptDraw DIAGRAM ! ConceptDraw DIAGRAM extended with Timeline Diagrams Solution from the Management Area is the best timeline diagrams softwareWhat is Gantt Chart (historical reference)
Historical reference about the Gantt chart.ConceptDraw PROJECT Software Overview
ConceptDraw PROJECT is an effective tool for new and experienced users with a fine balance of usability and powerful functionality.PERT Chart
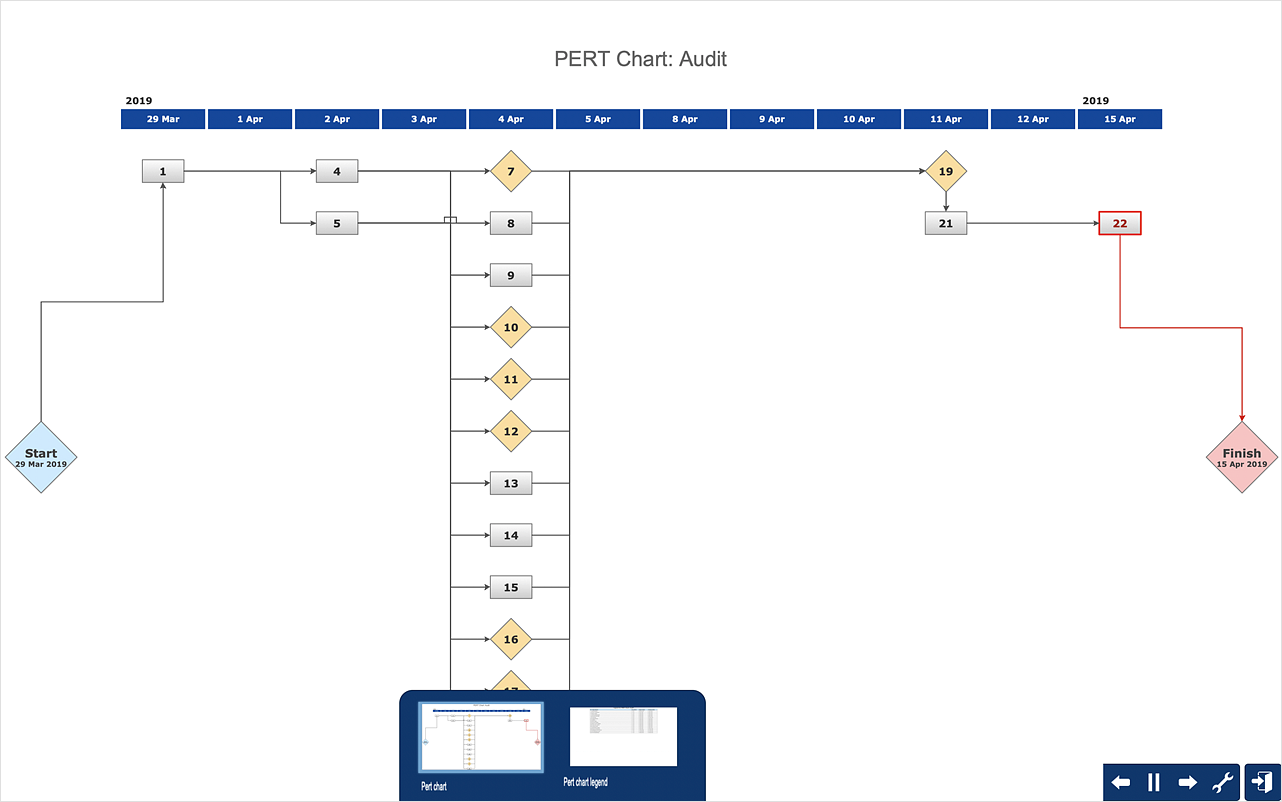
A PERT (Program Evaluation Review Technique) Chart is a popular project management tool that is used to represent all tasks required to be performed for the successful project’s complete. This technique was developed to greatly simplify the planning and scheduling of complex projects. The large projects involve the phases consisting of numerous tasks, the tasks are usually of different types, there can be the parallel tasks among which are executed simultaneously and not dependent on the completion of other tasks. However, the most part of tasks depends on the execution of the rest and so must be completed in a certain sequence, which is clearly visible on a PERT Chart.HelpDesk
How to Create Project Diagrams on Mac
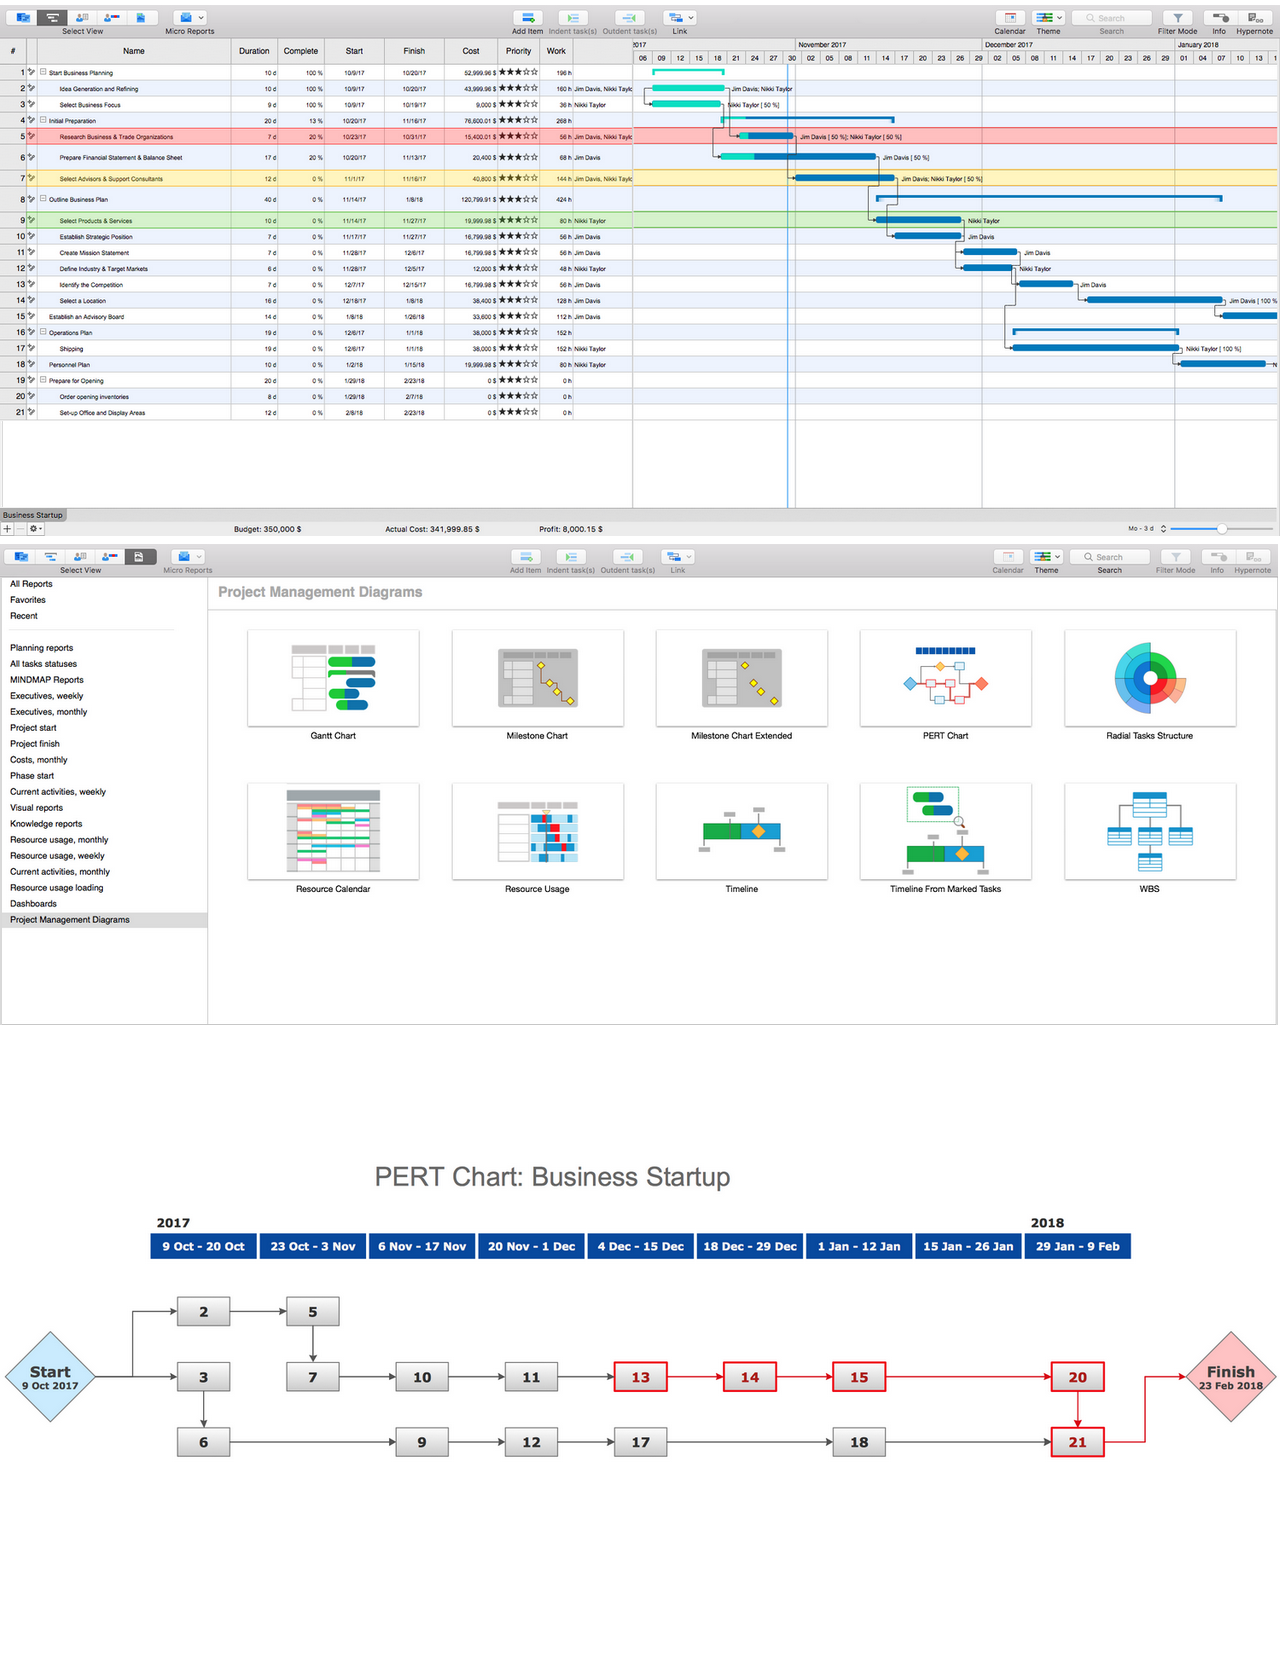
Diagrams are very useful for project implementation because they help teams visualize important details such as interrelations between tasks, critical paths, timelines, milestones, calendars, and also resource usage.- Milestone Chart Template
- Milestone Chart
- Milestone Project Management Example
- Project Milestone Diagram
- Program Management Project Management
- Gantt Chart Templates | Gantt Chart Diagram | Gantt Chart Software ...
- Milestone Chart
- Project Management Area | Scrum Workflow | Program to Make Flow ...
- Milestone Business Plan Examples
- Project Timeline | How to Create a Timeline Diagram in ...


