How To Use Collaboration Tool in Project Management
Collaboration tool for project management enables you to give a new role to knowledge management and document sharing within your team.
How To Plan and Implement Projects Faster
ConceptDraw Office is the most effective tool for planning, tracking, and reporting all types of projects with strong management capabilities, user friendly functionality, and superior ease of use. In this tutorial video we will assist you in planning and managing a project using ConceptDraw Office.How To Use Skype for Business
Using Skype for Business will let you control teams and deliver information worldwide in a real-time. This is an important tool for everyday work.
Pyramid Diagram
Triangle diagram example of DIKW pyramid has 4 levels: data, information, knowledge and wisdom.
 PM Dashboards
This solution extends ConceptDraw PRO and ConceptDraw PROJECT software with the ability to clearly display the identified key performance indicators for any project.
Pyramid Diagram
The DIKW Pyramid refers loosely to a class of models for representing purported structural and/or functional relationships between data, information, knowledge, and wisdom.Pyramid Diagram
The Project Management Triangle Diagram depicts three main constraints of any project: scope, time and cost. Projects have to comply with the specified scope, projects should be finished in time and projects need to consume the budget. Each of the constraints represents one side of the triangle, and any change in budget or timing or scope affects the entire diagram. This diagram was made using ConceptDraw Office suite including best marketing project management software extended with collection of tools for creative project management software and project management reporting software symbols.Pyramid Diagram
A Venn-diagram style chart of the "project triangle" showing visually the potential overlaps between speed, quality and low cost, along with the "inability" to accomplish all three.Product Overview
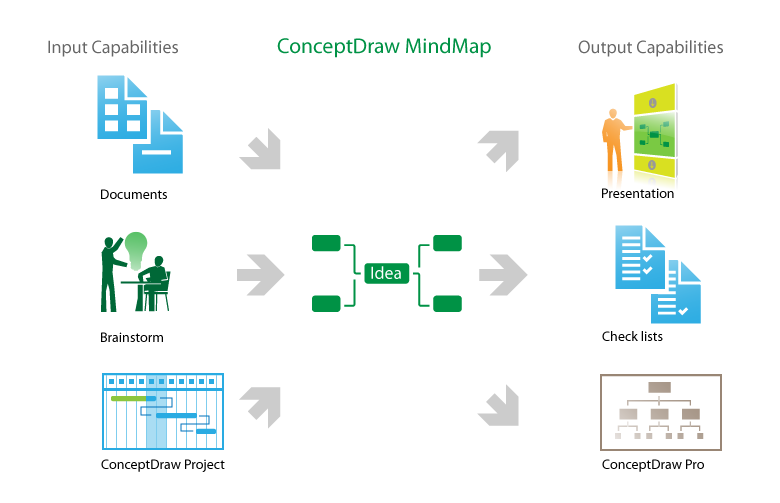
The role of ConceptDraw MINDMAP is to organize and plan idea development and communicate between process participants. Mind maps are convenient to prepare presentations for team and management and send task lists and related information.
 ConceptDraw Solution Park
ConceptDraw Solution Park collects graphic extensions, examples and learning materials
 Concept Maps
The technique of concept mapping was developed as a constructive way of representing knowledge in science and increasing the meaningfulness of learning. Now, the creation of a concept map is extremely helpful when used in education as learning and teaching techniques that assist memorization. Concept maps are also used for idea generation in brainstorming sessions, and for detailing the structure of complex ideas.
Spatial infographics Design Elements: Transport Map
Do you like infographics and data visualization? Creating infographics is super-easy with ConceptDraw.Pyramid Diagram
A five level pyramid model of different types of Information Systems based on the information processing requirement of different levels in the organization. five level pyramid example is included in the Pyramid Diagrams solution from Marketing area of ConceptDraw Solution Park.Excellent Examples of Infographic Maps
Create Spatial infographics with ConceptDraw using its excellent examples of infographic maps. We hope these can inspire and teach you!Spatial infographics Design Elements: Location Map
Infographic Design Elements for visually present various geographically distributed information.Pyramid Diagram
Pyramid chart example is included in the Pyramid Diagrams solution from Marketing area of ConceptDraw Solution Park.Winter Sports Vector Clipart. Medal Map. Spatial Infographics
Tracking Olympic results in visual format is the most modern way to deliver statistics to a broad audience. This is a good example of an illustrated table you may easily modify, print, or publish on web from ConceptDraw Winter Sports solution .- How To Use Collaboration Tool in Project Management | Pyramid ...
- Quality Project Management with Mind Maps | How To Implement ...
- Metro Map | How To Show Project Progress Peport on Web | How To ...
- Quality Project Management with Mind Maps | One formula of ...
- Quality Project Management with Mind Maps | How To Implement ...
- Communication Tool for Remote Project Management | How To ...
- PM Presentations | Communication Tool for Remote Project ...
- How To Implement Collaborative Project Management | How To Use ...
- Quality Management Teams | Successful Quality Management ...
- Launch Projects Exchanging Mind Maps with Evernote | Example ...
- Gantt chart examples | Launch Projects Exchanging Mind Maps with ...
- How To Implement Collaborative Project Management ...
- Communication Tool for Remote Project Management | One formula ...
- How To Implement Collaborative Project Management | How To ...
- Quality Project Management with Mind Maps | One formula of ...
- Quality Project Management with Mind Maps | One formula of ...
- Project Working With Costs | How To Plan and Implement ...
- CORRECTIVE ACTIONS PLANNING PERT Chart | How To ...
- Presentation Clipart | How To Plan and Implement Projects Faster ...
- How To Conduct Effective Team Briefings | How To Use Enterprise ...


