HelpDesk
How to Draw a Gantt Chart
A Gantt chart is intended to provide a visualization of a project schedule. It is developed to help planning, coordinating, and tracking on project tasks implementation. One of the most critical resources for project implementation are time resources. Gantt chart - is one of the most convenient and popular ways of graphical representation of a project tasks progress in conjunction with the corresponding time consumption. Gantt chart's function is to show project tasks completed in progress and to make a project manager sure that project tasks were completed on time. ConceptDraw Office is a clear and easy-to-use tool for project management. It is a very handy visual tool that helps make a project processing clear.How To Plan and Implement Projects Faster
ConceptDraw Office is the most effective tool for planning, tracking, and reporting all types of projects with strong management capabilities, user friendly functionality, and superior ease of use. In this tutorial video we will assist you in planning and managing a project using ConceptDraw Office.HelpDesk
How to Plan and Allocate Resources with ConceptDraw PROJECT on PC
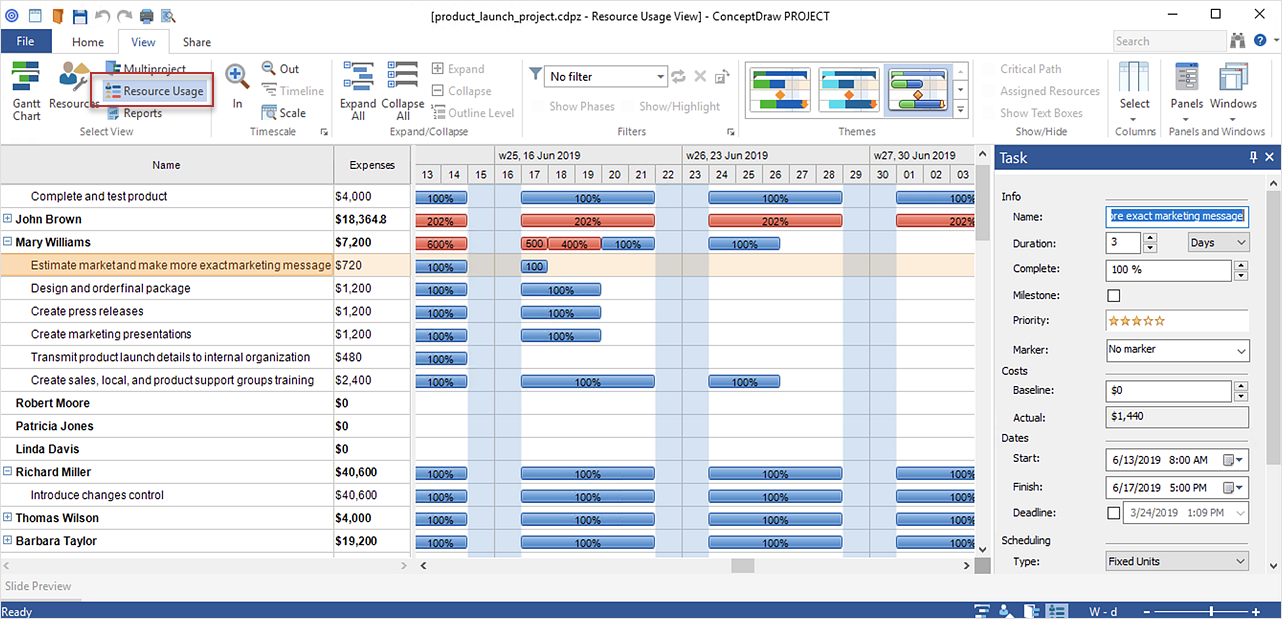
Effective resource management is a key factor in the successful project implementation. The common types of resources for which the project manager has an impact, include material resources (materials, energy), staff (work) and equipment. CoceptDraw PROJECT provides easy ways to project Resources Management: Create a list of project resources and assign the right human resource, as well as the necessary material, or equipment to be used.HelpDesk
How to Create Project Diagrams on Mac
Diagrams are very useful for project implementation because they help teams visualize important details such as interrelations between tasks, critical paths, timelines, milestones, calendars, and also resource usage.Collaboration in a Project Team
Create with our data flow diagram software perfect data flow diagrams. Download data flow diagram software for FREE. Use hundreds of data flow diagram examples.Business diagrams & Org Charts with ConceptDraw DIAGRAM
The business diagrams are in great demand, they describe the business processes, business tasks and activities which are executed to achieve specific organizational and business goals, increase productivity, reduce costs and errors. They let research and better understand the business processes. ConceptDraw DIAGRAM is a powerful professional cross-platform business graphics and business flowcharting tool which contains hundreds of built-in collections of task-specific vector stencils and templates. They will help you to visualize and structure information, create various Business flowcharts, maps and diagrams with minimal efforts, and add them to your documents and presentations to make them successful. Among them are Data flow diagrams, Organization charts, Business process workflow diagrams, Audit flowcharts, Cause and Effect diagrams, IDEF business process diagrams, Cross-functional flowcharts, PERT charts, Timeline diagrams, Calendars, Marketing diagrams, Pyramids, Target diagrams, Venn diagrams, Comparison charts, Analysis charts, Dashboards, and many more. Being a cross-platform application, ConceptDraw DIAGRAM is very secure, handy, free of bloatware and one of the best alternatives to Visio for Mac users.
Activity Network (PERT) Chart
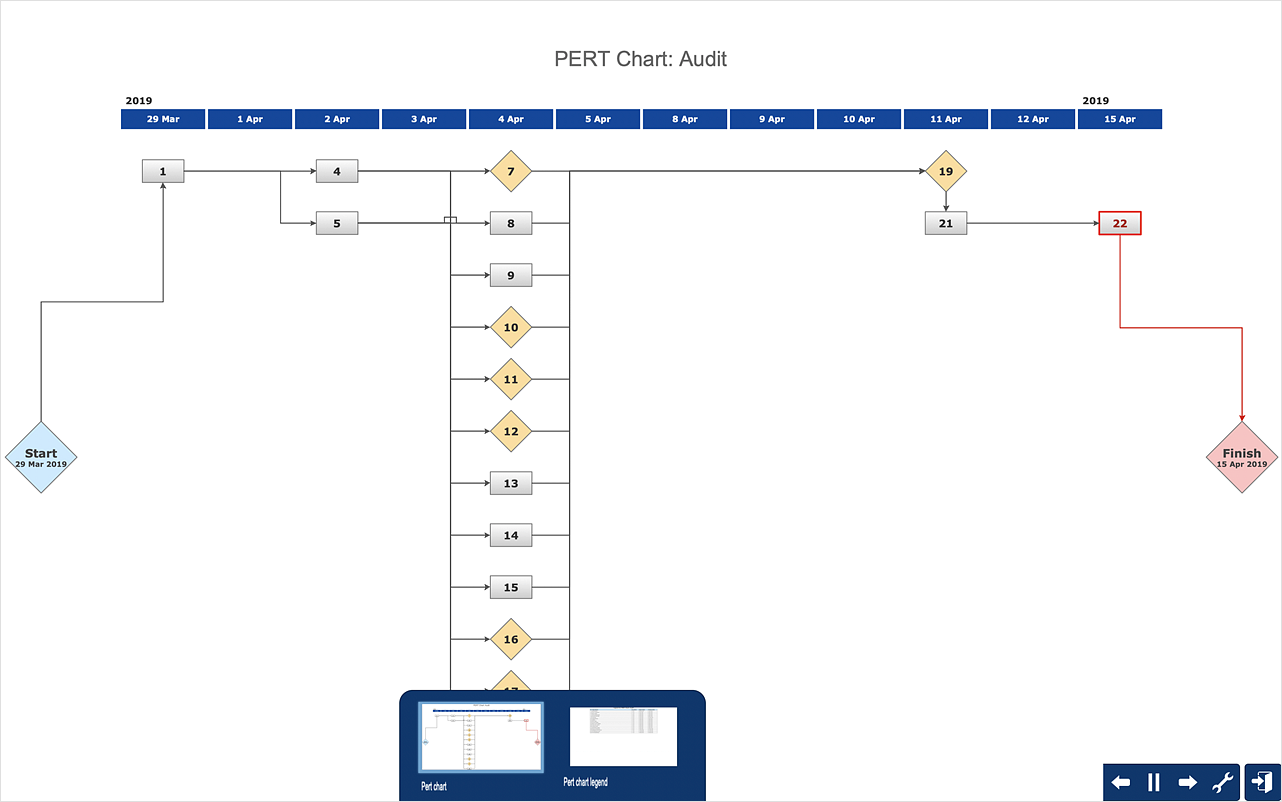
Activity Network and Project Evaluation and Review Technique, or PERT, charts are a way of documenting and analyzing the tasks in a project. This diagram is constructed as part of the process in creating a schedule of corrective actions. The Activity Network Chart (PERT) shows the logical connections and consequence of tasks to be performed. It displays the time period for problem solving and the implementation of all activities through the critical path.HelpDesk
How to Manage Problem Solving Using Seven Management and Planning Tools
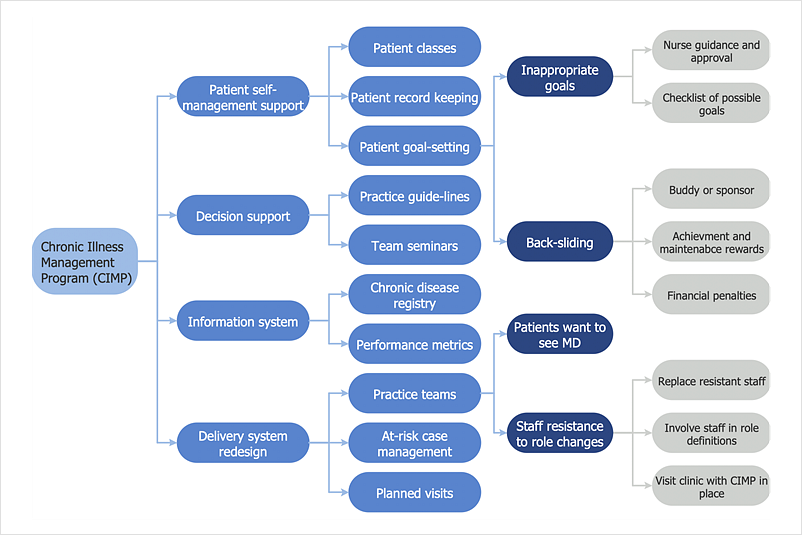
Stage by stage gouide on using visual tools to move toward solving the problem.
Business Process Modeling Notation
ConceptDraw DIAGRAM is a software for simplу depicting the business processes based on BPMN 2.0. Business Process Diagrams Cross-Functional-Flowcharts, Workflows, Process Charts, IDEF0 and IDEF2, Timeline, Calendars, Gantt Charts, Business Process Modeling, Audit and Opportunity Flowcharts and Mind Maps (presentations, meeting agendas).Business Processes description with ConceptDraw DIAGRAM
Business Processes description with ConceptDraw. Business-processes it allows to describe functional blocks, for example production and marketing. ConceptDraw lets creation of business processes description using IDEF0 and IDEF2 methods.- How to Report Task's Execution with Gantt Chart | How to Create ...
- Gantt charts for planning and scheduling projects | How To Plan and ...
- Gant Chart in Project Management | Gantt charts for planning and ...
- How to Report Task's Execution with Gantt Chart | How to Create ...
- How to Draw a Gantt Chart Using ConceptDraw PRO | Gantt chart ...
- Gant Chart in Project Management | Gantt chart examples | How to ...
- Gant Chart in Project Management | Gantt chart examples | What ...
- How to Draw a Gantt Chart Using ConceptDraw PRO | Gantt Chart ...
- How to Draw a Gantt Chart Using ConceptDraw PRO | How to ...
- How to Draw a Gantt Chart Using ConceptDraw PRO | How to ...
- Process Flowchart | How to Draw a Gantt Chart Using ConceptDraw ...
- Sample Gantt Chart For Project Implementation
- How to Make a Mind Map from a Project Gantt Chart | Business ...
- How to Create a Timeline Diagram in ConceptDraw PRO | Gantt ...
- Gantt chart examples | Gantt Chart Templates | How to Create a ...
- Gant Chart in Project Management | Project Timeline | Program ...
- Gantt Chart Templates | Examples of Flowcharts, Org Charts and ...
- How to Report Task's Execution with Gantt Chart
- Activity Network Diagram Method | How to Draw a Gantt Chart Using ...
- How to Draw a Gantt Chart Using ConceptDraw PRO | Software ...


