Process Modelling using Event-driven Process chain
Event-Driven Process Chain Diagrams for improvement throughout an organisation. ConceptDraw DIAGRAM - business process mapping software that reduces the time needed to create a business process model and its excellent business process improvement tools.Sample Project Flowchart. Flowchart Examples
This sample shows the Flowchart that displays the architecture of SQL Exception Translation. This sample was created in ConceptDraw DIAGRAM diagramming and vector drawing software using the Flowcharts solution from the Diagrams area of ConceptDraw Solution Park.
EPC (Event-driven Process Chain) Flowcharts
The Event - driven Process Chain ( EPC ) allows managers visually present business process models for making decisions for business processes improvement. Event-Driven Process Сhain Diagrams for improvement throughout an organisation.Must Have Suggestion
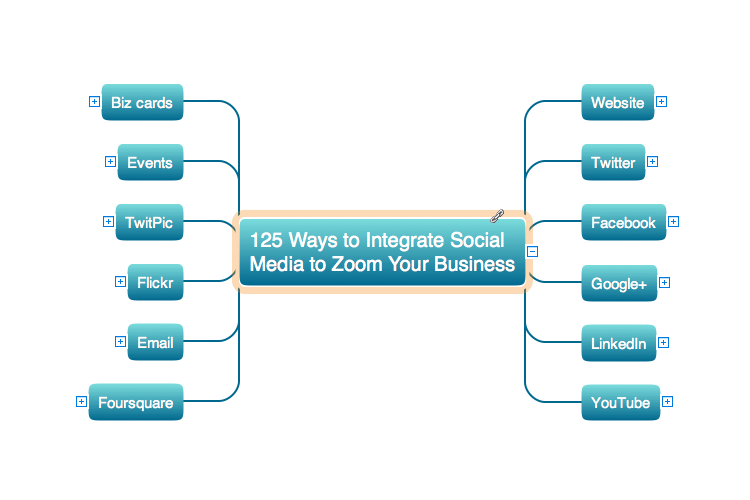
The increasing of sales directly depends from the improvement and perfection of the product and from adding new features must-have according to the customers' opinion. In this regard, it is important to have constant feedback with customers, to analyze their questions and make conclusions, to conduct various surveys, to maintain statistics, to monitor changes and market's improvement in a given segment. Heed to customers feedback, respond quickly to requests, consider proposals for improvements to develop your business, to increase the client orientation and competitiveness. The competition makes business more interesting and effective, that's why it is important to analyze the market, as well as the successes and suggestions of other companies in this field. In many cases detailed analysis will help to detect the trends and understand what features are in demand at the moment. This is very important, because timely addition of relevant features and effective possibilities in many cases helps to dramatically increase the popularity of the product and accordingly the volume of its sales. Don't be afraid to follow the expectations of your customers and surprise them also. This action Mind Map helps correctly respond to feature suggestions made by customers and for requirements related to must-have features. The example contains ready to use response phrases.How to Help Customers be More Productive
Presenting you with a drawing program which could really surprise you with their great functionality. Don't know how to start to draw Connector's improvement? Curious how should diagramming software work? Drawing programs involve a lot of things like designs in an illustrative way, creating an cherts, Tools to create high end graphics, create dashboards, using your data and many other technical aspects do it in a much professional and in a quick way.This flowchart example was created on the base of land sales process diagram from the Property management webpage of the VicRoads website.
[www.vicroads.vic.gov.au/ planning-and-projects/ property-services/ property-management]
"VicRoads or the Roads Corporation of Victoria is a statutory corporation which is the state road and traffic authority in the state of Victoria, Australia. It is responsible for maintenance and construction of the state arterial road network, as well as driver licensing and vehicle registration. VicRoads has broad responsibility for road safety policy and research. It is also responsible for regulating the accident towing industry in Victoria." [VicRoads. Wikipedia]
"Sales Process.
Once it has been established with the relevant VicRoads Regions/ Projects and other business areas that properties are identified as surplus to VicRoads’ operational needs, they are incorporated in the VicRoads annual sales program.
Following approval: relevant VicRoads Regional Manager and the VicRoads Chief Executive (and in some circumstances Minster for Public Transport and Roads) must approve all land deemed surplus and available for disposal.
The method of sale is then determined and consultant advice is sought:
(1) Planning.
(2) Valuer General Victoria (Valuer General’s office must provide a valuation for all sales).
(3) Government Land Monitor (Land Monitor approval is sought if the value exceeds $750,000).
(4) Environmental.
(5) Local Council." [www.vicroads.vic.gov.au/ planning-and-projects/ property-services/ property-management]
The example "Land sales process flowchart" was created using the ConceptDraw PRO diagramming and vector drawing software extended with the Sales Flowcharts solution from the Marketing area of ConceptDraw Solution Park.
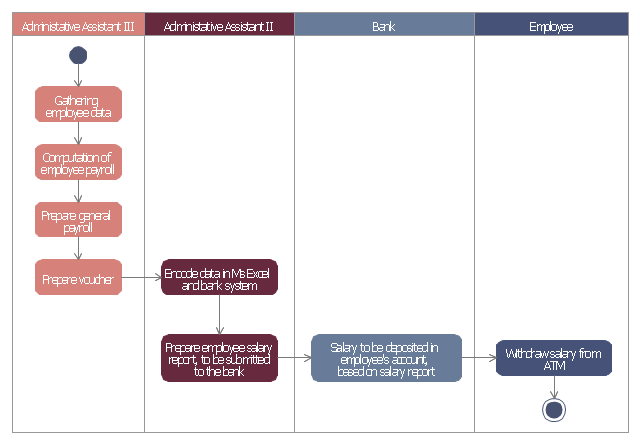
This example of automated payroll management system UML activity diagram was created on the base of figure on the webpage "Automated payroll management system" from ethelmandane.wikispaces.com.
"In the Philippines and in other foreign countries the government has a trend to embrace automation for process efficiency. One of the processes that are being automated is the payroll process. Payroll is the total amount required to pay workers and employees during a week, month or other period.
One of the government offices that desires to automate their payroll system is the NSO Camarines Sur which is located 2nd Floor MMCN Building, Panganiban Avenue, Naga City. The National Statistics Office (NSO) envisions to be recognized as a world-class provider of statistical and civil registration products and services and lives with its mission to produces and provides quality statistical and civil registration products and services. ...
The project seeks to create an Information System Plan for an Automated Payroll Management System. ...
The creation of the Information System Plan will benefit the accounting section of the organization. Specifically it is significant to:
1. Administrative Assistants. It will help to lessen time and effort in preparing and computing the salary of the employee.
2. NSO. It will help the organization to be more productive and efficient."
[ethelmandane.wikispaces.com/ ]
This file is licensed under a Creative Commons Attribution Share-Alike 3.0 License. [creativecommons.org/ licenses/ by-sa/ 3.0/ ]
This UML activity diagram example modeling the automated payroll management system using automated teller machine (ATM) was created using the ConceptDraw PRO diagramming and vector drawing software extended with the ATM UML Diagrams solution from the Software Development area of ConceptDraw Solution Park.
UML Use Case Diagram Example. Registration System
This sample was created in ConceptDraw DIAGRAM diagramming and vector drawing software using the UML Use Case Diagram library of the Rapid UML Solution from the Software Development area of ConceptDraw Solution Park. This sample shows the types of user’s interactions with the system and is used at the registration and working with the database system.Education Infographics
The Education Infographics are popular and effectively applied in the educational process. Now you don't need to be an artist to design colorful pictorial education infographics thanks to the unique drawing tools of Education Infographics Solution for ConceptDraw DIAGRAM diagramming and vector drawing software.Business - Design Elements
Choose which of business design elements you love best. Design your own style with Business and Finance Solutions from ConceptDraw DIAGRAM. We created a full set of elements, business samples, templates and libraries with vector clip art for drawing the Business Illustrations. Mark your report or presentation, pay an attention of audience on your drawings with vector business design elements.
 Event-driven Process Chain Diagrams
Event-Driven Process Chain Diagrams solution extends ConceptDraw DIAGRAM functionality with event driven process chain templates, samples of EPC engineering and modeling the business processes. It includes a vector shape library for drawing the EPC diagrams and EPC flowcharts of any complexity. It is one of EPC IT solutions that assist the marketing experts, business specialists, engineers, educators and researchers in resources planning and improving the business processes using the EPC flowchart or EPC diagram. Use the EPC solutions tools to construct the chain of events and functions, to illustrate the structure of a business process control flow, to describe people and tasks for execution the business processes. Apply it to identify the inefficient business processes in the enterprise and take the corresponding measures required to make them efficient.
Flowchart
The Flowcharts are widespread in various fields and include the multitude of types. They are dedicated to representation the algorithms, processes, workflows of any complexity in a clear and intuitive format. The Flowcharts are commonly used in software development as a visual tool for illustration algorithms and logic of computer programs, in business for illustration business scenarios, in education, and so on. For drawing the Flowchart are used the special object blocks, among them rectangle or box used to represent an activity or step, rounded box or oval to depict Start / End, diamond to represent the decision point (involves the branching yes/no), circle used to represent the point of connection, parallelogram to represent the Input / Output, and some others. With ConceptDraw DIAGRAM including Flowcharts solution it is easy to create professional-looking Flowchart diagrams of any complexity and any degree of detailing. Succeed in drawing the Flowcharts using quick-start templates, predesigned samples and extensive libraries of ready-made flowchart symbols, blocks and icons.Pyramid Diagram
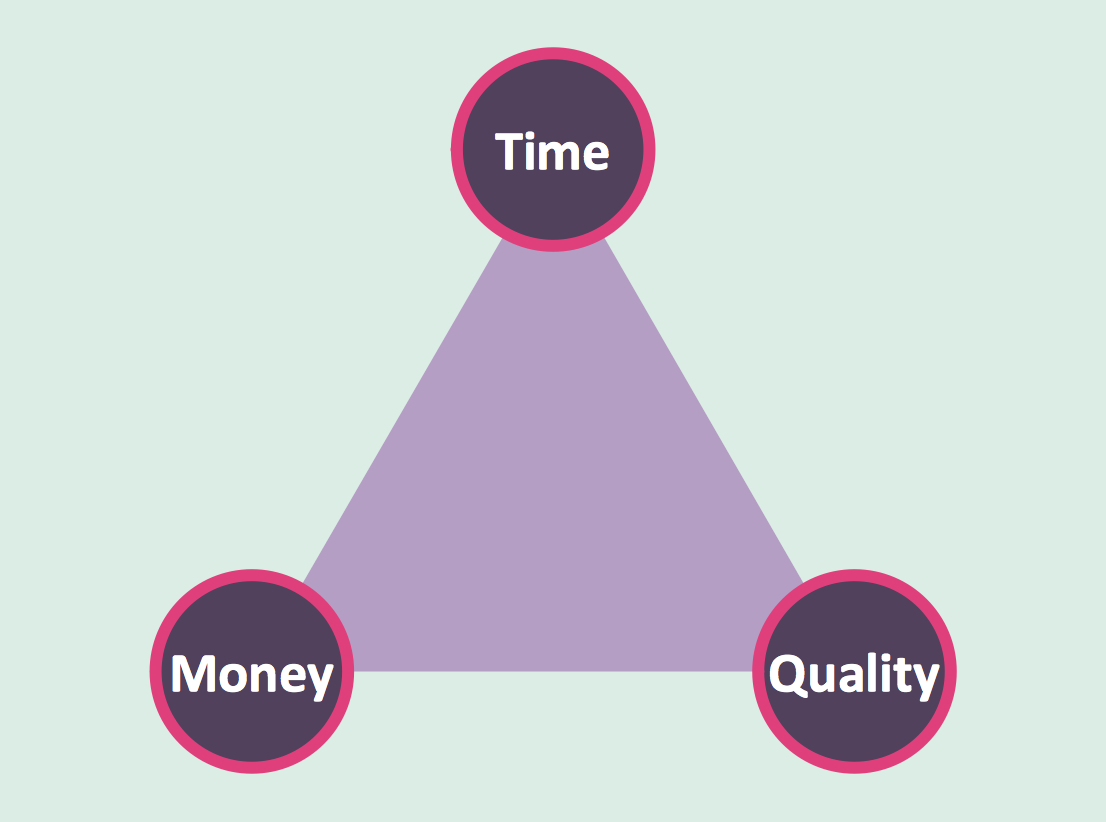
The Time-Money-Quality Triangle illustrates an advertising truism, that you can't have all three.Business Process Reengineering. Business Process Example
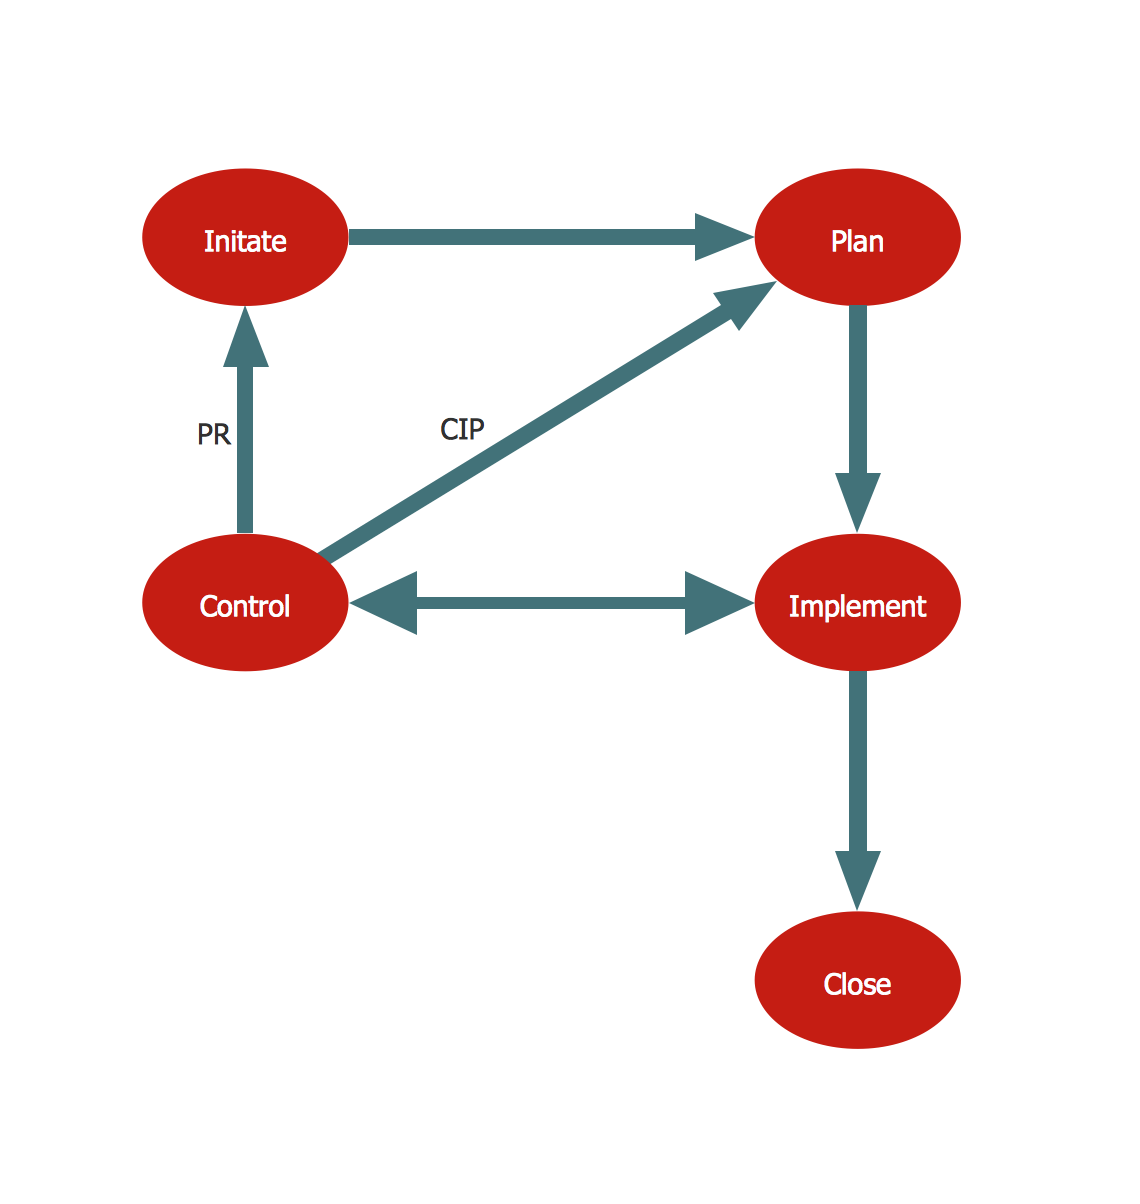
This sample shows the Business Process Reengineering Diagram, displays the Continuous Improvement Process (CIP) directed at the permanent improvement of the processes. This sample can be used in business process management, quality management, project management and program management.HelpDesk
Download and Install ConceptDraw OFFICE on Windows
You can use the following instruction to download and install ConceptDraw products for Windows. The download process is very simple due to the fact that all applications are bundled into the ConceptDraw Office suite. ConceptDraw STORE is a download manager that is responsible for downloading, installing, uninstalling and updating of the ConceptDraw Office for Windows and associated solutions.Bar Graph
You need to draw the Bar Graph? The automated tool can be useful for you. ConceptDraw DIAGRAM diagramming and vector drawing software extended with Bar Graphs solution from Graphs and Charts area of ConceptDraw Solution Park will help you create any Bar Graph.eLearning for Leadership
Digital Learning Tools & Technologies. Online training with Skype for effective classrooms. Changing perceptions of leadership and learning.
- UML Use Case Diagram Example. Registration System | Flowchart ...
- Event-driven Process Chain Diagrams | UML Sample Project
- Flowchart | Registration Process Flowchart
- Event-driven Process Chain Diagrams | Land sales process ...
- Event-driven Process Chain Diagrams | Dfd Registration Process
- Flowchart | Patient Registration Process Flowchart
- UML Use Case Diagram Example. Registration System | UML ...
- Automated payroll management system UML activity diagram | UML ...
- UML Use Case Diagram Example. Registration System | Flowchart ...
- UML Use Case Diagram Example. Registration System


