How to Report Task's Execution with Gantt Chart
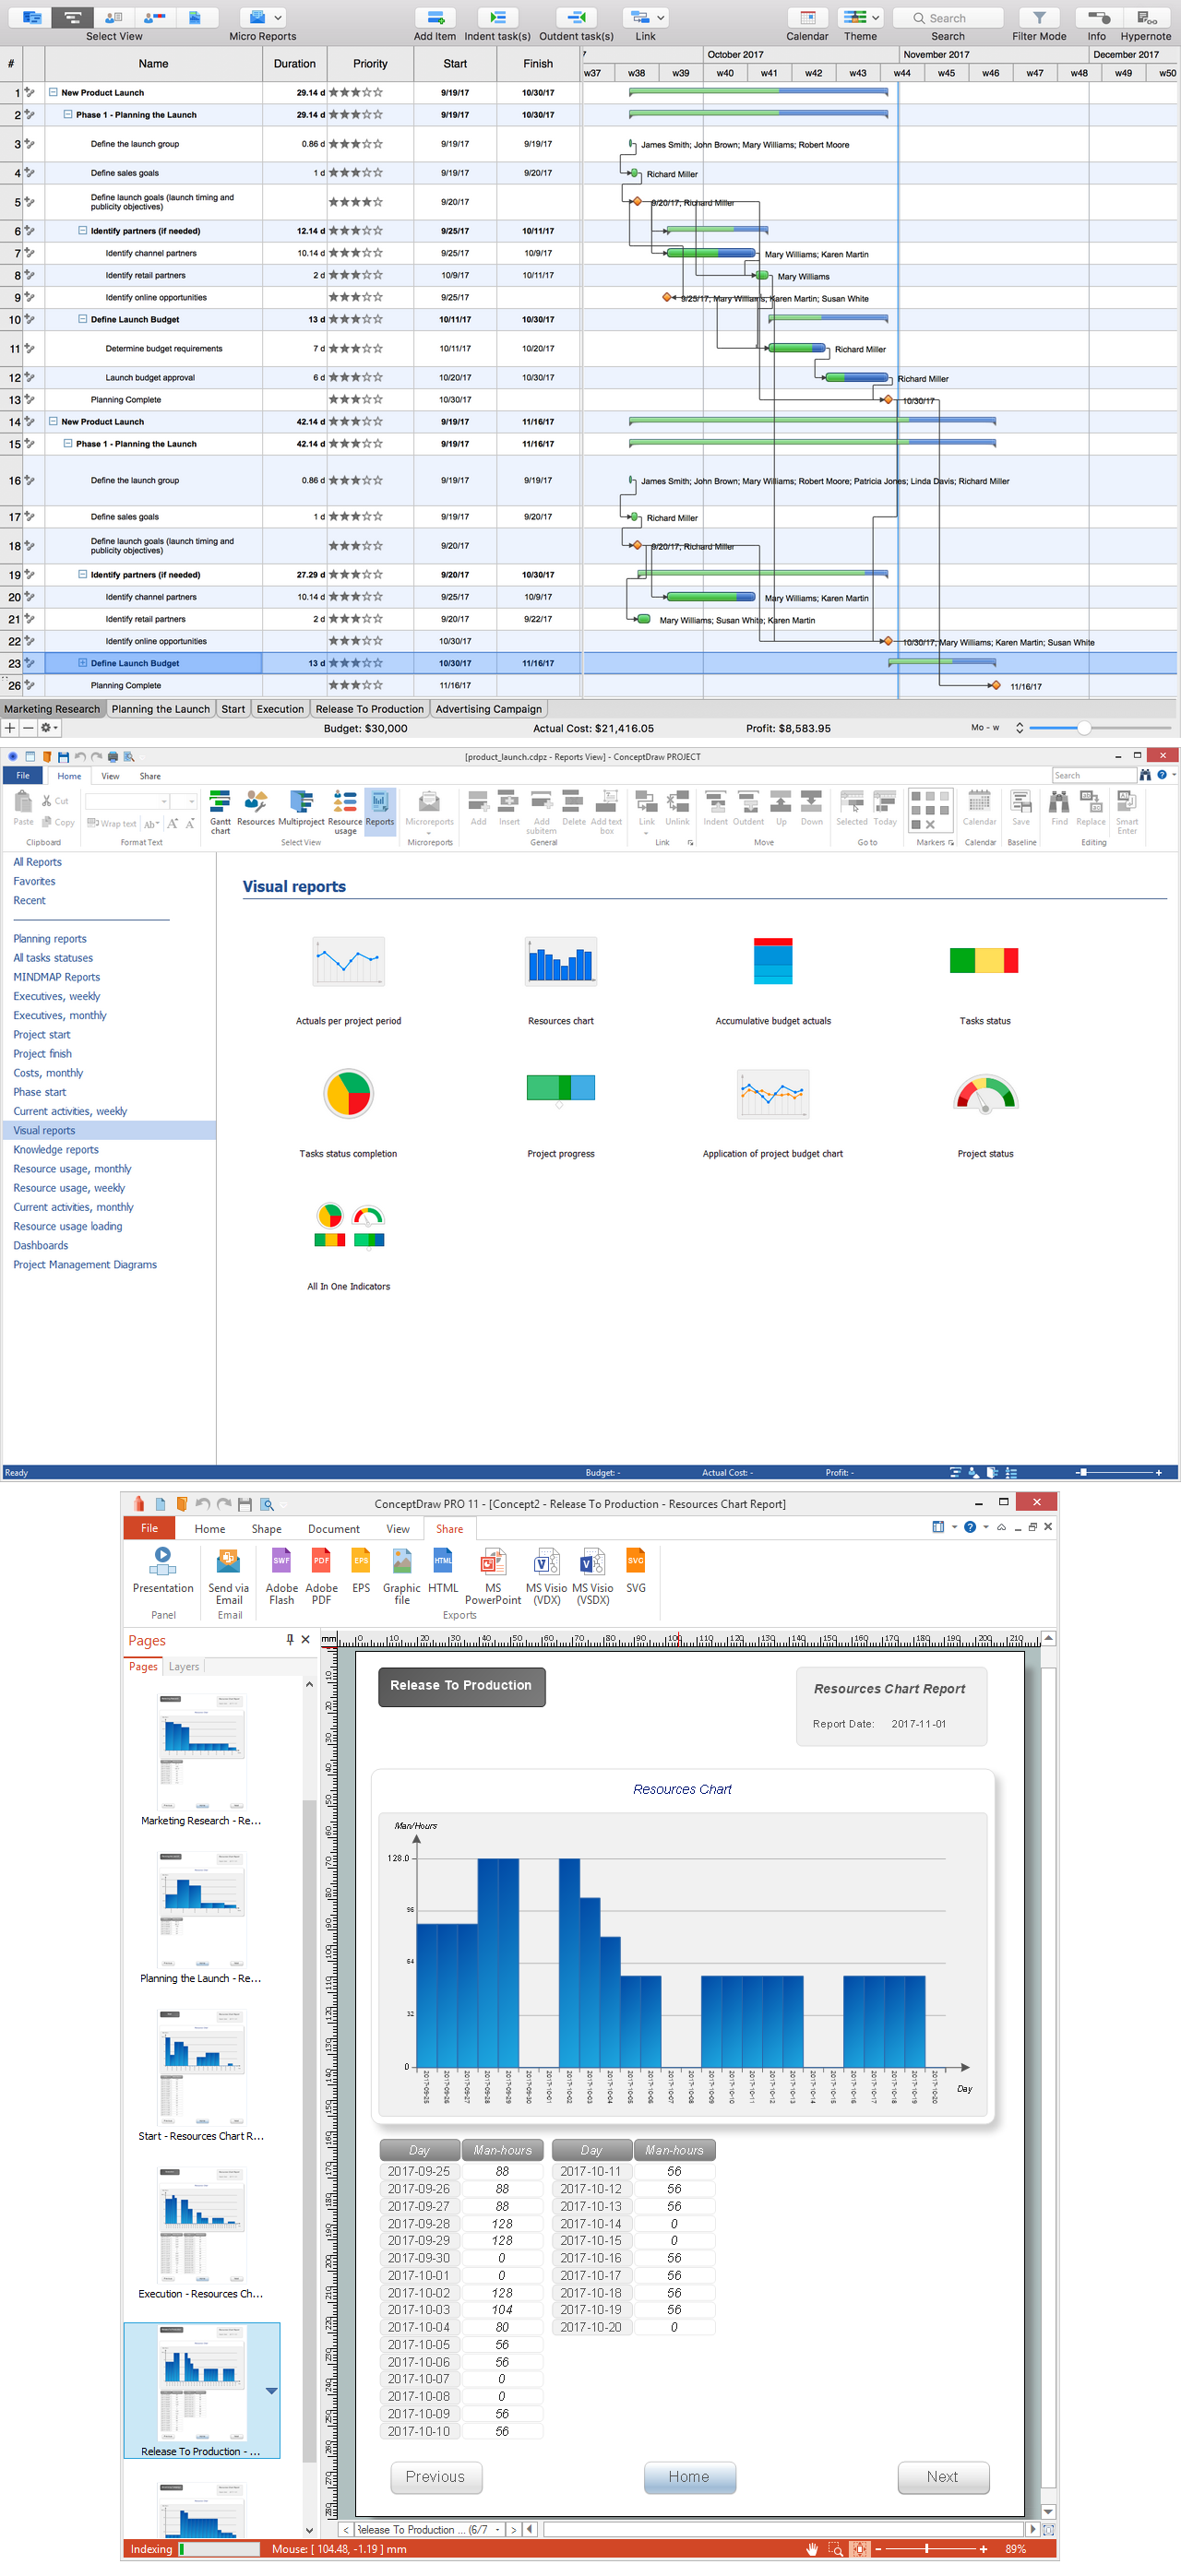
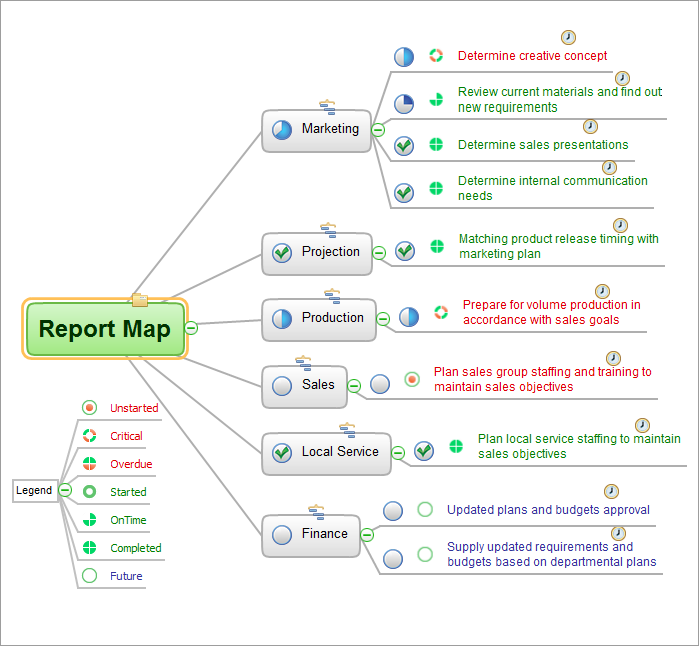
ConceptDraw PROJECT’s powerful reporting engine lets you generate a set of tabular reports with just one click, or visualize your project as Radial Tasks Structures, Work Breakdown Structures and Resource Calendars. It also provides you with dynamic Project Dashboards.How To Create Project Report
ConceptDraw PROJECT contains an extensive tool set to help project managers. The rich data visualization capability that is provided by ConceptDraw products helps you create project dashboards, one-click reports, multi-project views, Gantt charts, and resource views. Let′s learn how to get maximum value using ConceptDraw PROJECT!What is Gantt Chart (historical reference)
Historical reference about the Gantt chart.Business Report Pie. Pie Chart Examples
This sample shows the Business Report Pie Chart. The Pie Chart visualizes the data as the proportional parts of a whole, illustrates the numerical proportion. Pie Charts are very useful in the business, statistics, analytics, mass media.
 Visual Reports
The Visual Reports solution extends abilities of ConceptDraw PROJECT by creating the illustrative, informative, colourful and comprehensible reports on a project in a form of visual graphs and diagrams of common types, such as Bar Charts, Pie Charts, Line Charts, Divided Bar Charts, Timelines, Dial Dashboards. This highly effective project management tool helps project managers and other stakeholders to report about the tasks statuses, the project progress and degree of its completion, to evaluate the project status, to depict the project expenses by days and to define the days that go beyond the budget, to compare visually the actual expenses and expected ones at the project planning stage, to generate the Resource chart depicting the utilization of project resources by days, and to show other useful information. The set of tailor-made examples developed for the Visual Reports solution allows designating advantages of each type of report included to this solution for the further use in your management work.
Project Reports — Visual Reports
The diagrams and graphs are a clear and illustrative way of representing different information, data, ratios of values forming a single unity. There are many kinds of graphs and charts, which find their application in varied fields and spheres of activity, including the field of project management. For each type of information its own the most suitable visualization tool is used. A visual analysis of diagrams is a simplest, but highly effective planning and project management tool, convenient to obtain the answers to many questions concerning the project and its implementation.
 PM Dashboards
The PM Dashboards solution extends the management boundaries of ConceptDraw DIAGRAM and ConceptDraw PROJECT products with an ability to demonstrate changes to the budget status, to show the project progress toward its objectives, to display clearly the identified key performance indicator (KPI) or the set of key performance indicators for any project. This solution provides you with examples and ability to generate three types of visual dashboards reports based on your project data Project Dashboard, Tactical Dashboard, and Radar Chart. By dynamically charting the project’s key performance indicators that are collected on one ConceptDraw DIAGRAM document page, all project participants, project managers, team members, team leaders, stakeholders, and the entire organizations, for which this solution is intended, have access to the daily status of projects they are involved in.
Project — Working With Tasks
A full-featured project management solution with all the necessary functions right at your fingertips. Generates an extensive variety of reports on project and task statuses. These videos provide a series of lessons that will enhance the understanding of all our users, from people just starting out with the software, through to expert users.How to Create Gantt Chart
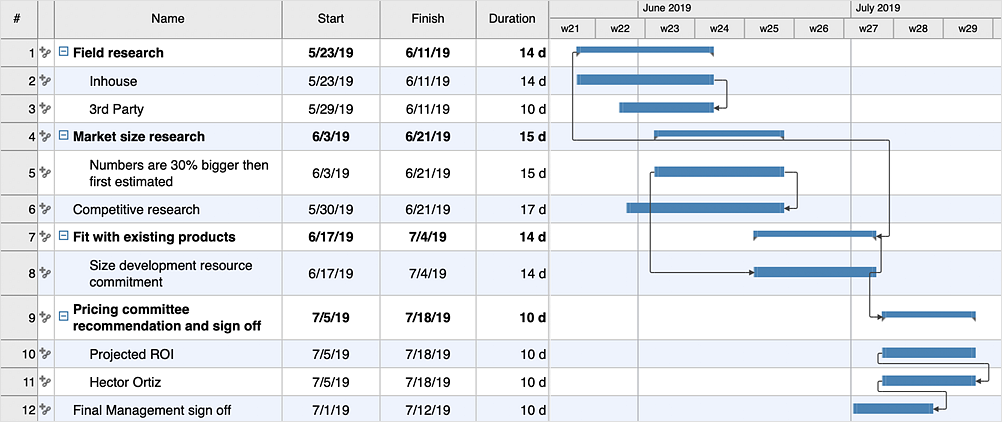
To begin managing a new project, you will need to define the individual Tasks that must be completed to deliver it. The default view for a new project in ConceptDraw PROJECT is the Gantt Chart.
 Cash Flow Reports
The Cash Flow Reports solution extends the ConceptDraw PROJECT software with the abilities to generate three kinds of management reports in a form of spreadsheets: Cash Flow on Projects, Cash Flow on Resources, and Cash Flow on Tasks. Use them to monitor and to control the cash flow in projects and multiprojects, the project expenses by days, by resources, by tasks, and to analyze effectively the project progress and the compliance of project finances to allocated budget. Having a full content and ideal view, these reports are popular with the project planning and project management teams, project participants, team leaders, and project managers which have the need for demonstrating the steps of work on projects and reporting about project progress in printed reports or on a large screen. The projects examples included in this solution are illustrative and perfectly suit for comprehending all the solution's capabilities.
How to Create Presentation of Your Project Gantt Chart
During the planning, discussing and execution of a project you may need to prepare a presentation using project views such as the Gantt Chart, Multiproject Dashboard or Resource Usage View. It’s easy do with ConceptDraw PROJECT!What Constitutes a Project?
Separated into categories of Basic, Intermediate, and Advanced categories, the new instructional videos about ConceptDraw PROJECT cover a huge breadth of topics, explaining how to use project management software. Users new to ConceptDraw PROJECT will find the Basic lessons an essential platform for familiarizing themselves with the programs′s functions and found it simple project management software. This video lesson is the first in Basic lessons series tells about affordable simple project management software, it may be used as an intro for what is project management using simple project management sample. ConceptDraw PROJECT is excellent portfolio project management software, this lessons explains how to use project management software for small business in case of multi project environment.
Project —Task Trees and Dependencies
Users new to ConceptDraw PROJECT will find the Basic lessons an essential platform for familiarizing themselves with the program′s functions. This video lesson will teach you how to set up task trees and dependencies.How to Discover Critical Path on a Gantt Chart
ConceptDraw PROJECT is the Gantt chart software that implements critical path method to provide the user with a wide set of project management tools.ConceptDraw PROJECT Software Overview
ConceptDraw PROJECT is an effective tool for new and experienced users with a fine balance of usability and powerful functionality.How To Hold Project Collaboration via Skype
Project Management Trends. Status report presentation tool for remote teams, using Skype to collaborate on project objectives.
 PM Planning
The PM Planning solution extends the functional abilities of ConceptDraw MINDMAP and ConceptDraw PROJECT software, allowing to automatically create the spreadsheets reflecting the tasks and project statuses for people who have different project roles. The reporting capabilities of this solution are represented by the possibility to generate a wide range of project reports that allow the project managers, senior management and other project participants to be informed on a project daily progress and monthly objectives: All Inclusive Report, All Visible Columns, Milestones with Notes and Objectives, Projects Goals, Projects Managers, Project Team, and Top Level Tasks. The PM Planning solution from ConceptDraw Solution Park is a strong project management and productivity tool which simplifies the process of reporting and lets one create a document with the desired report, includes the predesigned examples, extends and improves the planning capabilities for all team members, improves the project communication, helps to accurately plan, maintain, and finish projects on time, to track the work of project resources, to perform the analytical work and to make effective decisions.
Starting a Drawing Project Has Never Been Easier
ConceptDraw DIAGRAM is a powerful drawing tool that changes the way diagrams are produced. While starting drawing project has never been easier. This is more than enough versatility to draw any type of diagram with any degree of complexity. ConceptDraw Arrows10 Technology - This is more than enough versatility to draw any type of diagram with any degree of complexity.HelpDesk
How to Create a Gantt Chart for Your Project
Instruction on how to create Gantt chart using ConceptDraw PROJECT software. Gant Chart is a graphical representation of tasks as segments on a time scale. It helps plan or overlapping.Gantt charts for planning and scheduling projects
ConceptDraw PROJECT is an excellent simple project scheduling software. It maintain classic project gantt charts and the line of professional reports on resources usage. It include handy critical path scheduling software tools and diagraming tools which helps prepare the presentation of project status. It include project tracking dashboard to keep project metrics upto date, also it have handy feature to export project management dashboard in excel file.- How To Create Project Report | Cross Functional Flowchart ...
- How To Create Project Report | Project management triangle ...
- How To Create Project Report | Cross Functional Flowchart ...
- Project Reports — Visual Reports
- How to Report Task's Execution with Gantt Chart | Gantt Chart ...
- How to Report Task's Execution with Gantt Chart | How to Report on ...
- How To Create Project Report | How to Generate ConceptDraw ...
- Entity-Relationship Diagram (ERD) | How To Create Project Report ...
- How To Create Project Report | Import And Export Management ...
- Flowcharts | How To Create Project Report | Draw And Explain The ...
- What is Gantt Chart (historical reference) | How To Create Project ...
- Gantt charts for planning and scheduling projects | How To Create ...
- How To Create Project Report | Project —Task Trees and ...
- How To Create Project Report | PM Planning | How To Hold Project ...
- Project Management Example Construction
- How to Publish Project Reports on the Web | Contoh Flowchart ...
- How To Create Project Report | Er Diagram For Healthcare ...
- Interactive Venn Diagram | Venn Diagram Maker | Venn Diagrams ...
- How To Create Project Report | How to Track Your Project Plan vs ...
- How To Create Project Report | Percentage of the top 1% wage ...


