HelpDesk
How to Create a VSM Diagram Using Solutions
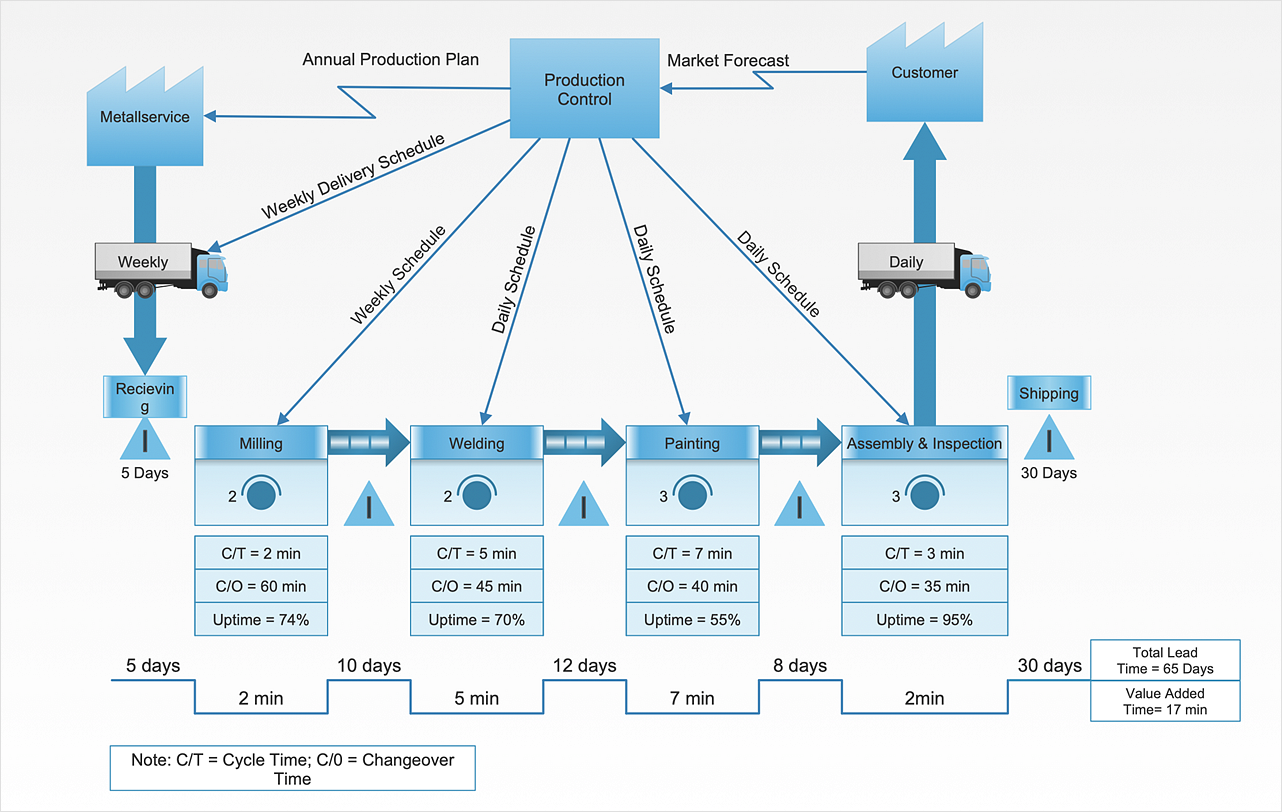
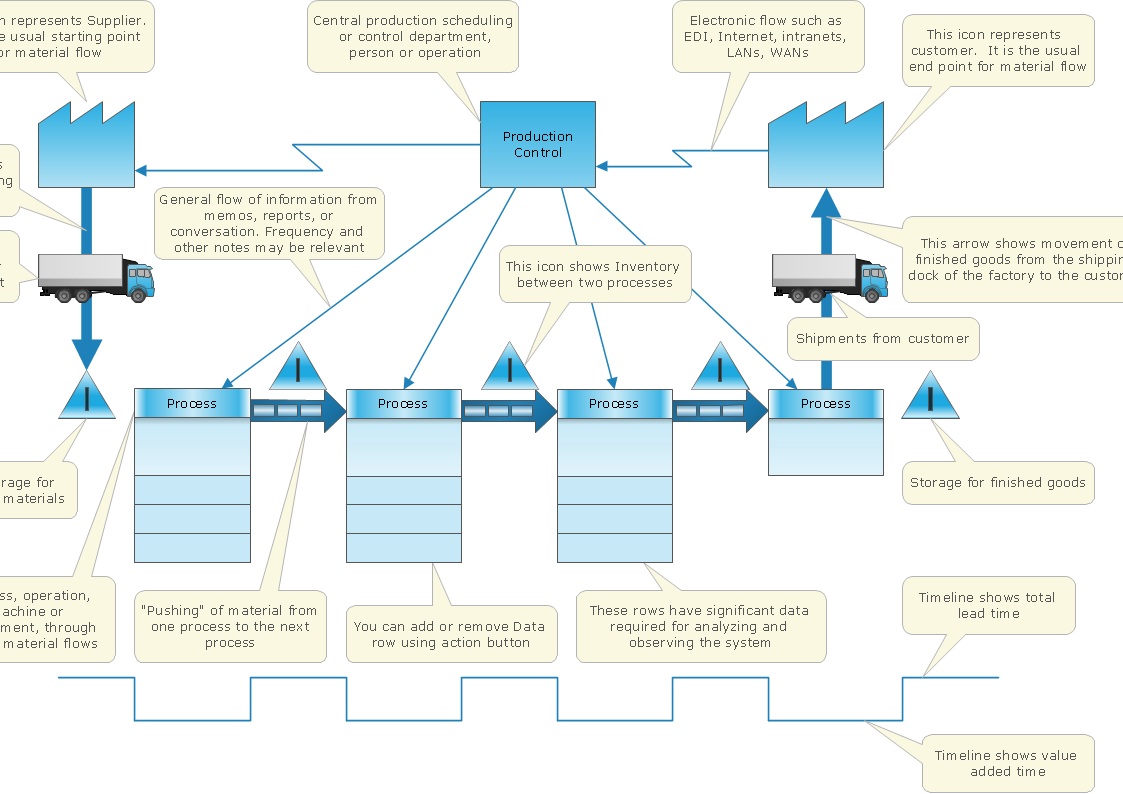
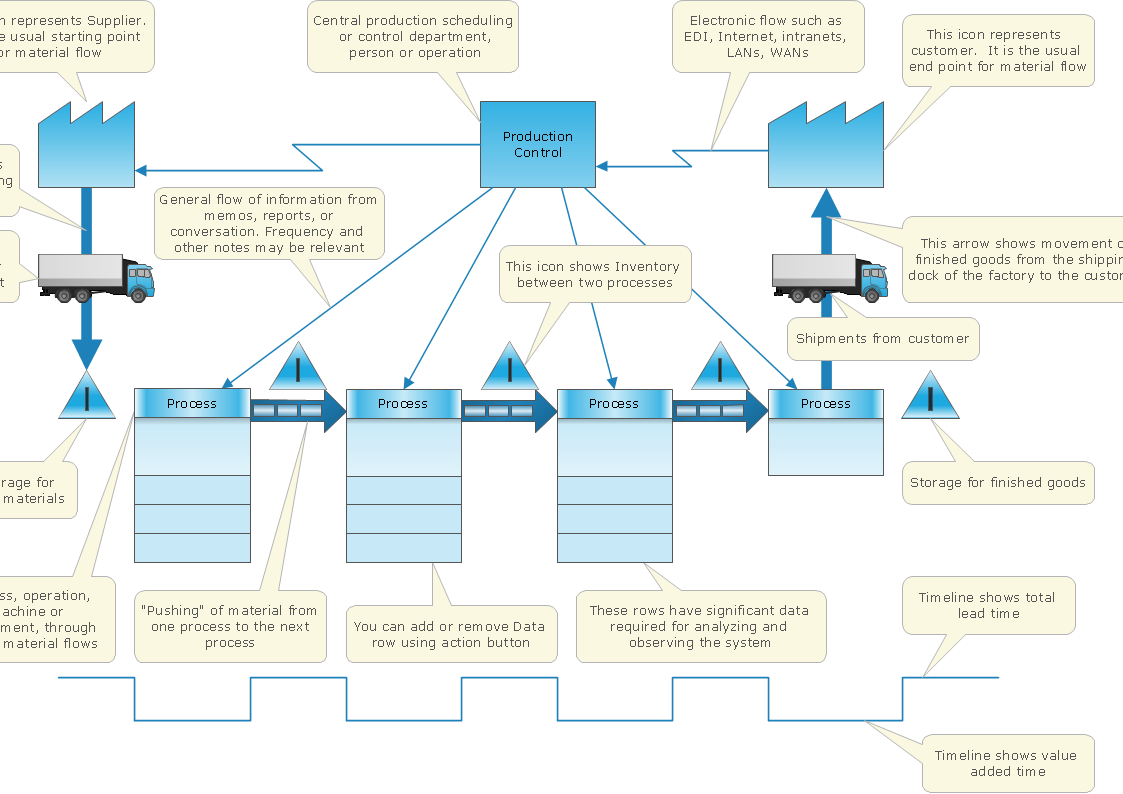
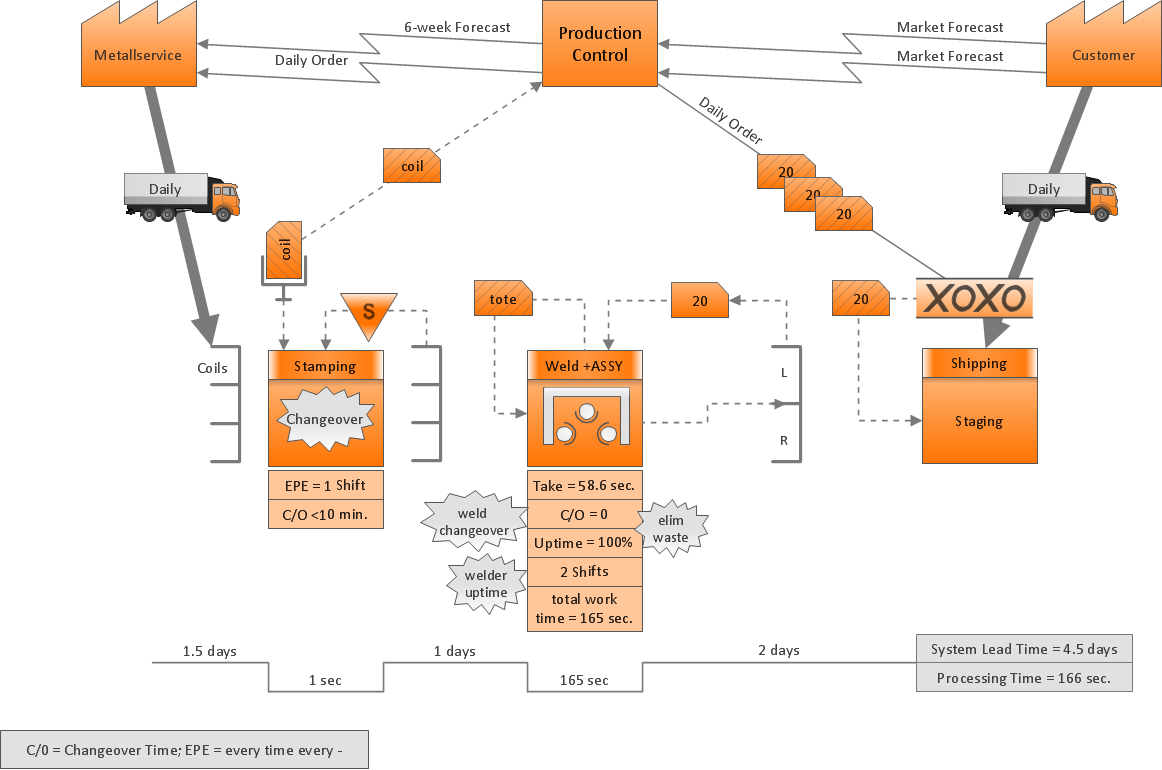
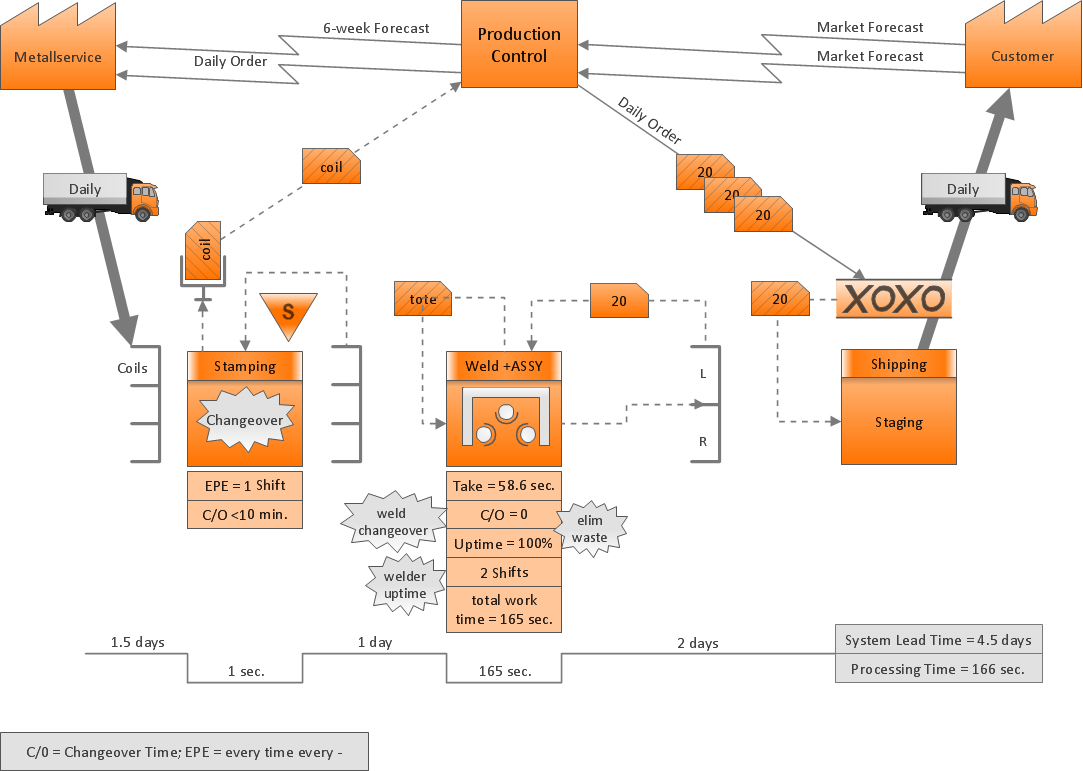
Value Stream Mapping is a Lean Manufacturing tool that uses a flow diagram to document in great detail every step of a manufacturing process. This graphical representation of a process is a powerful tool that helps in the diagnosis of process efficiency and allows companies to develop improved processes. Many lean practitioners use Value Stream Mapping as a fundamental tool to identify waste, cut process cycle times, and implement process improvement. Many organizations use value stream mapping as a key portion of their lean efforts. Value Stream Maps are used to analyze and design the flow of materials and information required to bring a product or service to a consumer. You can create a Value Stream Mapping flowchart using ConceptDraw DIAGRAM tools.
 Value Stream Mapping
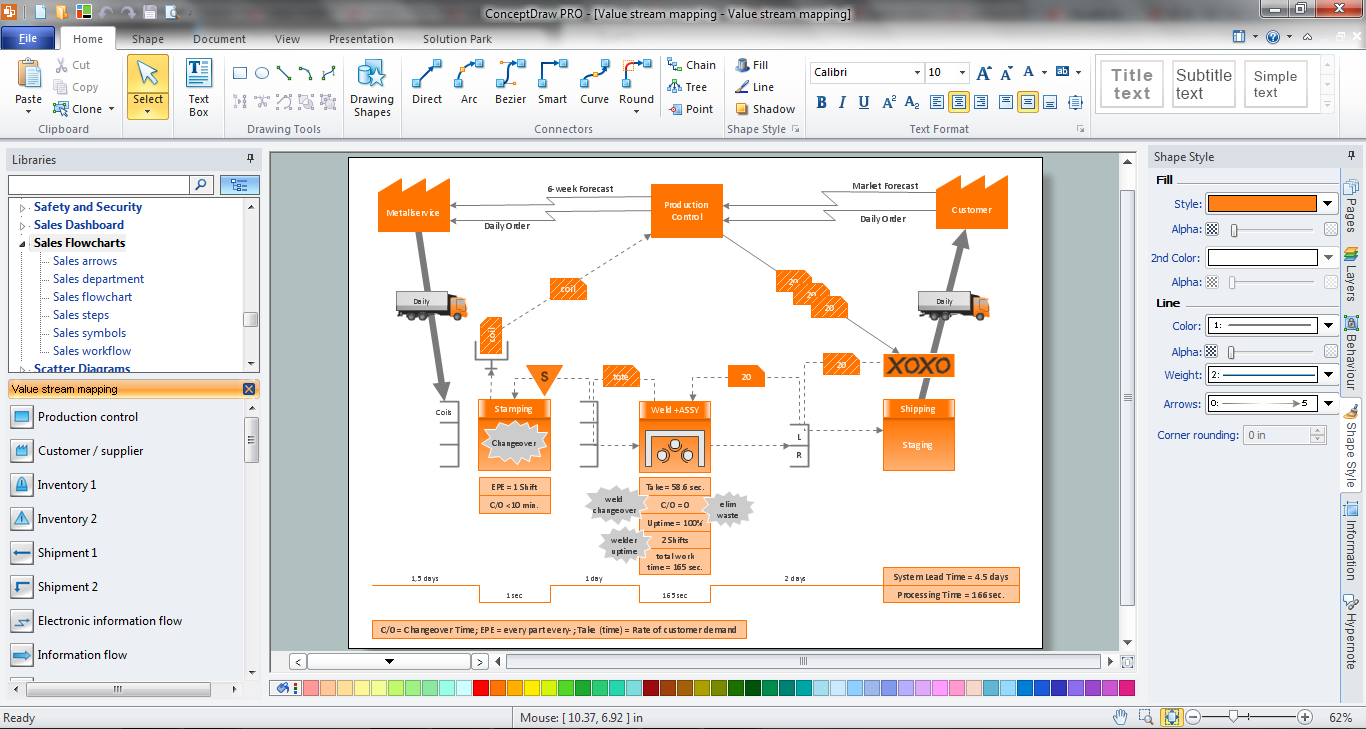
Value stream mapping solution extends ConceptDraw DIAGRAM software with templates, samples and vector stencils for drawing the Value Stream Maps (VSM) in lean manufacturing practice.
Value Stream Diagram
The new Value Stream Mapping solution found in the ConceptDraw Solution Park continues to extend the range of ConceptDraw DIAGRAM into a business graphics tool.Best Value Stream Mapping mac Software
Create value stream maps - for value stream analysis and value stream management, material and information flow mapping, using our quick start templates included with ConceptDraw.Value Stream Mapping Tool
Value Stream Mapping solution extends ConceptDraw DIAGRAM software with tools for drawing Value Stream Maps (VSM): templates, samples and library of vector stencils.Value Stream Mapping
Use ConceptDraw Value Stream Maps (VSM) visualization for a manufacturing plant the material and information flow required to deliver a product/service to customers. The new Value Stream Mapping solution found in the ConceptDraw Solution Park continues to extend the range of ConceptDraw DIAGRAM into a business graphics tool that can be used to document processes in any organization.Value Stream Mapping Software
ConceptDraw DIAGRAM is a best Value Stream Mapping software. The graphical representation of a process is a powerful tool that helps in the diagnosis of process efficiency and allows companies to develop improved processes. The new Value Stream Mapping solution found in the ConceptDraw Solution Park continues to extend the range of ConceptDraw DIAGRAM into a business graphics tool that can be used to document processes in any organization.
 ConceptDraw Solution Park
ConceptDraw Solution Park collects graphic extensions, examples and learning materials
Value stream with ConceptDraw DIAGRAM
The Value stream is a totality of all actions on the projection, order composition and production: starting from creation a product project to launching this product, from order to delivery, from extraction of raw materials to ready product manufacturing. Value stream mapping is a process of visualization of these actions and creation of a detailed and graphical map.VSM Template
ConceptDraw DIAGRAM a business graphics tool with professional designed VSM templates that can be used to document processes in any organization.What is Value Stream Mapping?
Value stream maps (VSM) are an essential tool for organizations applying Lean methods.Value Stream Mapping and Analysis
Value Stream Maps are used in lean methodology for analysis of manufacturing process and identification of the improvement opportunities.Value Stream Mapping for the Lean Office
Value Stream Mapping for the lean office is a tool that uses a flow diagram to document in great detail every step of a manufacturing process.Value Stream Analysis
ConceptDraw Value Stream Maps are used in lean practice for analysis of manufacturing processes to identify the improvement opportunities.Learn how to create a current state value stream map
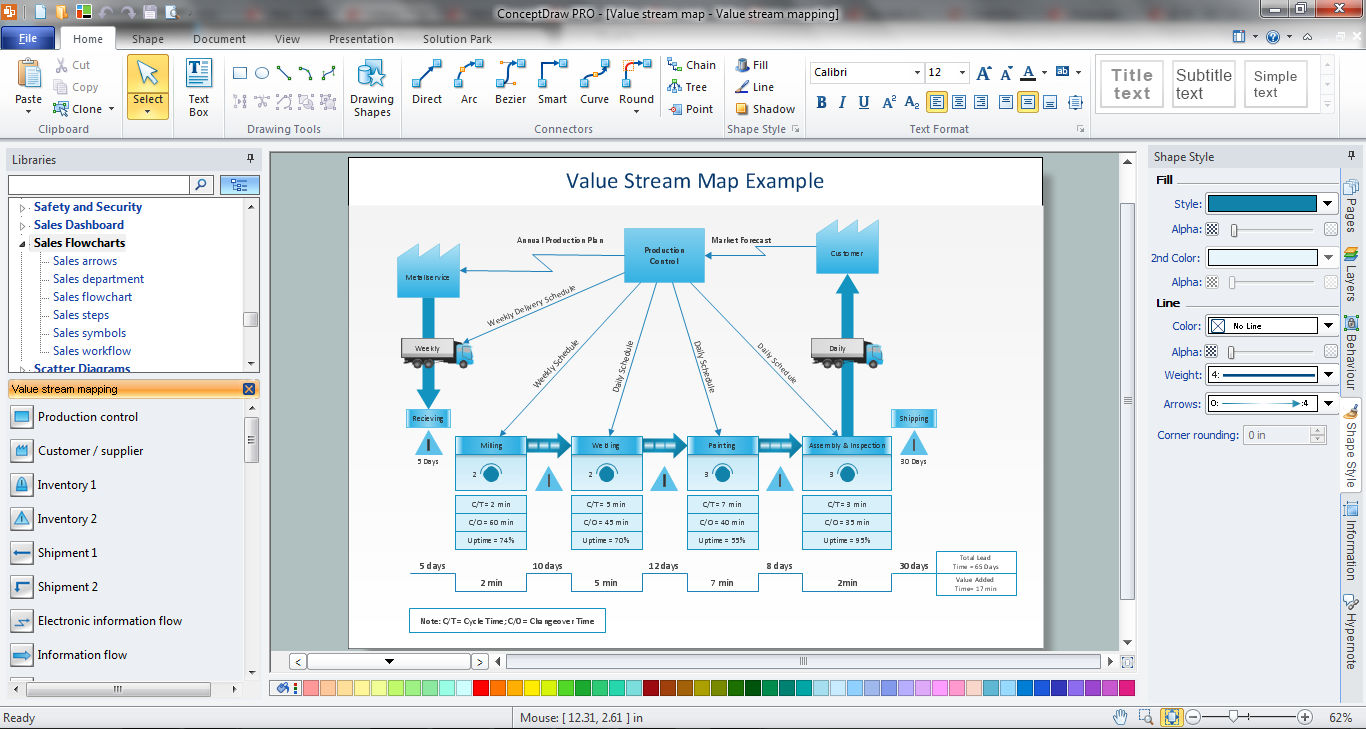
Value Stream Mapping solution extends ConceptDraw DIAGRAM software with templates, samples and vector shapes for drawing the current state value stream maps.Value Stream Mapping Icons
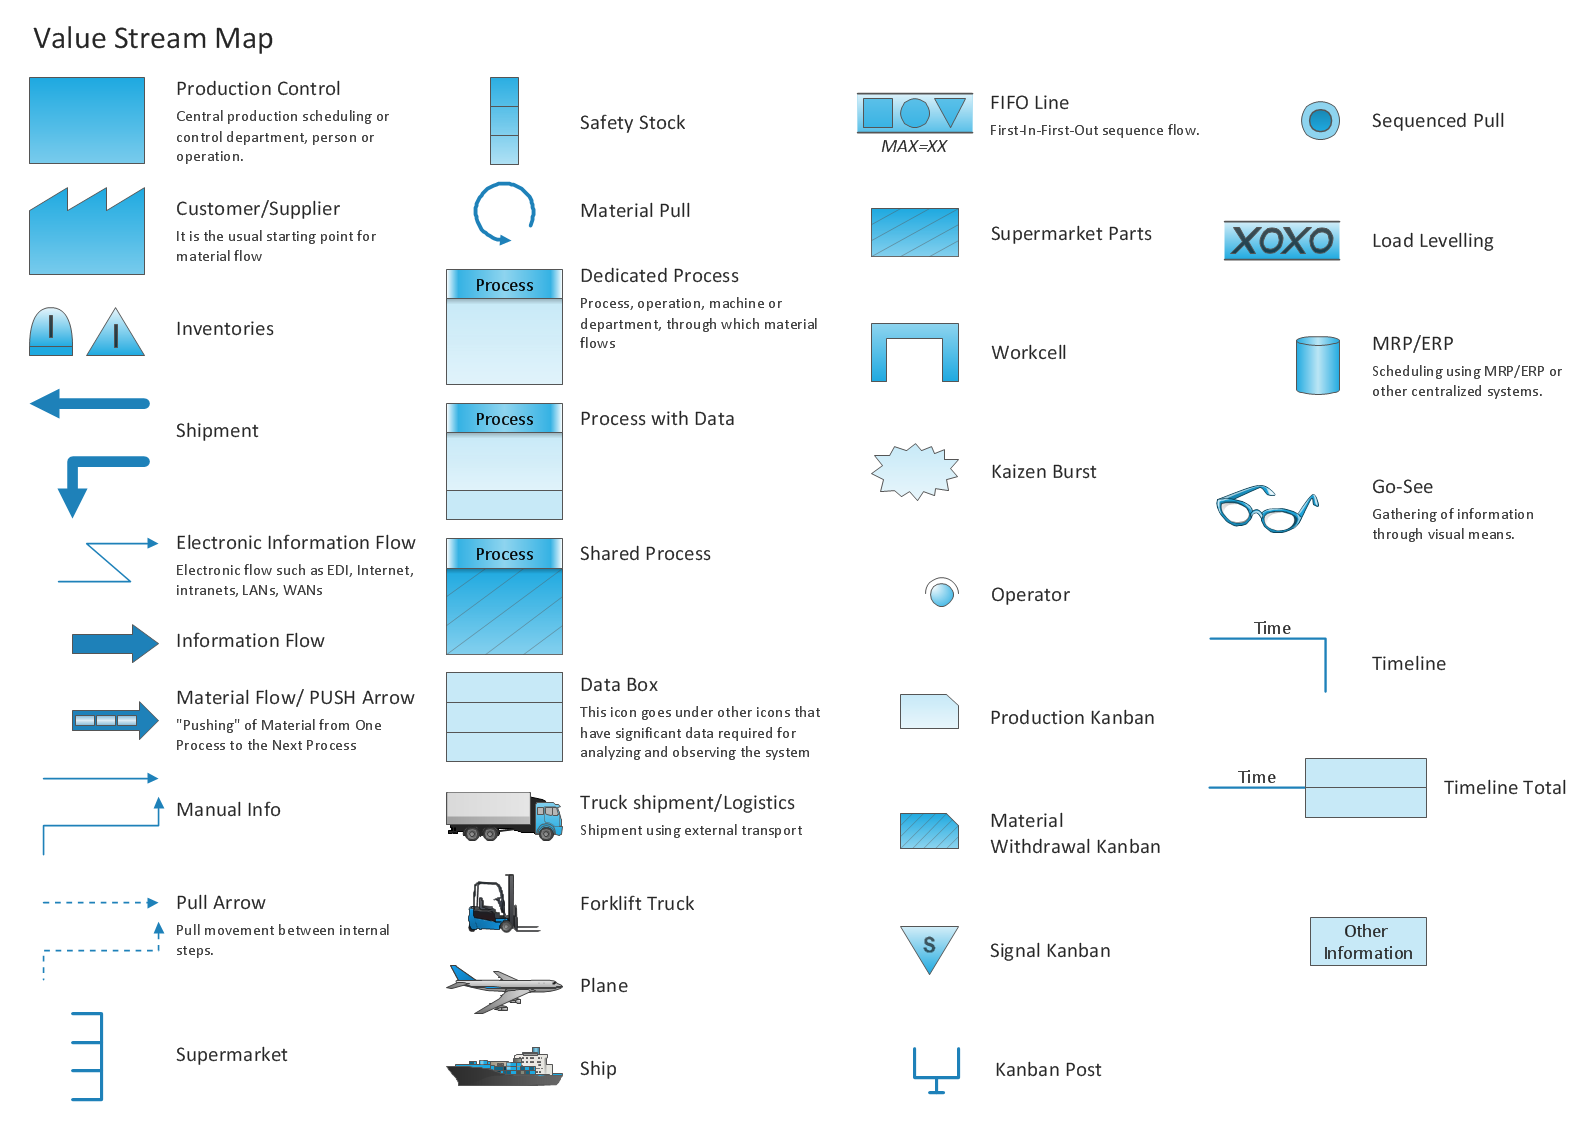
The library with 40 vector stencils is included in the ConceptDraw Value Stream Mapping solution.Value Stream Mapping Presentations
Users can create Value Stream Mapping Presentations using presentation mode in ConceptDraw DIAGRAM.Purposes of a Value Stream Management Tool
ConceptDraw Value Stream Maps visualize for a manufacturing plant the material and information flow required to deliver a product/service to customers.Business Diagram Software
When managing the projects, people, or networks, there are daily designed and used different types of Business diagrams, so the powerful drawing software will be very useful for this. ConceptDraw DIAGRAM with large quantity of business solutions will meet your needs and will help you convey your ideas successful and rapidly, no matter are you professional or beginner. It is the best choice for business specialists and technical professionals who need quickly and easily explore, visualize, and communicate information. ConceptDraw DIAGRAM business diagram software is the most powerful business software and relational charting software. Create advanced, completely customizable Business Process Diagrams, Business Flow Charts, Work Flow Diagrams, Organizational Charts, Audit diagrams, Marketing diagrams, Value Stream Maps, TQM diagrams, ERD diagrams, EPC diagrams, Cause and Effect diagrams, Infographics, Dashboards, and other Relational business diagrams from your data using the powerful drawing tools of ConceptDraw Solution Park.
- Fishbone Diagram | Manufacturing and Maintenance | Value Stream ...
- Timeline Diagrams | Value stream map example | Value stream ...
- Timeline diagram template | Design elements - Timelines solution ...
- Project timeline diagram - Conceptdraw.com
- Value Stream Diagram | What is Value Stream Mapping? | Sections ...
- Project timeline diagram
- Value stream map example | Timeline Diagrams | Communication ...
- Timeline Diagrams | Timeline diagram template | Timeline diagram ...
- Value stream map example | Marketing | Management |
- Value Stream Mapping | Entity-Relationship Diagram (ERD ...
- Value stream with ConceptDraw PRO | Lean Manufacturing ...
- Timeline Diagrams | Timeline diagram template | Project timeline ...
- Project Assigning Resources | Business Process Modeling ...
- Conceptual diagram of the Kanban System | Value stream mapping ...
- Timeline Diagrams | Timeline template | Timeline diagram |
- Design elements - Timelines solution | Timeline diagram template ...
- Project Assigning Resources | Business Process Modeling ...
- Project timeline diagram - New business project plan | Timeline ...
- Value Stream Mapping | PM Presentations | Quality |
- Sales Dashboard | Entity-Relationship Diagram (ERD) | Value ...
