Pyramid Diagram
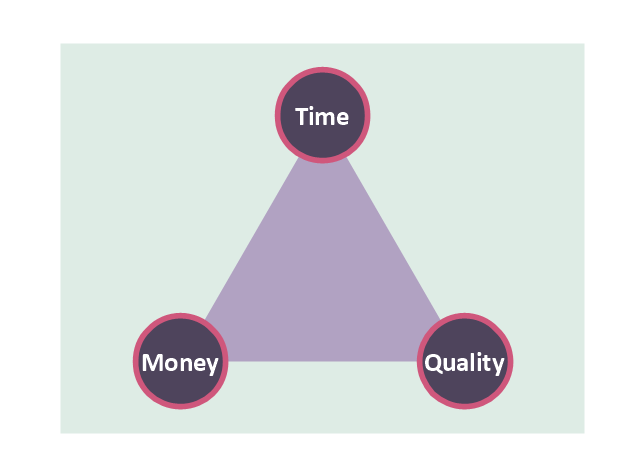
The Time-Money-Quality Triangle illustrates an advertising truism, that you can't have all three."The Time/ Money/ Quality Triangle illustrates an advertising truism, that "you can't have all three." If there is little time or money, then ad quality will suffer. The more time and/ or money that is available to the project, the higher the quality can be. However, the level of quality must be appropriate to the product...not all products should have high-quality ads!" [Advertising/ Strategies. Wikibooks]
This triangular diagram example was redesigned using the ConceptDraw PRO diagramming and vector drawing software from Wikimedia Commons file Time-Quality-Money.png. [commons.wikimedia.org/ wiki/ File:Time-Quality-Money.png]
This file is licensed under the Creative Commons Attribution-Share Alike 3.0 Unported license. [creativecommons.org/ licenses/ by-sa/ 3.0/ deed.en]
The chart sample "Time, quality, money triangle diagram" is included in the Pyramid Diagrams solution from the Marketing area of ConceptDraw Solution Park.
Seven Basic Tools of Quality - Histogram
A histogram is a chart which visually displays a distribution of numerical data. ConceptDraw PRO diagramming and vector drawing software offers a powerful Seven Basic Tools of Quality solution from the Quality area of ConceptDraw Solution Park which contains a set of useful tools for easy drawing Histogram and other quality related diagrams of any complexity.House of Quality Matrix Software
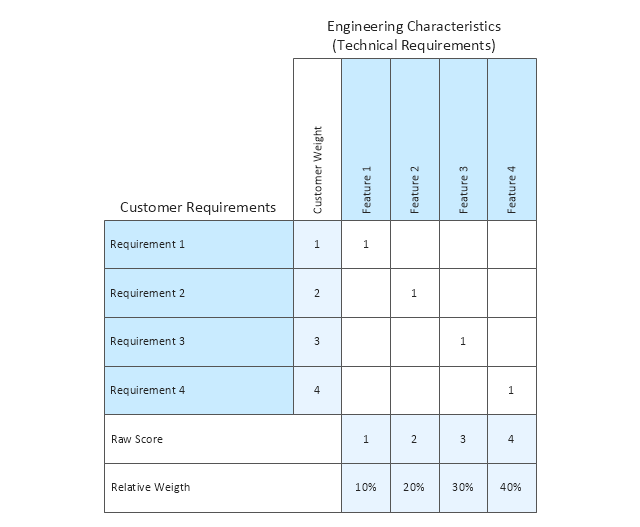
House of Quality Matrix Software - Use the predesigned objects from the Involvement Matrix Objects Library from the Seven Management and Planning Tools Solution to create professional looking House of Quality Matrices in minutes.Quality Management System
ConceptDraw PRO diagramming and vector drawing software extended with Total Quality Management (TQM) Diagrams solution from the Quality area of ConceptDraw Solution Park perfectly suits for development and visually representing a Quality Management System.Seven Basic Tools of Quality — Quality Control
ConceptDraw PRO diagramming and vector drawing software extended with Seven Basic Tools of Quality solution from the Quality area of ConceptDraw Solution Park provides effective tools for quality control and helps design any types of quality-related diagrams.Total Quality Management
ConceptDraw PRO diagramming and vector drawing software extended with Total Quality Management (TQM) Diagrams solution from the Quality area of ConceptDraw Solution Park is effective software for Total Quality Management.Quality Management Tools
ConceptDraw PRO diagramming and vector drawing software offers at your disposal quality management tools of the Total Quality Management (TQM) Diagrams solution from the Quality area of ConceptDraw Solution Park which will help facilitate a drawing diagrams process for quality management.Quality Control Chart Software — ISO Flowcharting
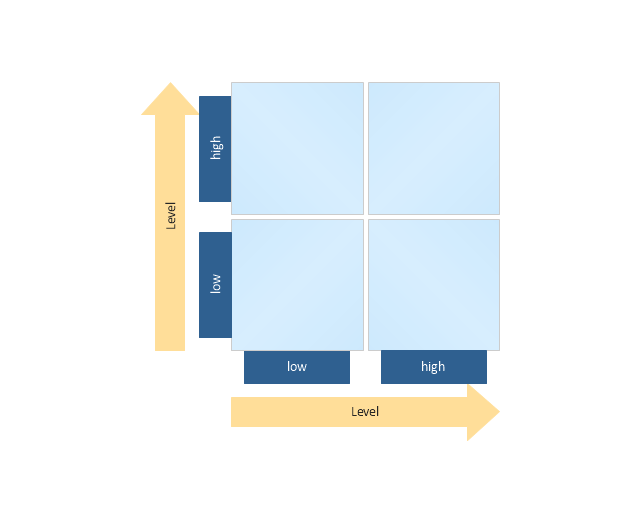
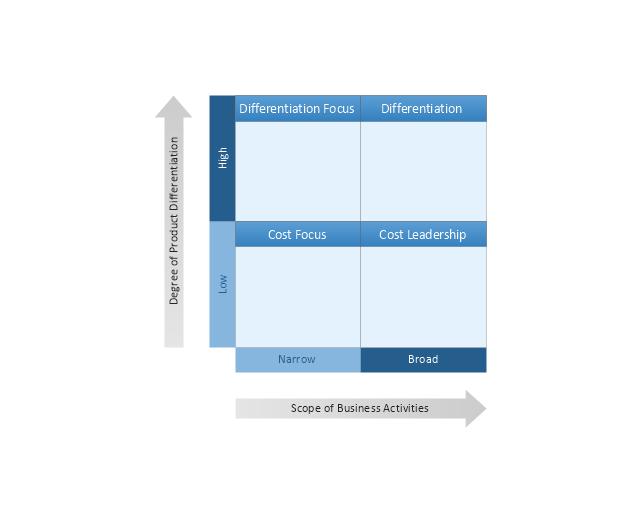
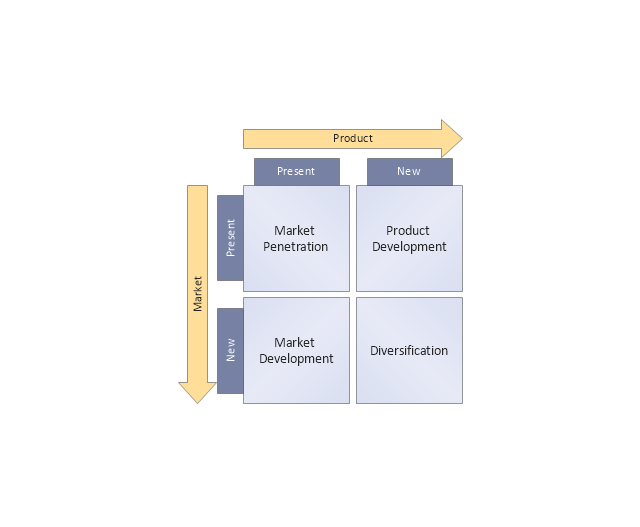
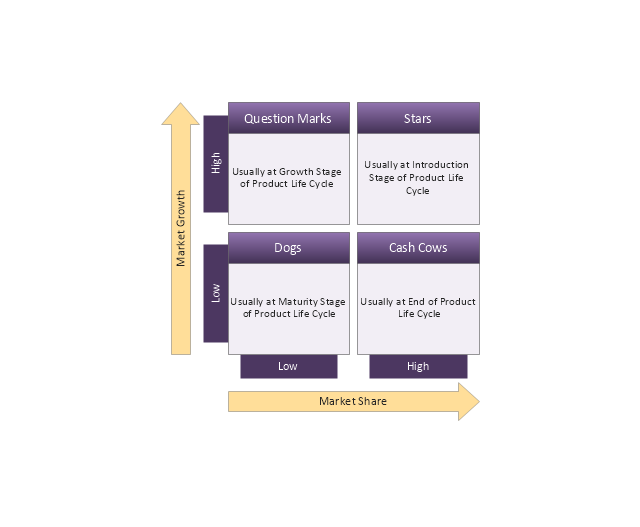
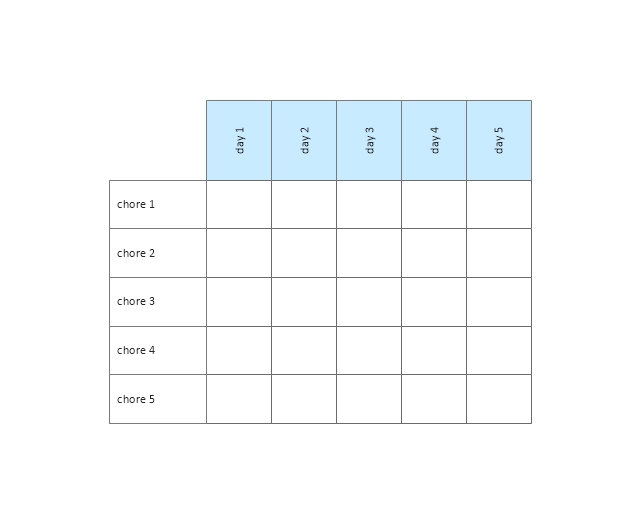
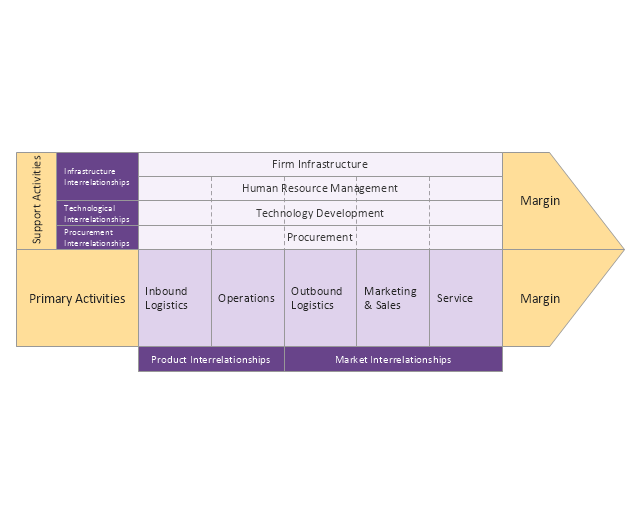
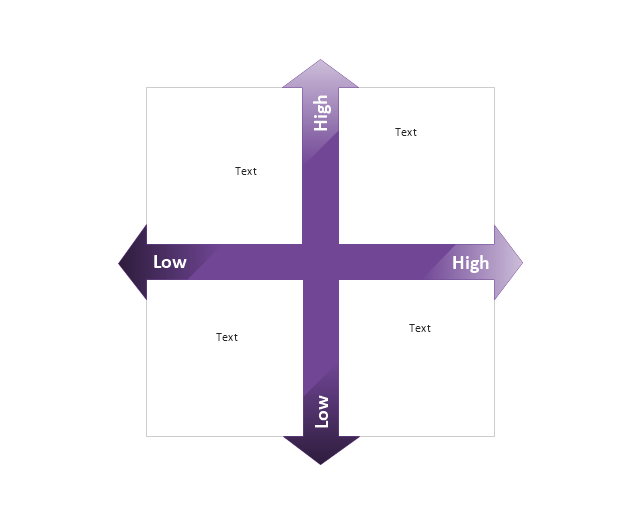
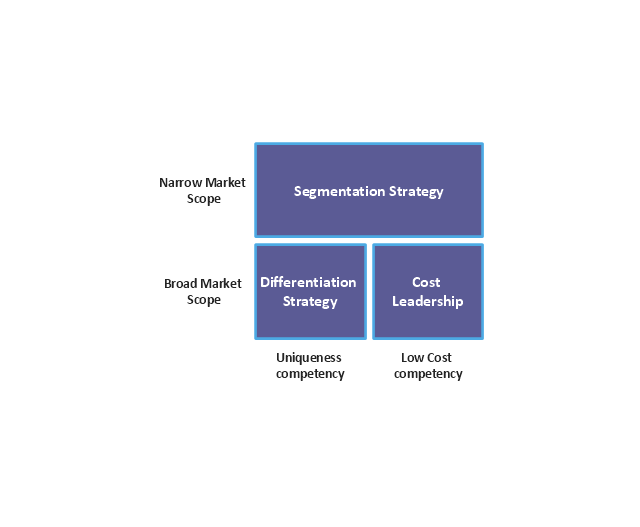
Quality Control Chart Software (ISO Flowcharting) - ConceptDraw PRO extended with Total Quality Management TQM Diagrams Solution from the Quality Management Area is the best diagramming and vector drawing software that allows you to draw the quality control charts quick and easy. The quality control chart is a graphic that illustrates the accordance of processes or products to the intended specifications and degree of differences from them. Depending on what type of data you need analyze, there are used different types of quality control charts: X-bar charts, S charts, Np charts.The vector stencils library "Matrices" contains 10 templates of marketing matrix diagrams and charts.
Use these templates to create your marketing matrices in the ConceptDraw PRO diagramming and vector drawing software extended with the Matrices solution from the Marketing area of ConceptDraw Solution Park.
Use these templates to create your marketing matrices in the ConceptDraw PRO diagramming and vector drawing software extended with the Matrices solution from the Marketing area of ConceptDraw Solution Park.
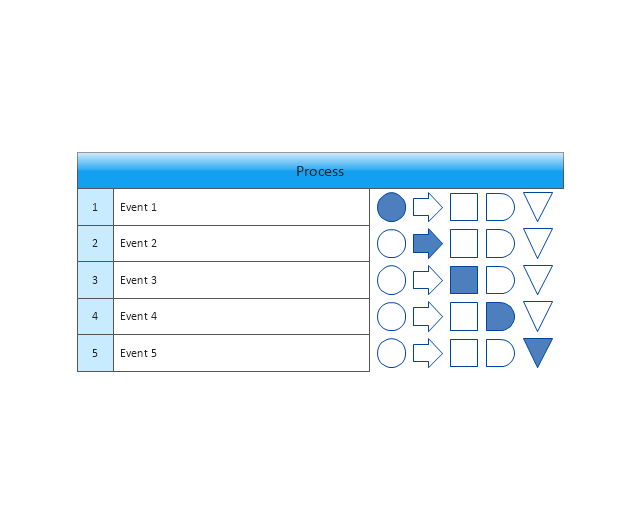
The vector stencils library "Workflow diagrams" contains 54 symbol icons of workflow diagrams.
The workflow diagrams represent information flow, automation of business processes, business process re-engineering, accounting, management, and human resources tasks in industry, business, and manufacturing.
Use this library to draw workflow diagrams in the ConceptDraw PRO diagramming and vector drawing software extended with the Workflow Diagrams solution from the Business Processes area of ConceptDraw Solution Park.
www.conceptdraw.com/ solution-park/ business-process-workflow-diagrams
Process Flowchart
The main reason of using Process Flowchart or PFD is to show relations between major parts of the system. Process Flowcharts are used in process engineering and chemical industry where there is a requirement of depicting relationships between major components only and not include minor parts. Process Flowcharts for single unit or multiple units differ in their structure and implementation. ConceptDraw PRO is Professional business process mapping software for making Process flowcharts, Process flow diagram, Workflow diagram, flowcharts and technical illustrations for business documents and also comprehensive visio for mac application. Easier define and document basic work and data flows, financial, production and quality management processes to increase efficiency of your business with ConcepDraw PRO. Business process mapping software with Flowchart Maker ConceptDraw PRO includes extensive drawing tools, rich examples and templates, process flowchart symbols and shape libraries, smart connectors that allow you create the flowcharts of complex processes, process flow diagrams, procedures and information exchange. Process Flowchart Solution is project management workflow tools which is part ConceptDraw Project marketing project management software. Drawing charts, diagrams, and network layouts has long been the monopoly of Microsoft Visio, making Mac users to struggle when needing such visio alternative like visio for mac, it requires only to view features, make a minor edit to, or print a diagram or chart. Thankfully to MS Visio alternative like ConceptDraw PRO software, this is cross-platform charting and business process management tool, now visio alternative for making sort of visio diagram is not a problem anymore however many people still name it business process visio tools.
TQM Tools
ConceptDraw PRO diagramming and vector drawing software enhanced with Total Quality Management (TQM) Diagrams solution from the Quality area of ConceptDraw Solution Park is rich for the useful and effective TQM tools.Cisco Network Templates
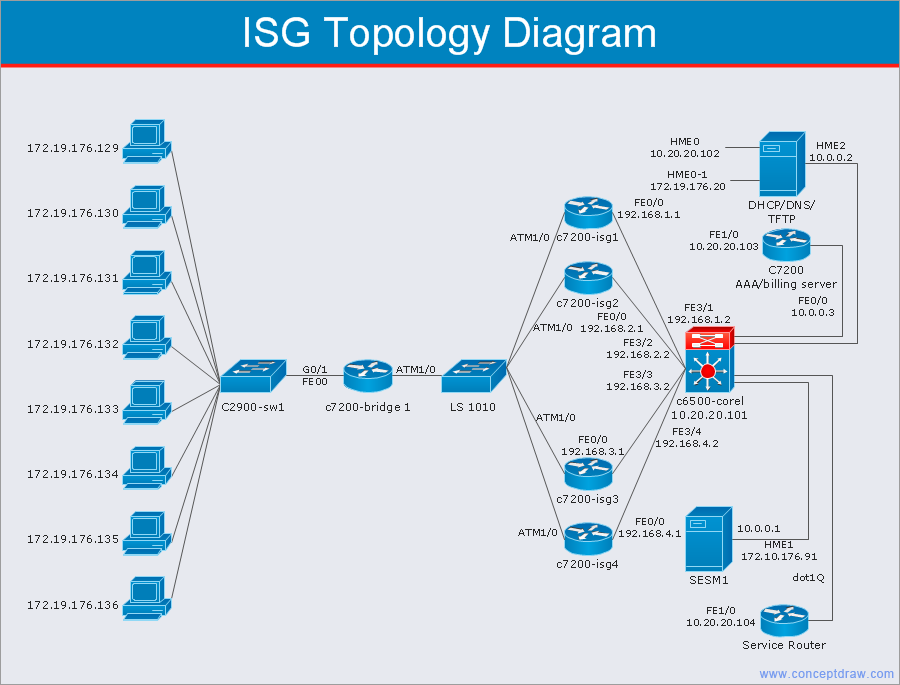
Cisco is a huge multinational company that develops and sells worldwide the]network equipment, mainly for large organizations and telecommunication companies. So, it has large number of enterprise clients in a corporate environment. Therefore many network engineers often draw the Network diagrams for Cisco hardware and are needed in a powerful vector drawing software. ConceptDraw PRO is ideal for this goal, enhanced with professional Cisco Network Diagrams solution from Computer and Networks area of ConceptDraw Solution Park it offers a wide variety of vector design objects libraries, samples and also large set of Cisco network templates. The use of templates is the easiest and time-saving way of drawing professional-looking diagrams and schematics. Use them to design Cisco Network Topologies, Cisco Network Diagrams, Cisco ISG Topology Diagrams, Cisco Express Forwarding Diagrams, Rack Diagrams, Network Organization Charts, Wireless Computer Network Diagrams, Vehicular Network Diagrams, and many other types of diagrams without efforts.
Probability Quality Control Tools
The Total Quality Management Diagram solution helps your organization visualize business and industrial processes. Create Total Quality Management diagrams for business process with ConceptDraw software.- Time Vector Png High Quality
- Money Vector Png
- Business people - Vector stencils library | Quality Management ...
- Pyramid Diagram | Time - Vector stencils library | Time, quality ...
- Png Money Vector
- Vector The Time Png
- Food Supplier Vehicle Vector Png
- Money Png Vector
- Uni Directional Approach Vector Icon Png
- Currency - Vector stencils library | Pyramid Diagram | Time, quality ...
- Investment Vector Png
- Business people - Vector stencils library | Business People Clipart ...
- Time Vector Image Png
- Exchange Money Png Vector
- Reception Service Car Vector Png
- Types of Flowcharts | Map symbols - Vector stencils library | Seven ...
- Staff Prod Vector Png
- Culture Presentation Vector Png
- Ads Vector Png
- Business Vector Png



-Diagram-in-SolutionBrowser.png)

