HelpDesk
How to Change the Timescale in a Gantt Chart View
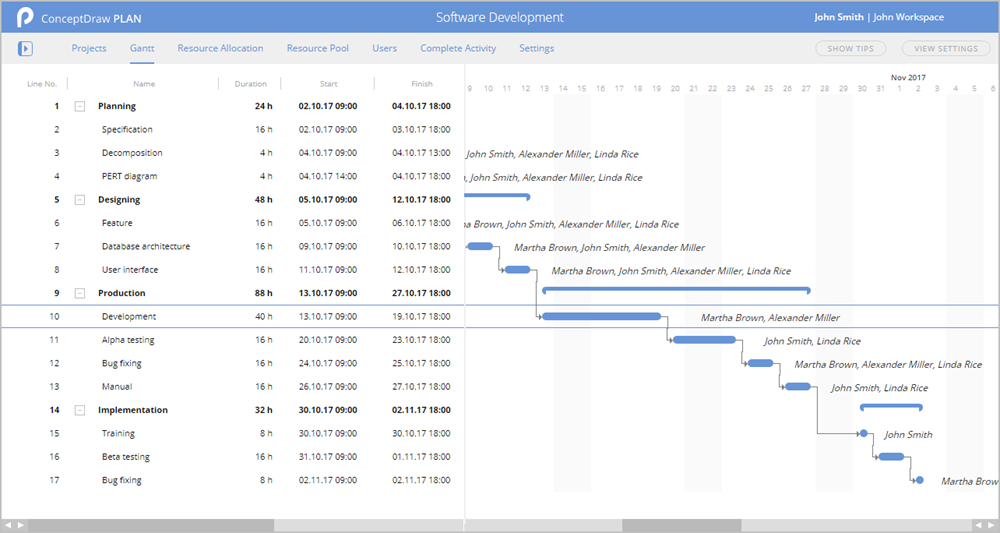
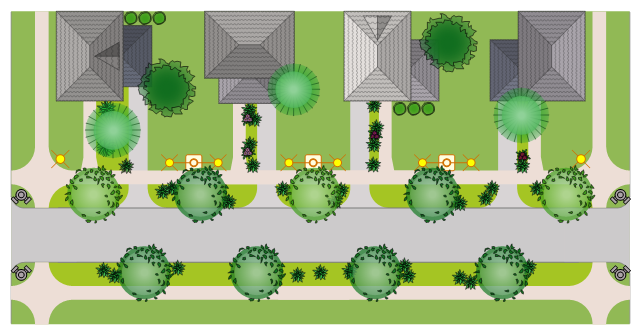
Most views in ConceptDraw PLAN have a timescale that shows the units of project time measurement (hour, day, week, etc.) used to schedule project tasks. You can change the timescale to view smaller or bigger time units, from hours all the way up to years. For example, you may want to show time in quarterы of the yearб or you may want to show Gantt chart across months and days.This residential quarter site planning sample illustrates the landscape and garden design.
"A site plan is a specific type of plan, showing the whole context of a building or group of buildings. A site plan shows property boundaries and means of access to the site, and nearby structures if they are relevant to the design. For a development on an urban site, the site plan may need to show adjoining streets to demonstrate how the design fits into the urban fabric. Within the site boundary, the site plan gives an overview of the entire scope of work. It shows the buildings (if any) already existing and those that are proposed, usually as a building footprint; roads, parking lots, footpaths, hard landscaping, trees and planting." [Architectural drawing. Wikipedia]
The landscape and garden design example "Residential quarter site plan" was created using the ConceptDraw PRO diagramming and vector drawing software extended with the Site Plans solution from the Building Plans area of ConceptDraw Solution Park.
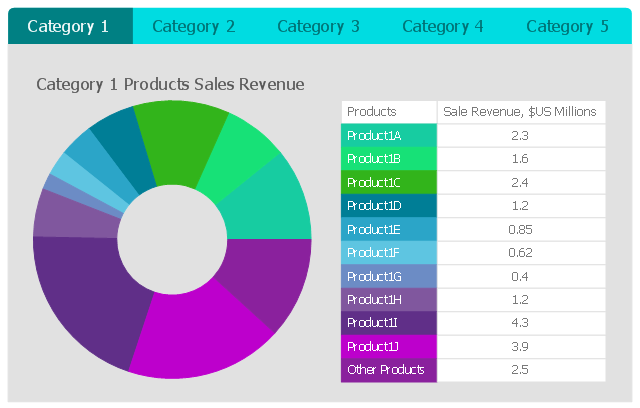
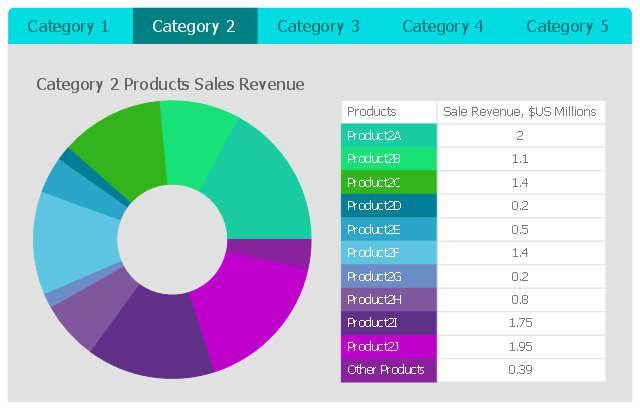
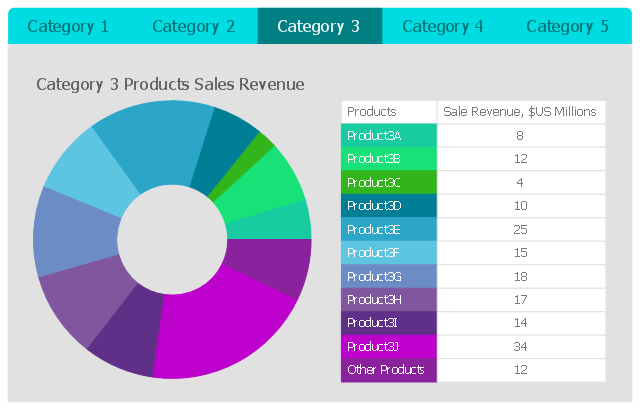
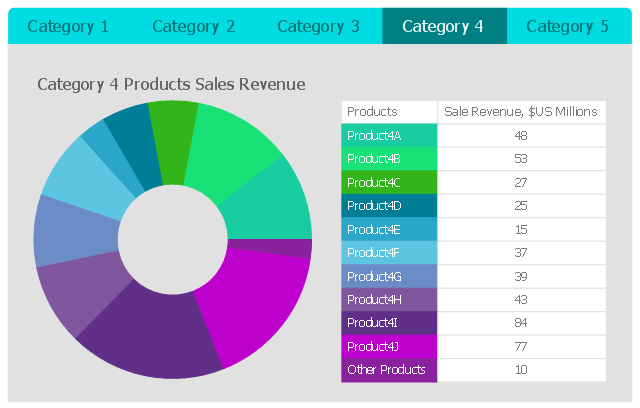
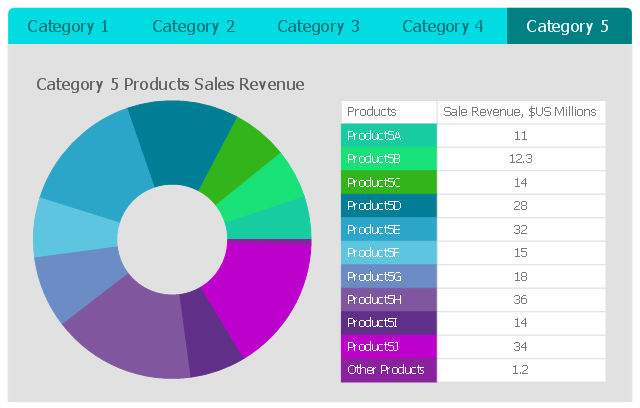
This business intelligence dashboard sample shows the quarter sales revenue for top 10 products by categories using donut charts.
"A doughnut chart (also spelled donut) is a variant of the pie chart, with a blank center allowing for additional information about the data as a whole to be included." [Pie chart. Wikipedia]
The BI dashboard example "Quarter Sales Revenue for Top 10 Products by Categories" was created using ConceptDraw PRO software extended with the Business Intelligence Dashboards solution from the Business Processes area of ConceptDraw Solution Park.
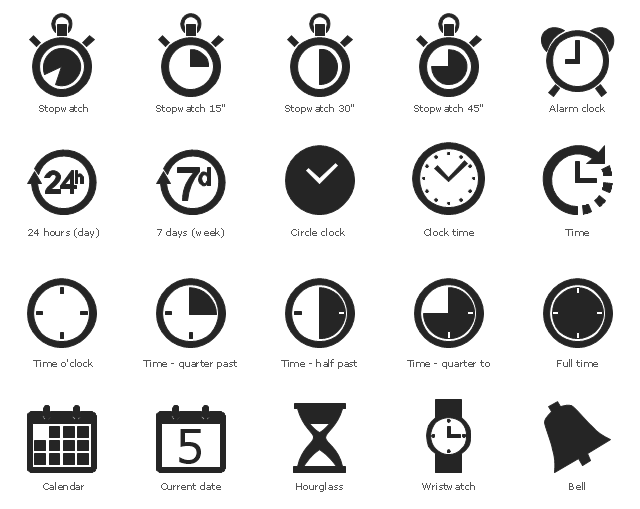
The vector stencils library "Time and clock pictograms" contains 20 time pictograms: clocks, calendars, day, week, bell, alarm clock, hourglass, wristwatch, and time intervals symbols.
Use it to create temporal infographic, illustrations and diagrams.
The example "Time and clock pictograms - Vector stencils library" was created using the ConceptDraw PRO diagramming and vector drawing software extended with the Pictorial infographics solution from the area "What is infographics" in ConceptDraw Solution Park.
The vector stencils library "Management" contains 20 management icons.
Use it to design your business and finance illustrations and infographics
with ConceptDraw PRO diagramming and vector drawing software.
The vector stencils library "Management" is included in the Business and Finance solution from the Illustration area of ConceptDraw Solution Park.
Use it to design your business and finance illustrations and infographics
with ConceptDraw PRO diagramming and vector drawing software.
The vector stencils library "Management" is included in the Business and Finance solution from the Illustration area of ConceptDraw Solution Park.
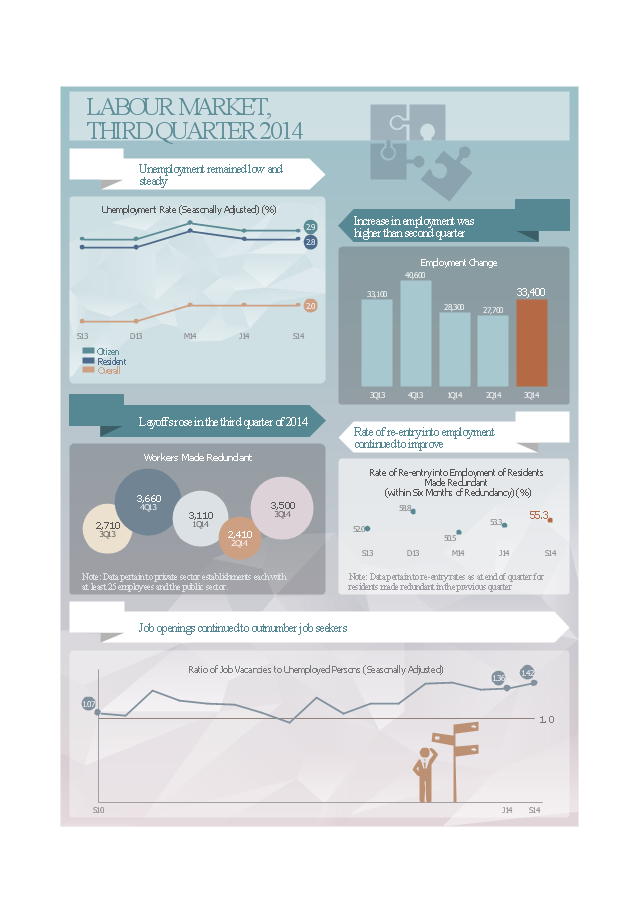
This example was designed on the base of "Infographic: Labour Market, Third Quarter 2014" from website of the Ministry of Manpower in the Government of Singapore.
"The labour market remained tight in the third quarter of 2014, with low unemployment rate and an improvement in long-term unemployment. The rate of re-entry into employment among residents made redundant continued to improve, amid higher layoffs from business restructuring."
[stats.mom.gov.sg/ Pages/ Infographic-Labour-Market-Third-Quarter-2014.aspx]
The management infogram sample "Labour market, 3rd quarter 2014" was created using the ConceptDraw PRO diagramming and vector drawing software extended with the Management Infographics solition from the area "Business Infographics" in ConceptDraw Solution Park.
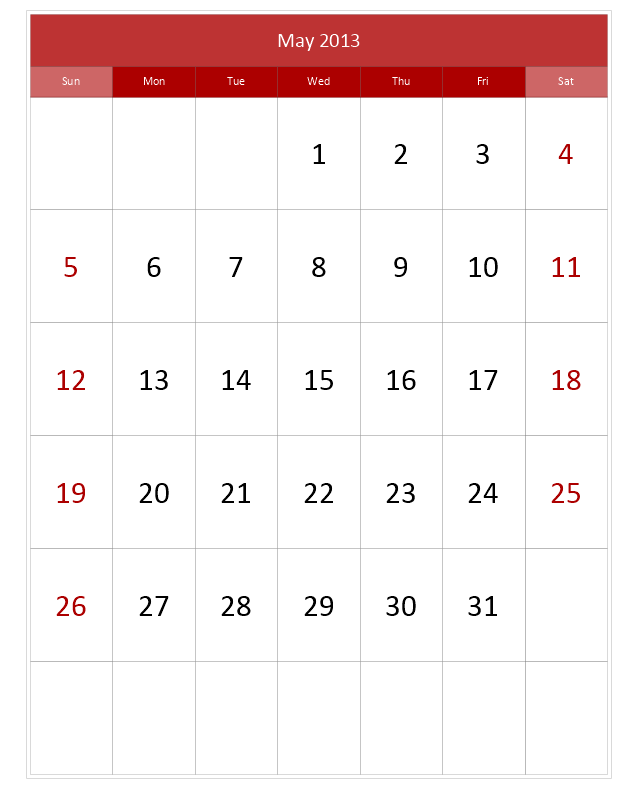
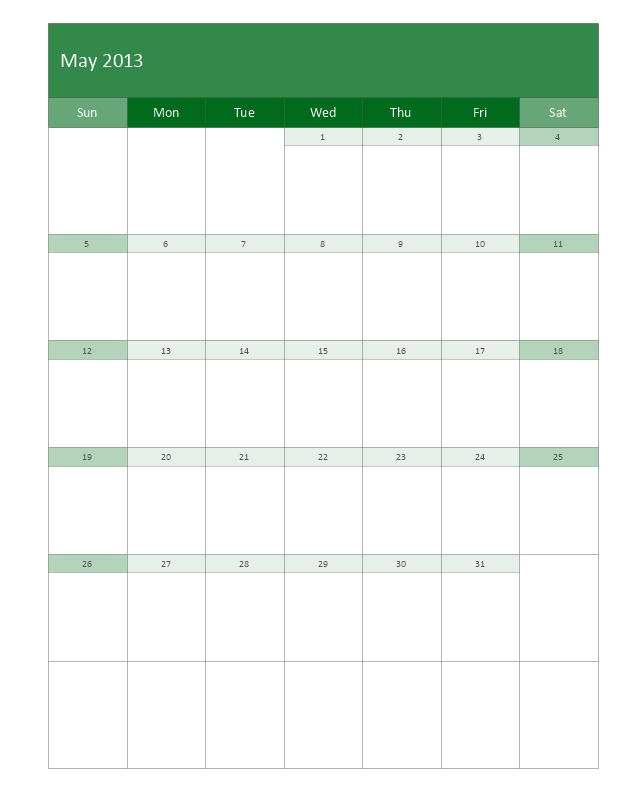
The vector stencils library "Calendars" contains 44 shapes of month calendars, marker icons and symbols for schedules, and clocks. Use it to create your calendars in the ConceptDraw PRO diagramming and vector drawing software extended with the Calendars solution from the Management area of ConceptDraw Solution Park.
The vector stencils library "Time and clock pictograms" contains 20 time pictograms: clocks, calendars, day, week, bell, alarm clock, hourglass, wristwatch, and time intervals symbols.
Use it to create temporal infographic, illustrations and diagrams.
The example "Time and clock pictograms - Vector stencils library" was created using the ConceptDraw PRO diagramming and vector drawing software extended with the Pictorial infographics solution from the area "What is infographics" in ConceptDraw Solution Park.
Use it to create temporal infographic, illustrations and diagrams.
The example "Time and clock pictograms - Vector stencils library" was created using the ConceptDraw PRO diagramming and vector drawing software extended with the Pictorial infographics solution from the area "What is infographics" in ConceptDraw Solution Park.
The vector stencils library "Time and clock pictograms" contains 20 time pictograms: clocks, calendars, day, week, bell, alarm clock, hourglass, wristwatch, and time intervals symbols.
Use it to create temporal infographic, illustrations and diagrams.
The pictograms example "Design elements - Time and clock pictograms" was created using the ConceptDraw PRO diagramming and vector drawing software extended with the Pictorial Infographic solution from the area "What is infographics" in ConceptDraw Solution Park.
- Staff Quarters Plans
- Floor Plan Of Staff Quarters
- Staff Quarters Design Floor Plan Pdf
- Head Quarters Network Diagram Examples
- Residential quarter site plan
- Quarter Sales Revenue for Top 10 Products by Categories
- Time - quarter past
- Time and clock pictograms - Vector stencils library
- Management - Vector stencils library
- Donut Chart Templates | Quarter Sales Revenue for Top 10 ...



























-calendars---vector-stencils-library.png--diagram-flowchart-example.png)
-calendars---vector-stencils-library.png--diagram-flowchart-example.png)
-calendars---vector-stencils-library.png--diagram-flowchart-example.png)
-calendars---vector-stencils-library.png--diagram-flowchart-example.png)
-calendars---vector-stencils-library.png--diagram-flowchart-example.png)
-calendars---vector-stencils-library.png--diagram-flowchart-example.png)
-calendars---vector-stencils-library.png--diagram-flowchart-example.png)
-calendars---vector-stencils-library.png--diagram-flowchart-example.png)
-calendars---vector-stencils-library.png--diagram-flowchart-example.png)
-calendars---vector-stencils-library.png--diagram-flowchart-example.png)
-calendars---vector-stencils-library.png--diagram-flowchart-example.png)

-calendars---vector-stencils-library.png--diagram-flowchart-example.png)


-calendars---vector-stencils-library.png--diagram-flowchart-example.png)
-calendars---vector-stencils-library.png--diagram-flowchart-example.png)
-calendars---vector-stencils-library.png--diagram-flowchart-example.png)
-calendars---vector-stencils-library.png--diagram-flowchart-example.png)
-calendars---vector-stencils-library.png--diagram-flowchart-example.png)
-calendars---vector-stencils-library.png--diagram-flowchart-example.png)
-calendars---vector-stencils-library.png--diagram-flowchart-example.png)
-calendars---vector-stencils-library.png--diagram-flowchart-example.png)
-calendars---vector-stencils-library.png--diagram-flowchart-example.png)
-calendars---vector-stencils-library.png--diagram-flowchart-example.png)
-calendars---vector-stencils-library.png--diagram-flowchart-example.png)
