This financila dashboard example was drawn on the base of the Enterprise dashboard from the Mecklenburg County Government website.
[charmeck.org/ mecklenburg/ county/ CountyManagersOffice/ OMB/ dashboards/ Pages/ Enterprise.aspx]
"In management information systems, a dashboard is "an easy to read, often single page, real-time user interface, showing a graphical presentation of the current status (snapshot) and historical trends of an organization’s key performance indicators to enable instantaneous and informed decisions to be made at a glance."
For example, a manufacturing dashboard may show key performance indicators related to productivity such as number of parts manufactured, or number of failed quality inspections per hour. Similarly, a human resources dashboard may show KPIs related to staff recruitment, retention and composition, for example number of open positions, or average days or cost per recruitment.
Types of dashboards.
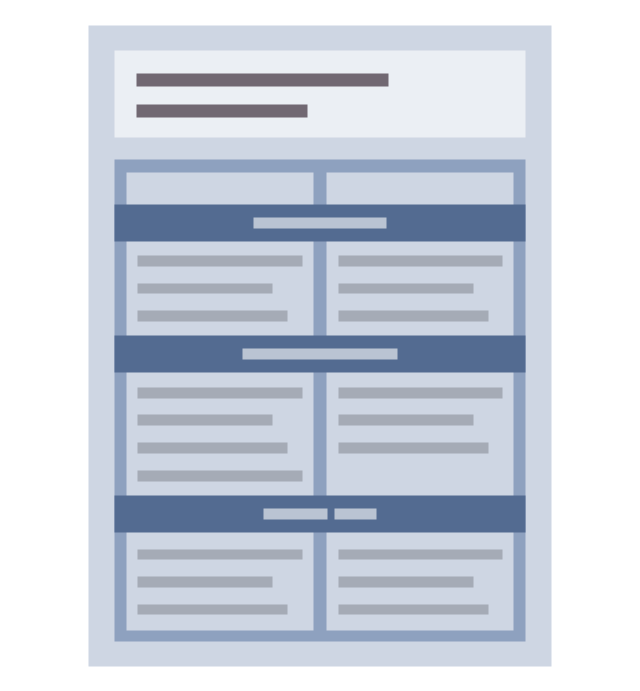
Dashboard of Sustainability screen shot illustrating example dashboard layout.
Digital dashboards may be laid out to track the flows inherent in the business processes that they monitor. Graphically, users may see the high-level processes and then drill down into low level data. This level of detail is often buried deep within the corporate enterprise and otherwise unavailable to the senior executives.
Three main types of digital dashboard dominate the market today: stand alone software applications, web-browser based applications, and desktop applications also known as desktop widgets. The last are driven by a widget engine.
Specialized dashboards may track all corporate functions. Examples include human resources, recruiting, sales, operations, security, information technology, project management, customer relationship management and many more departmental dashboards.
Digital dashboard projects involve business units as the driver and the information technology department as the enabler. The success of digital dashboard projects often depends on the metrics that were chosen for monitoring. Key performance indicators, balanced scorecards, and sales performance figures are some of the content appropriate on business dashboards." [Dashboard (management information systems). Wikipedia]
The example "Enterprise dashboard" was created using the ConceptDraw PRO diagramming and vector drawing software extended with the Composition Dashboard solution from the area "What is a Dashboard" of ConceptDraw Solution Park.
[charmeck.org/ mecklenburg/ county/ CountyManagersOffice/ OMB/ dashboards/ Pages/ Enterprise.aspx]
"In management information systems, a dashboard is "an easy to read, often single page, real-time user interface, showing a graphical presentation of the current status (snapshot) and historical trends of an organization’s key performance indicators to enable instantaneous and informed decisions to be made at a glance."
For example, a manufacturing dashboard may show key performance indicators related to productivity such as number of parts manufactured, or number of failed quality inspections per hour. Similarly, a human resources dashboard may show KPIs related to staff recruitment, retention and composition, for example number of open positions, or average days or cost per recruitment.
Types of dashboards.
Dashboard of Sustainability screen shot illustrating example dashboard layout.
Digital dashboards may be laid out to track the flows inherent in the business processes that they monitor. Graphically, users may see the high-level processes and then drill down into low level data. This level of detail is often buried deep within the corporate enterprise and otherwise unavailable to the senior executives.
Three main types of digital dashboard dominate the market today: stand alone software applications, web-browser based applications, and desktop applications also known as desktop widgets. The last are driven by a widget engine.
Specialized dashboards may track all corporate functions. Examples include human resources, recruiting, sales, operations, security, information technology, project management, customer relationship management and many more departmental dashboards.
Digital dashboard projects involve business units as the driver and the information technology department as the enabler. The success of digital dashboard projects often depends on the metrics that were chosen for monitoring. Key performance indicators, balanced scorecards, and sales performance figures are some of the content appropriate on business dashboards." [Dashboard (management information systems). Wikipedia]
The example "Enterprise dashboard" was created using the ConceptDraw PRO diagramming and vector drawing software extended with the Composition Dashboard solution from the area "What is a Dashboard" of ConceptDraw Solution Park.
Financial dashboard

Customer Relationship Management

Six Markets Model Chart

The vector stencils library "HR workflow" contains 60 HR workflow symbols.
Use this HR icon set to draw your HR flowcharts, workflow diagrams and process charts with the ConceptDraw PRO diagramming and vector drawing software.
The HR pictograms library "HR workflow" is included in the HR Flowcharts solution from the Management area of ConceptDraw Solution Park.
Use this HR icon set to draw your HR flowcharts, workflow diagrams and process charts with the ConceptDraw PRO diagramming and vector drawing software.
The HR pictograms library "HR workflow" is included in the HR Flowcharts solution from the Management area of ConceptDraw Solution Park.
Applicant

Award

Bank data
Blog

Business conference

Checklist
Compensation and benefits
Contract of employment
Cost planning and reporting
Credit plan
CV (resume, abstract)
-hr-workflow---vector-stencils-library.png--diagram-flowchart-example.png)
Disciplinary procedures
Employee man

Employee woman

Engage and retain

Family
Flexible spending account

Functions
Geolocation

Health plan

Hiring

Human resource

Human resources
Illness
Insurance

Job descriptions
Job offer

Job pricing

Job search

Leave

Manager

Meeting

Negotiation

Onboarding
Online application

Organizational assignment
Outsourcing
Overtime

Payment
Pensioner

Person specification
Personal data (badge icon)
-hr-workflow---vector-stencils-library.png--diagram-flowchart-example.png)
Personal profile

Personnel / staff / employees

Position / occupation

Reception
Recruitment
Remuneration (payment, salary, wage)
-hr-workflow---vector-stencils-library.png--diagram-flowchart-example.png)
Resume

Schedule

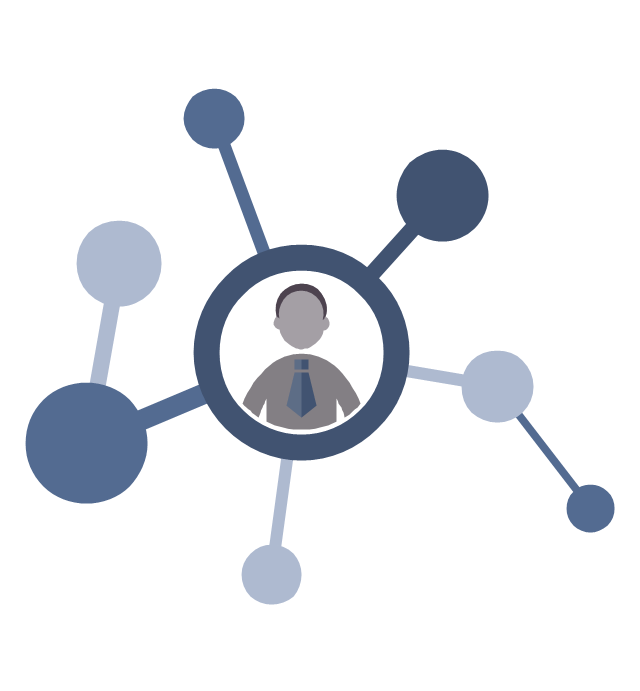
Social networks
Survey
Tax data

Team
Time evaluation

Time sheet
Time statement
Training
Vacancy

Vacant post
 Stakeholder Onion Diagrams
The Stakeholder Onion Diagram is often used as a way to view the relationships of stakeholders to a project goal. A basic Onion Diagram contains a rich information. It shows significance of stakeholders that will have has influence to the success achieve
- Recruitment Kpi Examples
- Recruitment Kpi Dashboard
- Kpi Of Recruitment
- KPI Dashboard | Enterprise dashboard | Business Graphics ...
- Recruiting Dashboards
- Recruitment Dashboard Templates
- KPI Dashboard | Sales Dashboard | Performance Indicators | Key ...
- Recruitment Status Dashboard
- KPI Dashboard | Enterprise dashboard | Visualize Sales Data Using ...
- Enterprise dashboard | KPI Dashboard | Logistic Dashboard ...
- Recruitment Dashboard Template
- Performance Indicators | Constant improvement of key performance ...
- KPI Dashboard | Enterprise dashboard | How to Use ConceptDraw ...
- Enterprise dashboard | KPI Dashboard | HR Flowcharts | Human ...
- Recruitment Dashboard Sample
- Graphical Kpis For Manufacturing
- Recruitment Tracking Process Graph
- Hr Recruitment Dashboard Template
- Enterprise dashboard | KPI Dashboard | Business Graphics ...
- KPIs and Metrics | Performance Indicators | What is a KPI ...