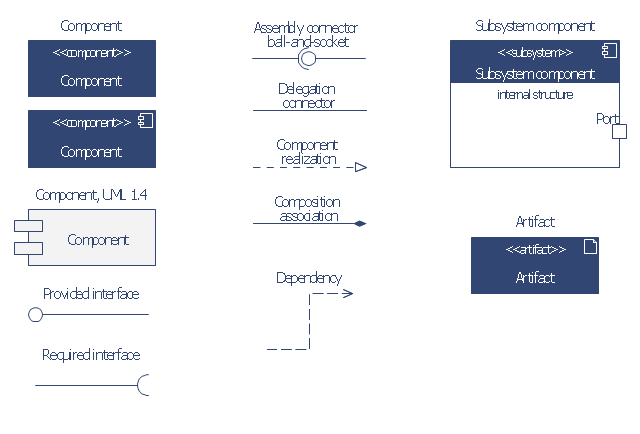
The vector stencils library "Bank UML component diagram" contains 13 shapes for drawing UML component diagrams.
Use it for object-oriented modeling of your bank information system.
"A component is something required to execute a stereotype function. Examples of stereotypes in components include executables, documents, database tables, files, and library files.
Components are wired together by using an assembly connector to connect the required interface of one component with the provided interface of another component. This illustrates the service consumer - service provider relationship between the two components. ...
When using a component diagram to show the internal structure of a component, the provided and required interfaces of the encompassing component can delegate to the corresponding interfaces of the contained components. ...
Symbols.
This may have a visual stereotype in the top right of the rectangle of a small rectangle with two even smaller rectangles jutting out on the left.
The lollipop, a small circle on a stick represents an implemented or provided interface. The socket symbol is a semicircle on a stick that can fit around the lollipop. This socket is a dependency or needed interface." [Component diagram. Wikipedia]
This example of UML component diagram symbols for the ConceptDraw PRO diagramming and vector drawing software is included in the ATM UML Diagrams solution from the Software Development area of ConceptDraw Solution Park.
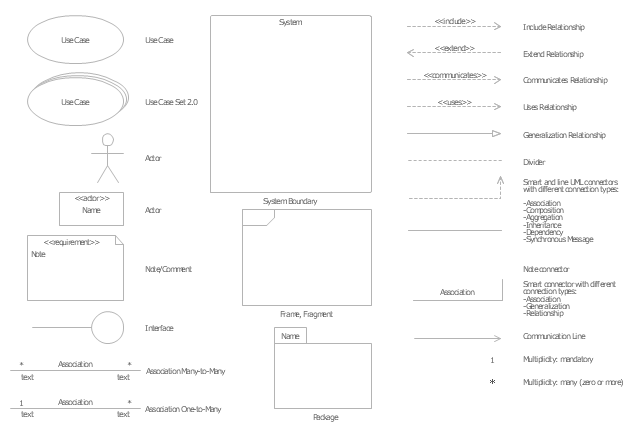
The vector stencils library "UML use case diagrams" contains 25 symbols for the ConceptDraw PRO diagramming and vector drawing software.
"Use case diagrams are usually referred to as behavior diagrams used to describe a set of actions (use cases) that some system or systems (subject) should or can perform in collaboration with one or more external users of the system (actors). Each use case should provide some observable and valuable result to the actors or other stakeholders of the system. ...
Use case diagrams are in fact twofold - they are both behavior diagrams, because they describe behavior of the system, and they are also structure diagrams - as a special case of class diagrams where classifiers are restricted to be either actors or use cases related to each other with associations. ...
Use case is usually shown as an ellipse containing the name of the use case. ...
Name of the use case could also be placed below the ellipse. ...
If a subject (or system boundary) is displayed, the use case ellipse is visually located inside the system boundary rectangle. Note, that this does not necessarily mean that the subject classifier owns the contained use cases, but merely that the use case applies to that classifier. ...
A list of use case properties - operations and attributes - could be shown in a compartment within the use case oval below the use case name. ...
Use case with extension points may be listed in a compartment of the use case with the heading extension points. ...
A use case can also be shown using the standard rectangle notation for classifiers with an ellipse icon in the upper right-hand corner of the rectangle and with optional separate list compartments for its features. ...
Subject (sometimes called a system boundary) is presented by a rectangle with subject's name, associated keywords and stereotypes in the upper left corner. Use cases applicable to the subject are located inside the rectangle and actors - outside of the system boundary. ...
Standard UML notation for actor is "stick man" icon with the name of the actor above or below of the icon. Actor names should follow the capitalization and punctuation guidelines for classes. The names of abstract actors should be shown in italics. ...
Custom icons that convey the kind of actor may also be used to denote an actor, such as using a separate icon(s) for non-human actors. ...
An actor may also be shown as a class rectangle with the standard keyword «actor», having usual notation for class compartments ...
An actor can only have binary associations to use cases, components, and classes. ...
An association between an actor and a use case indicates that the actor and the use case somehow interact or communicate with each other.
Only binary associations are allowed between actors and use cases.
An actor could be associated to one or several use cases. ...
A use case may have one or several associated actors." [uml-diagrams.org/ use-case-diagrams.html]
The example "Design elements - UML use case diagrams" is included in the Rapid UML solution from the Software Development area of ConceptDraw Solution Park.
HelpDesk
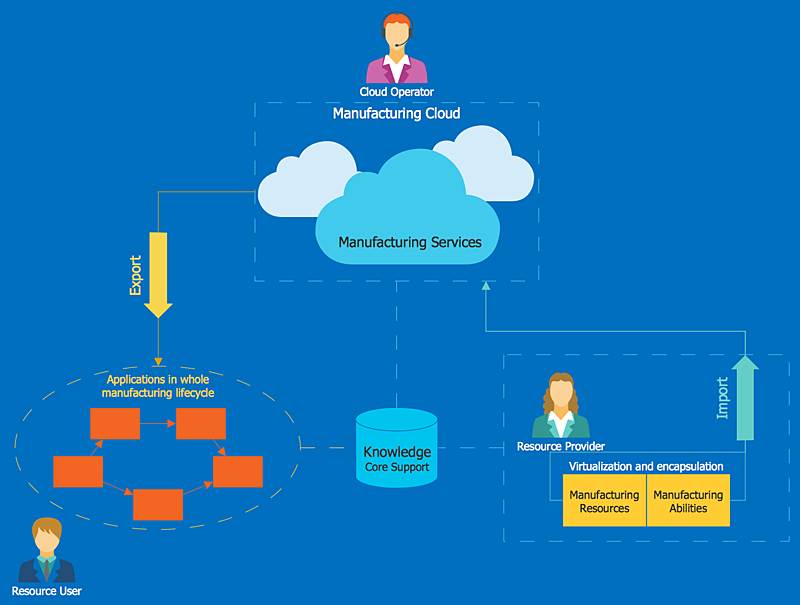
How to Create a Cloud Computing Diagram Using ConceptDraw PRO
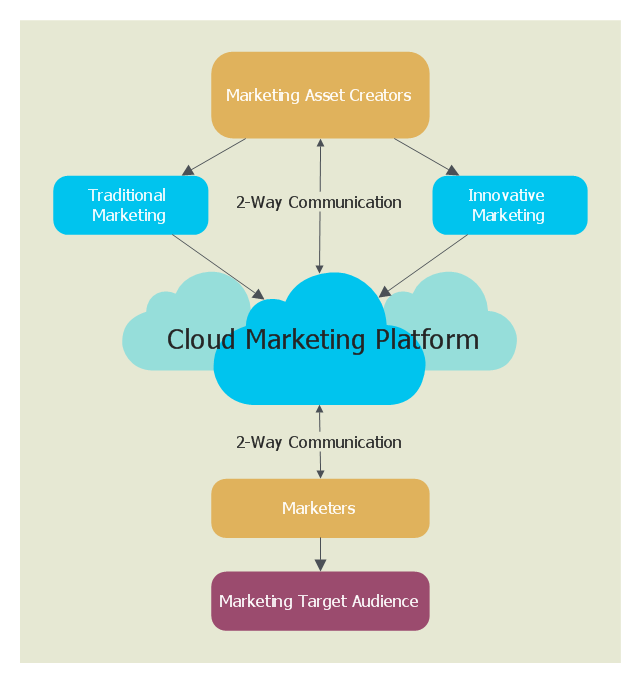
Cloud computing is a model of remote access to shared computing resources that are physically distributed in many remote devices. Cloud Computing is a technology that allows to use the Internet to place computing resources and the provision of such services to customers. Using cloud computing means assigning responsibilities on applications and data storage service among special systems, which have a very high level of reliability and unlimited resources. The result is reducing the cost of service, and to providing users with ready-to-use service. ConceptDraw's Cloud Computing Diagrams solution allows you to visualize cloud computing models of any configuration and complexity.This cloud computing diagram example was drawn on the base of Wikimedia Commons file: CloudMarketingDiagram.png. [commons.wikimedia.org/ wiki/ File:CloudMarketingDiagram.png]
This file is licensed under the Creative Commons Attribution 3.0 Unported license. [creativecommons.org/ licenses/ by/ 3.0/ deed.en]
"Cloud marketing is the process of an organisations efforts to market their goods and services online through integrated digital experiences, by which they are specialised for every single end user. The aim is to use advertising methods to target customers via online applications through social media websites such as Facebook, Twitter and various online portals to target consumers. Cloud marketing platforms are supported with third parties which maintain the platform." [Cloud marketing. Wikipedia]
The example "Cloud marketing diagram" was drawn using ConceptDraw PRO software extended with the Cloud Computing Diagrams solution from the Computer and Networks area of ConceptDraw Solution Park.
HelpDesk
How to Draw a Divided Bar Chart in ConceptDraw PRO
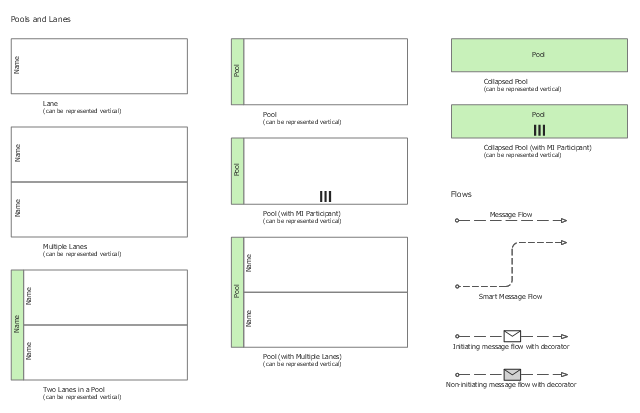
A divided bar graph is a rectangle divided into smaller rectangles along its length in proportion to the data. Segments in a divided bar represent a set of quantities according to the different proportion of the total amount. A divided bar diagram is created using rectangular bars to depict proportionally the size of each category. The bars in a divided bar graph can be vertical or horizontal. The size of the each rectangle displays the part that each category represents. The value of the exact size of the whole must be known, because the each section of the bar displays a piece of that value. A divided bar diagram is rather similar to a sector diagram in that the bar shows the entire data amount and the bar is divided into several parts to represent the proportional size of each category. ConceptDraw PRO in conjunction with Divided Bar Diagrams solution provides tools to create stylish divided bar charts for your presentations.The vector stencils library "Swimlanes" contains 20 swimlane shapes for drawing business process diagrams (BPMN 2.0) using the ConceptDraw PRO diagramming and vector drawing software.
"Swim lanes are a visual mechanism of organising and categorising activities, based on cross functional flowcharting, and in BPMN consist of two types: (1) Pool. Represents major participants in a process, typically separating different organisations. A pool contains one or more lanes (like a real swimming pool). A pool can be open (i.e., showing internal detail) when it is depicted as a large rectangle showing one or more lanes, or collapsed (i.e., hiding internal detail) when it is depicted as an empty rectangle stretching the width or height of the diagram. (2) Lane. Used to organise and categorise activities within a pool according to function or role, and depicted as a rectangle stretching the width or height of the pool. A lane contains the flow objects, connecting objects and artifacts." [Business Process Model and Notation. Wikipedia]
The example "Design elements - Swimlanes BPMN 2.0" is included in the Business Process Diagram solution from the Business Processes area of ConceptDraw Solution Park.
- Divided Bar Diagrams | Competitor Analysis | Divided Rectangle ...
- Entity Relationship Diagram Symbols | ERD Symbols and Meanings ...
- Basic Divided Bar Diagrams | Competitor Analysis | Education ...
- Interpretation Of Divided Rectangle Diagram In Geography
- Basic Flowchart Symbols and Meaning | Divided Bar Diagrams ...
- Swim Lane Diagrams | Language Learning | Chemistry | Compound ...
- How To Draw A Divided Rectangle
- Basic Divided Bar Diagrams | Competitor Analysis | Geo Map ...
- Divided Rectangle Graph
- Divide Rectangle Is Diagram
- Steps Used To Draw Divided Rectangle
- Basic Flowchart Symbols and Meaning | Divided Bar Diagrams ...
- Diagram Square Round Rectangle Kids
- Entity Relationship Diagram Symbols | ERD Symbols and Meanings ...
- What Is Called Divided Rectangle Diagram
- Advantages Of Divided Rectangle Graph
- Advantages Of Divided Rectangle Bar Graph
- Uml Diagram Rectangle Class
- Divided Rectangle Diagram On Graph
- Competitor Analysis | Divided Bar Diagrams | Pictures Of Divided ...
