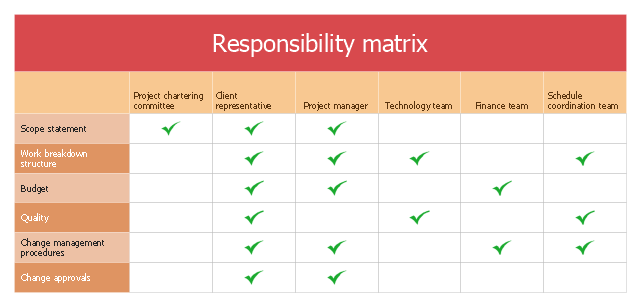
The responsibility matrix depicts key actions and decisions, main stakeholders and key responsibilities. Key activities are listed in the left most column, in approximate sequential order. Key stakeholders are listed as column headings above the next set of columns. For each row of action steps, a symbol is shown in the column for relevant stakeholders indicating who has responsibility for the step, who is involved. [anao.gov.au/ html/ Files/ BPG HTML/ Developing and Managing Contracts/ 2_ action_ matrix.html]
The involvement matrix example "Distribution of responsibilities" was created using the ConceptDraw PRO diagramming and vector drawing software extended with the solution "Seven Management and Planning Tools" from the Management area of ConceptDraw Solution Park.
The involvement matrix example "Distribution of responsibilities" was created using the ConceptDraw PRO diagramming and vector drawing software extended with the solution "Seven Management and Planning Tools" from the Management area of ConceptDraw Solution Park.
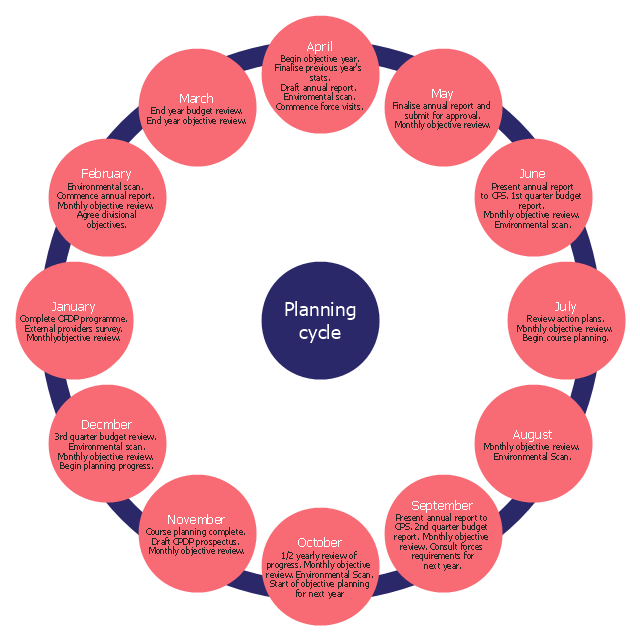
The cycle diagram sample was created on the base of the figure illustrating the webpage "2. POLICY & STRATEGY" of "Scottish Police College Primary Inspection 2006: A Report by Her Majesty's Inspectorate of Constabulary" from the Scottish Government website.
"Strategic Planning.
2.1 The planning process for the College currently follows a structured approach, starting in April and extending through the financial year. The planning cycle is illustrated in figure 2. ...
2.2 The College recognises the need to consult with its customers and stakeholders in the process of setting objectives and directing the training programme. The planning cycle to date refers to force visits, environmental scanning, the course planning process which involves consultation with all forces and other common police services, as well as to a survey of external providers.
2.3 The information from consultation feeds into an EFQM framework from which the College has identified four key policies, namely:
(1) developing and delivering quality training;
(2) developing our people through lifelong learning;
(3) continuous improvement of our service; and
(4) embracing the changing environment.
2.4 The objectives set at divisional level are designed to contribute to delivering these policies. HMIC found that whilst the selected objectives were presented in line with the structure, not all could be considered to meet SMART (Specific, Measurable, Achievable, Relevant and Timed) criteria. This failure indicates that while the process appears suitably structured to deliver a robust result, some of those involved could perhaps have a better understanding of the process." [scotland.gov.uk/ Publications/ 2007/ 02/ 15134652/ 8]
The cycle diagram example "Strategic planning" was created using the ConceptDraw PRO diagramming and vector drawing software extended with the Target and Circular Diagrams solution from the Marketing area of ConceptDraw Solution Park.
www.conceptdraw.com/ solution-park/ marketing-target-and-circular-diagrams
 ConceptDraw Solution Park
ConceptDraw Solution Park collects graphic extensions, examples and learning materials
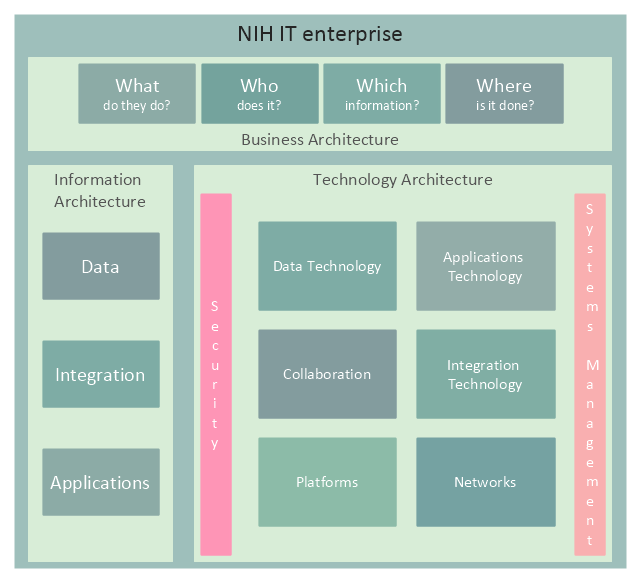
This enterprise architecture diagram sample was redesigned from the illustration of the NIH Enterprise Architecture website. [enterprisearchitecture.nih.gov/ Pages/ Framework.aspx]
"Enterprise architecture is a comprehensive framework used to manage and align an organization's Information Technology (IT) assets, people, operations, and projects with its operational characteristics. In other words, the enterprise architecture defines how information and technology will support the business operations and provide benefit for the business.
It illustrates the organization’s core mission, each component critical to performing that mission, and how each of these components is interrelated. These components include:
(1) Guiding principles,
(2) Organization structure,
(3) Business processes,
(4) People or stakeholders,
(5) Applications, data, and infrastructure,
(6) Technologies upon which networks, applications and systems are built.
Guiding principles, organization structure, business processes, and people don’t sound very technical. That’s because enterprise architecture is about more than technology. It is about the entire organization (or enterprise) and identifying all of the bits and pieces that make the organization work." [enterprisearchitecture.nih.gov/ Pages/ what.aspx]
The example "NIH IT enterprise architecture framework" was created using the ConceptDraw PRO diagramming and vector drawing software extended with the Enterprise Architecture Diagrams solution from the Management area of ConceptDraw Solution Park.
 Network Layout Floor Plans
Network Layout Floor Plan solution extends ConceptDraw PR software with samples, templates and libraries of vector stencils for drawing the computer network layout floor plans.
 What is a Dashboard Area
Solutions from the area What is a Dashboard of ConceptDraw Solution Park collects templates, samples and vector stencils libraries with of data driven charts and indicators for drawing the basic types of Visual Dashboards.
 Project Management Area
Project Management area provides Toolbox solutions to support solving issues related to planning, tracking, milestones, events, resource usage, and other typical project management functions.
- How To Create the Involvement Matrix | CORRECTIVE ACTIONS ...
- Seven Management and Planning Tools | PROBLEM ANALYSIS ...
- Basic Flowchart Symbols and Meaning | Flowchart design ...
- Trading process diagram - Deployment flowchart | Cross-Functional ...
- Process Flowchart | Strategic planning - Cycle diagram | Circular ...
- KPIs and Metrics | Cafe performance metrics vs. air temperature ...
- Design elements - UML use case diagrams
- Target and Circular Diagrams | Relative Circular Diagram | Circular ...
- Target and Circular Diagrams | Relative Circular Diagram ...
- Block diagram - Porter's five forces model | Target diagrams - Vector ...
- Circular Arrows Diagrams | Target and Circular Diagrams | How to ...
- Sale dashboard | Sales dashboard - Vector stencils library | Project ...
- How to Create Flowchart Using Standard Flowchart Symbols | Basic ...
- How to Create a HR Process Flowchart Using ConceptDraw PRO ...
- How to Connect MS Excel Data to a Performance Qualitative ...
- Strategic planning cycle - Arrow loop diagram | Strategic planning ...
- How to Create a BPMN Diagram Using Border Events in ...
- HR management process - Flowchart | Types of Flowchart ...
- Types of Flowchart - Overview | Design elements - HR flowchart ...
- Customer types matrix diagram | Response to Customer Negative ...


