Pyramid Chart Examples
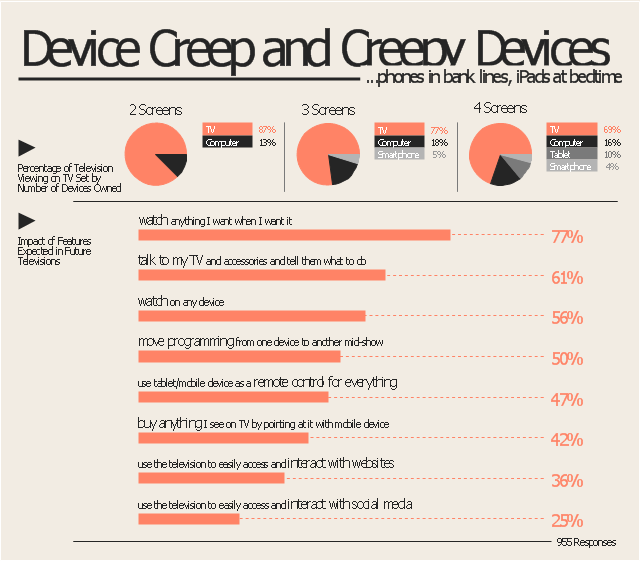
Pyramid Charts and Triangle Diagrams are used to visually structure the topics and progressively order the quantitative data. They allow to illustrate hierarchical structure of the topics, proportional, interconnected and containment relations among the topics. The multilevel Pyramids and Triangle diagrams are constructed oriented up or down and divided into several horizontal slices. They are effectively used to represent marketing strategies, social strategies, information systems, market value, etc., to illustrate presentations, websites, documents, reports in business, finances, sales, management, marketing, media, training, consulting, and many other fields. To maximize the efficiency in drawing the Pyramid Charts, use the ConceptDraw DIAGRAM diagramming and vector drawing software extended with Pyramid Diagrams solution from Marketing area, which contains the set of Pyramid Chart examples, samples, templates and vector design elements of triangular diagrams and pyramids with different quantity of levels for various needs.The marketing infogram example "Device creep and creepy devices - Marketing infographics" was created on the base of report "The Multi-Screen Marketer" from the website of the Econsultancy blog.
"The Multi-Screen Marketer addresses rapidly shifting consumer media consumption behavior. As devices get smaller and more powerful, our culture is shifting toward instant communication, immediate information gratification and multi-tasking. Consumers are viewing multiple streams of content simultaneously, across a plethora of devices, and brands are learning to chase them across the gaps.
Brand planning and narratives that span tablets, smartphones, laptops, and televisions can create tremendous potential for engagement and sales; failure to adequately anticipate the ways people are interacting with the technology around them can lead to marketing and messaging that is ignored, or worse, out of touch. ...
Device Creep and Creepy Devices.
Adding devices to our lives means some migration from one device to another, but an equally important trend is simply toward more of everything. More media at more times, with digital content displacing some activities and filling the previously unused spaces in consumers’
lives...phones in bank lines, iPads at bedtime, etc." [econsultancy.com/ reports/ the-multi-screen-marketer]
The marketing infographic example "Device creep and creepy devices" was created using the ConceptDraw PRO diagramming and vector drawing software extended with the Marketing Infographics solition from the area "Business Infographics" in ConceptDraw Solution Park.
- Report On Branded Goods Critical Analysis With Diagram
- Pyramid Chart Examples | Report On Branded Goods
- Brands Available In Market Diagrams
- Pyramid Chart Examples | Brand essence model - Wheel diagram ...
- Pyramid Chart Examples | How to Make SWOT Analysis in a Word ...
- BCG Matrix | Competitor Analysis | Pyramid Chart Examples | Brand ...
- Brand essence model - Wheel diagram | Pyramid Diagrams ...
- Brand Positioning Diagram
- Block diagram - Branding strategies | Pyramid Chart Examples ...
- Brand essence model - Wheel diagram | Target and Circular ...
- Keyboard Shortcuts and Mouse Actions | Target Diagram | Brand ...
- Pyramid Chart Examples | Device creep and creepy devices ...
- Brand essence model - Wheel diagram | Top brand model - Pyramid ...
- Choose A Product To Draw A Diagram Of Business Sectors
- https://www.conceptdraw.com/examples/uuo-element daily 0.56 http ...
- Positioning map | Business Tools Perceptual Mapping | SWOT ...
- Ring Network Topology | Circular diagrams - Vector stencils library ...
- Best Flowchart Software and Flowchart Symbols | Pyramid Diagram ...
- Marketing Blog Diagram
- Presenting Documents with Skype | Business People Figures ...

