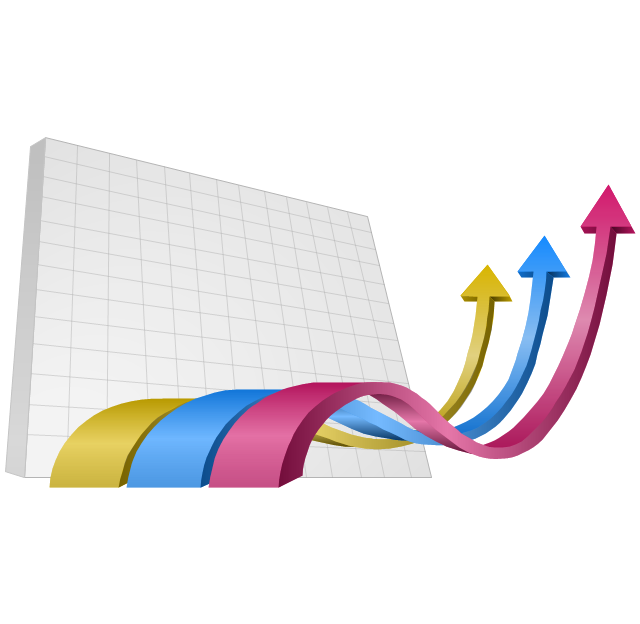
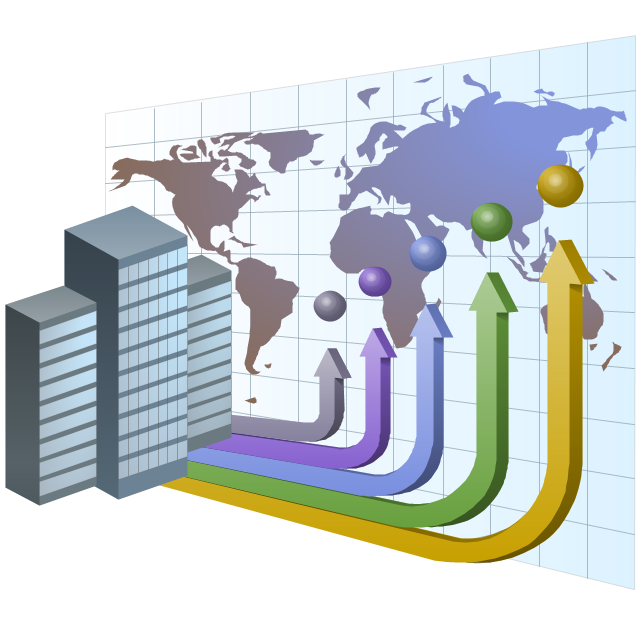
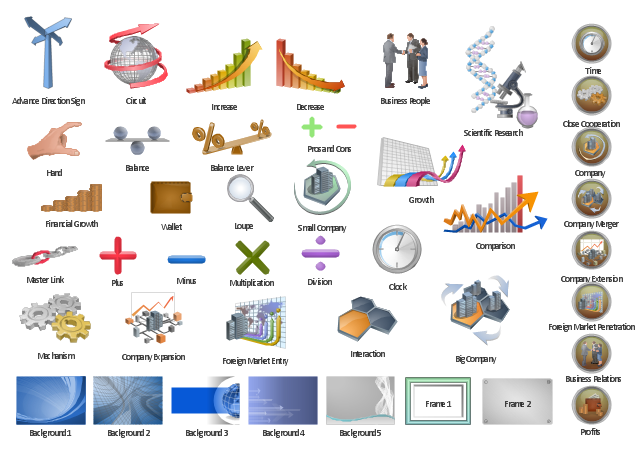
The vector clipart library "Presentation design elements" contains 45 presentation symbols and arrows which you can easy use in your slides and illustrations.
"A presentation is the process of presenting a topic to an audience. It is typically a demonstration, lecture, or speech meant to inform, persuade, or build good will. ... the use of visuals reduced meeting times... audiences believe presenters who use visuals are more professional and credible than presenters who merely speak. ... meetings and presentations reinforced with visuals help participants reach decisions and consensus more quickly." [Presentation. Wikipedia]
The clip art example "Presentation design elements - Vector clipart library" was created in the ConceptDraw PRO diagramming and vector drawing software using the Presentation Clipart solution from the Illustration area of ConceptDraw Solution Park.
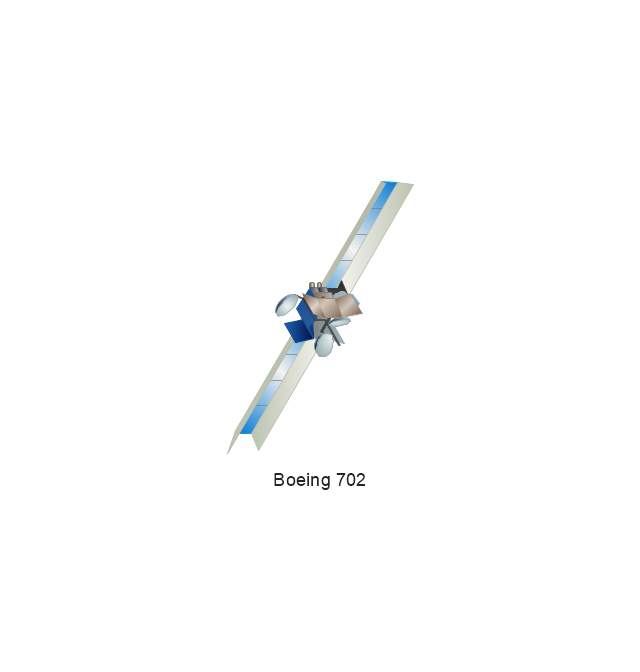
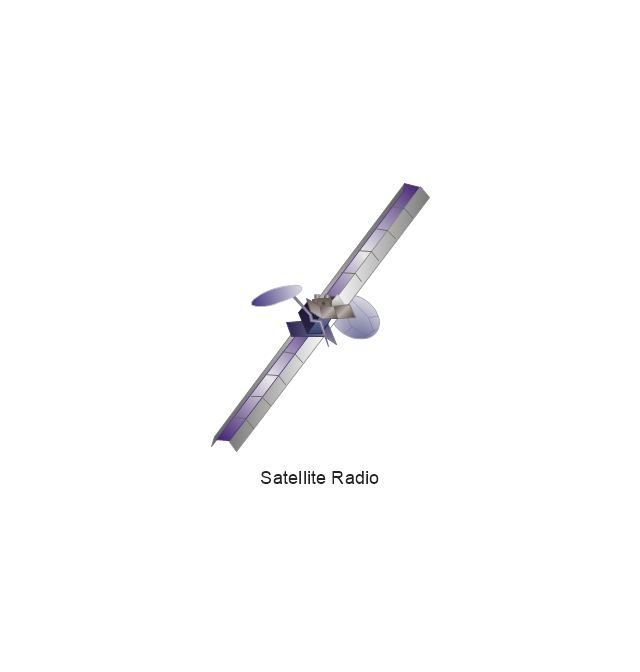
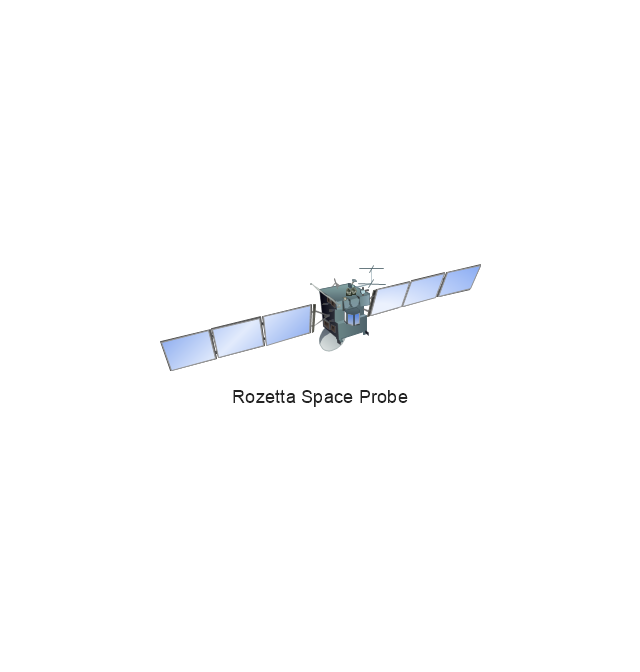
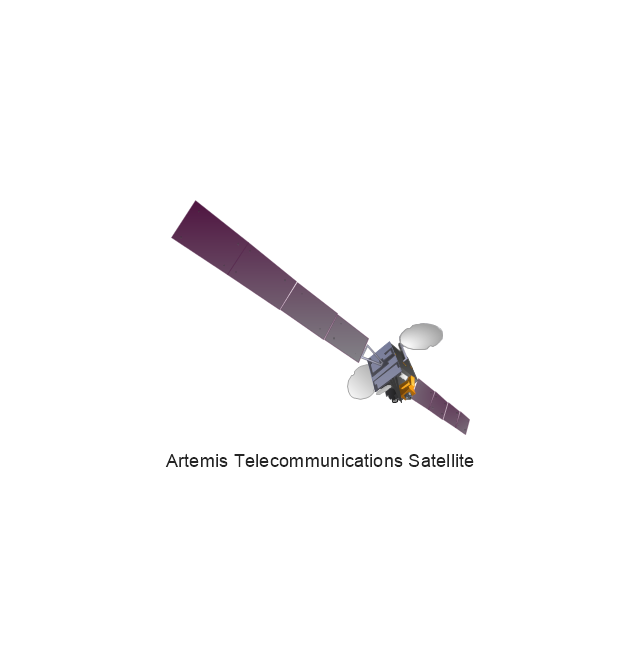
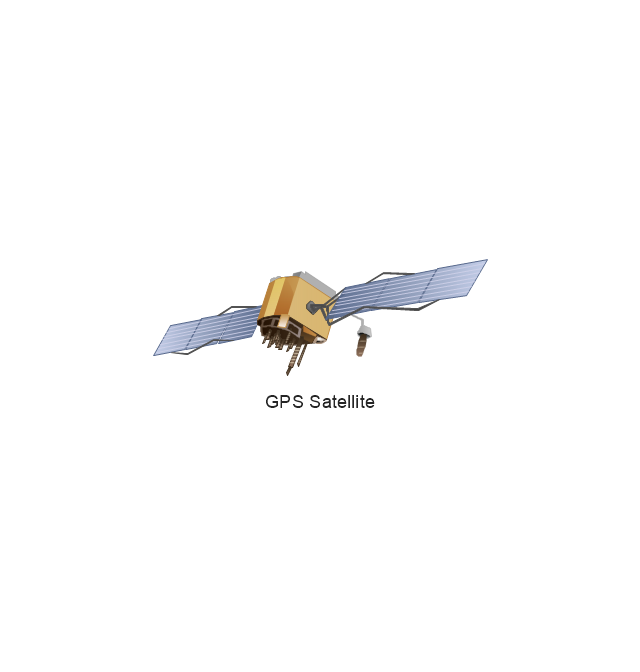
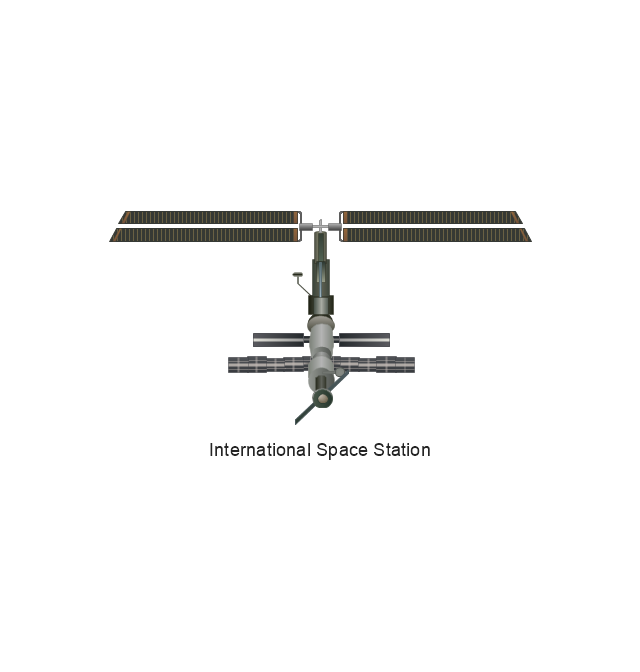
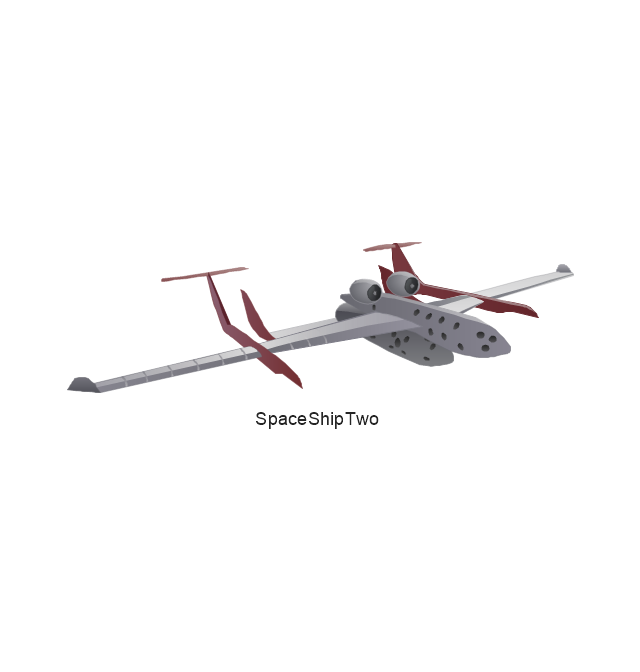
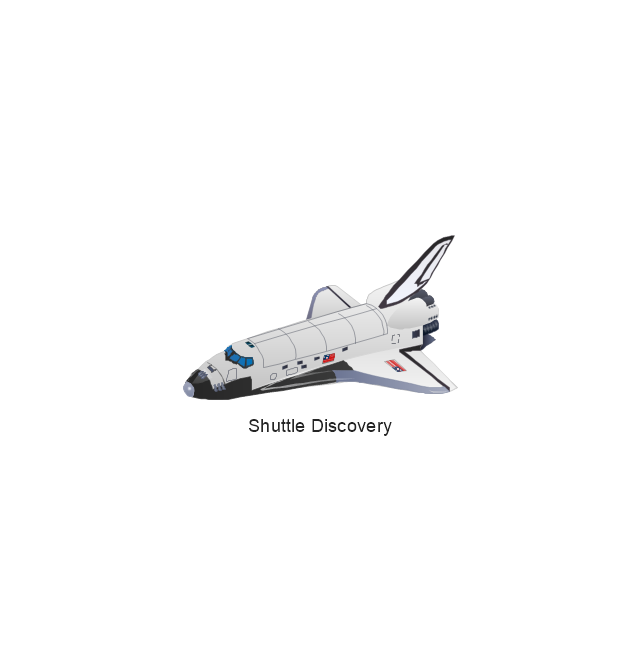
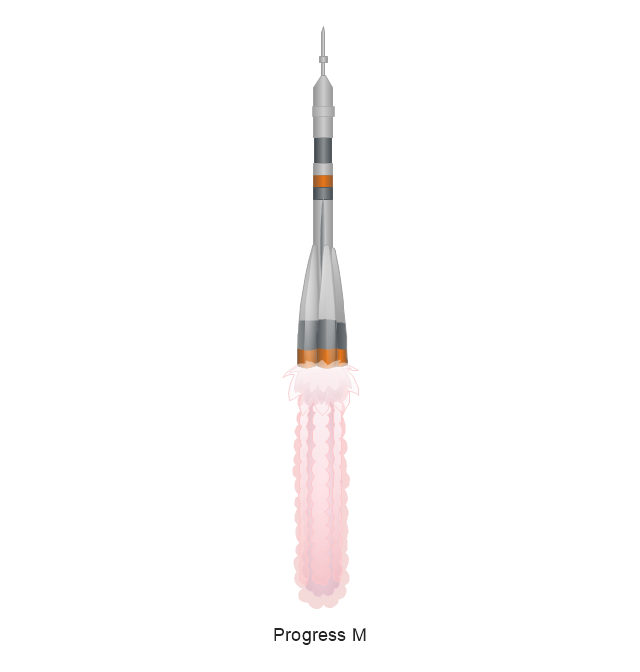
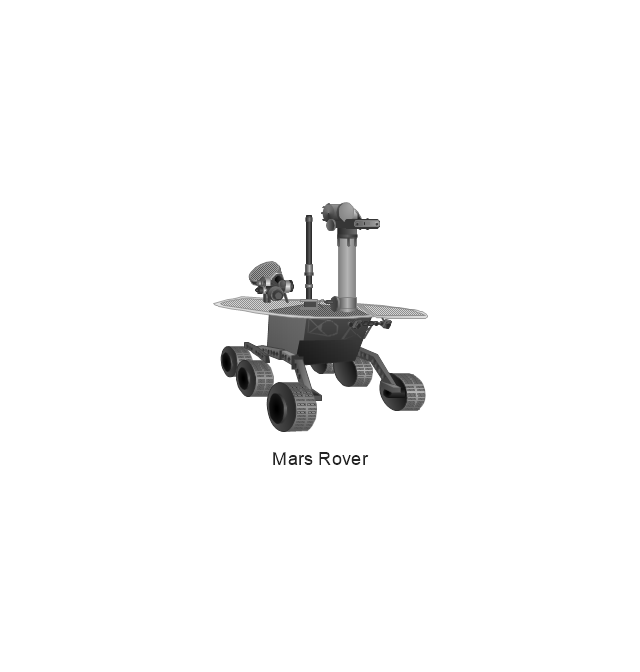
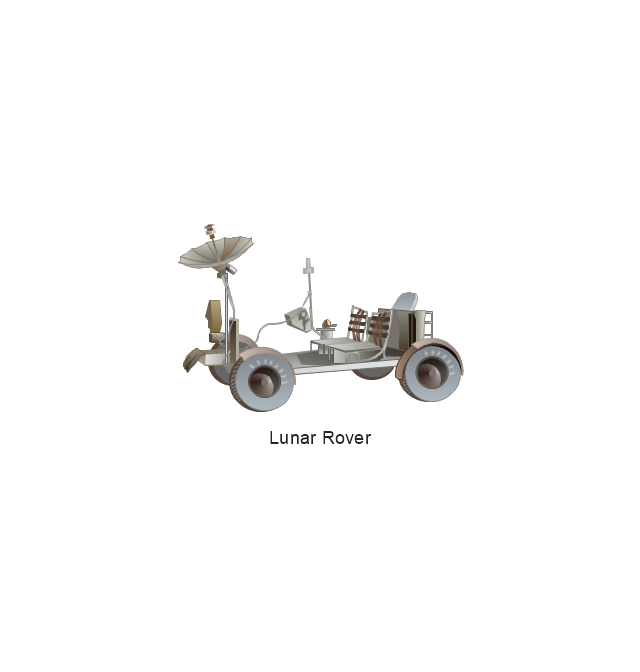
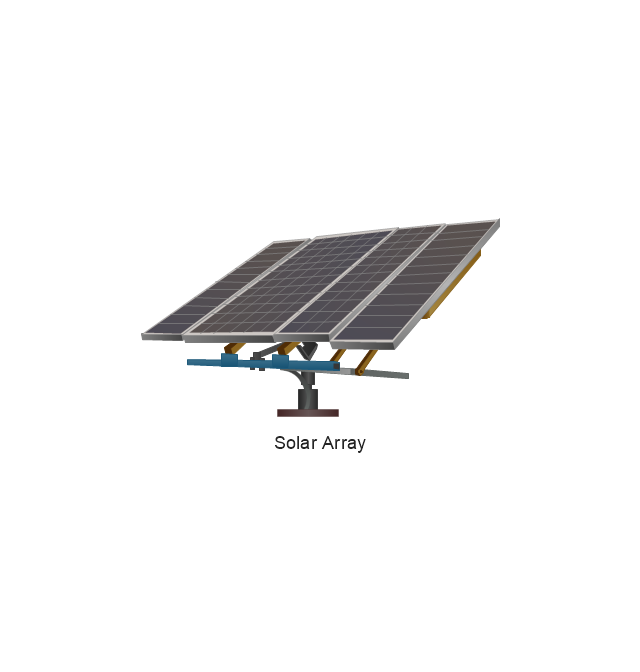
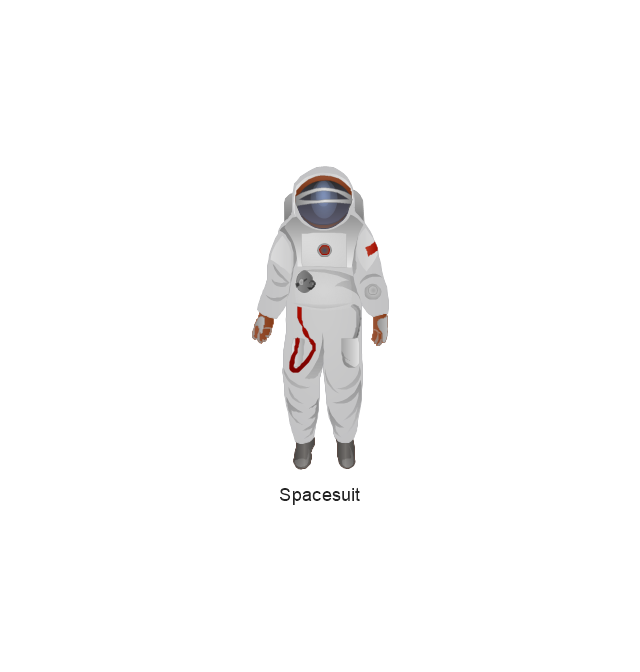
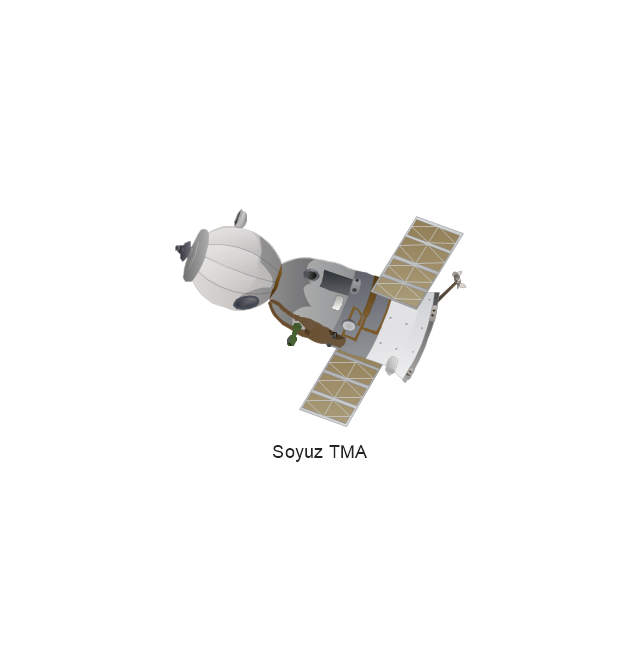
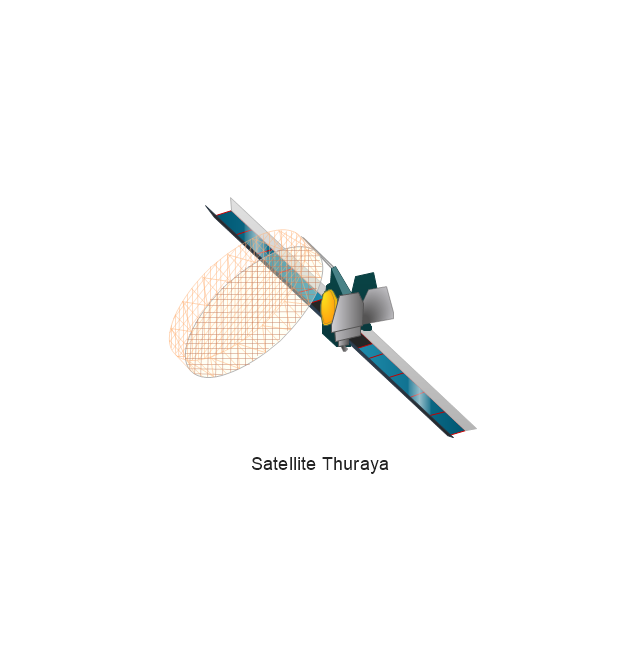
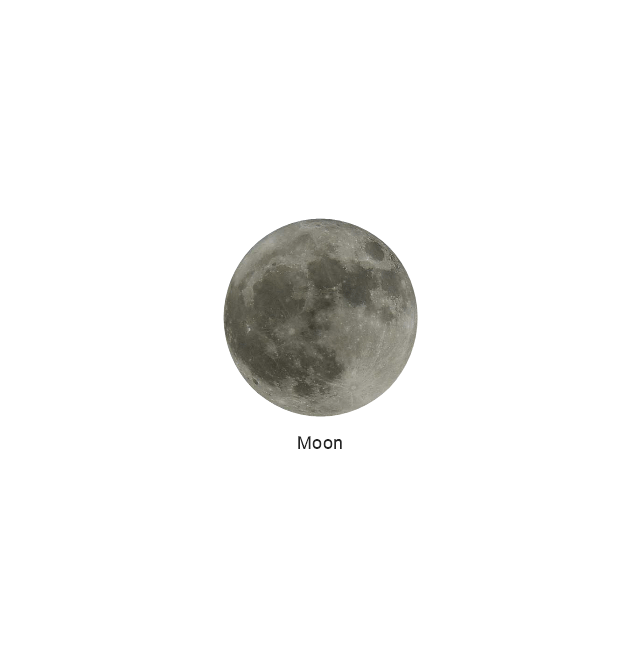
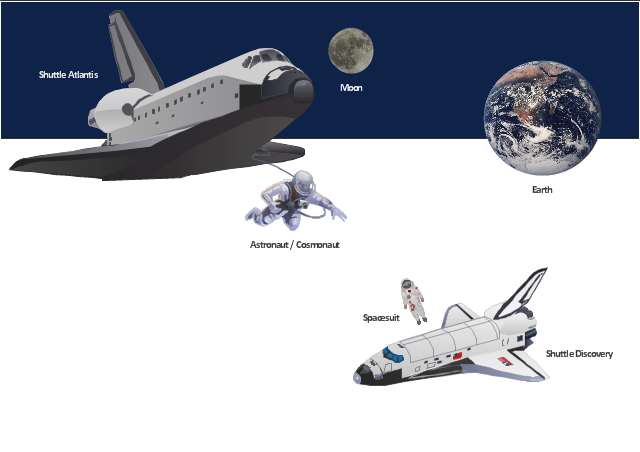
The vector stencils library "Aerospace" contains 38 clip art images for creating aerospace illustrations, presentation slides, infographics and webpages using the ConceptDraw PRO diagramming and vector drawing software.
"Aerospace describes the human effort in science, engineering and business to fly in the atmosphere of Earth (aeronautics) and surrounding space (astronautics). Aerospace organisations research, design, manufacture, operate, or maintain aircraft and/ or spacecraft. Aerospace activity is very diverse, with a multitude of commercial, industrial and military applications.
Aerospace is not the same as airspace, which is the physical air space directly above a location on the ground." [Aerospace. Wikipedia]
The vector stencils library "Aerospace" is included in the Aerospace and Transport solution from the Illustrations area of ConceptDraw Solution Park.
www.conceptdraw.com/ solution-park/ illustrations-aerospace-transport
Use vector clipart library Aerospace to illustrate your documents, infographics, presentations and websites with images of space vehicles and objects using ConceptDraw PRO diagramming and vector drawing software.
"Aerospace comprises the atmosphere of Earth and surrounding space. Typically, aerospace industries combine aeronautics and astronautics to research, design, manufacture, operate, or maintain vehicles moving through air and through space. Aerospace is a very diverse field, with a multitude of commercial, industrial and military applications." [Aerospace
From Wikipedia]
The vector stencils library Aerospace is included in the Aerospace and Transport solution from Illustration area of ConceptDraw Solution Park.
The vector clipart library "Presentation design elements" contains 45 presentation symbols and arrows which you can easy use in your slides and illustrations.
"A presentation is the process of presenting a topic to an audience. It is typically a demonstration, lecture, or speech meant to inform, persuade, or build good will. ... the use of visuals reduced meeting times... audiences believe presenters who use visuals are more professional and credible than presenters who merely speak. ... meetings and presentations reinforced with visuals help participants reach decisions and consensus more quickly." [Presentation. Wikipedia]
The clip art example "Presentation design elements - Vector clipart library" was created in the ConceptDraw PRO diagramming and vector drawing software using the Presentation Clipart solution from the Illustration area of ConceptDraw Solution Park.
"A presentation is the process of presenting a topic to an audience. It is typically a demonstration, lecture, or speech meant to inform, persuade, or build good will. ... the use of visuals reduced meeting times... audiences believe presenters who use visuals are more professional and credible than presenters who merely speak. ... meetings and presentations reinforced with visuals help participants reach decisions and consensus more quickly." [Presentation. Wikipedia]
The clip art example "Presentation design elements - Vector clipart library" was created in the ConceptDraw PRO diagramming and vector drawing software using the Presentation Clipart solution from the Illustration area of ConceptDraw Solution Park.
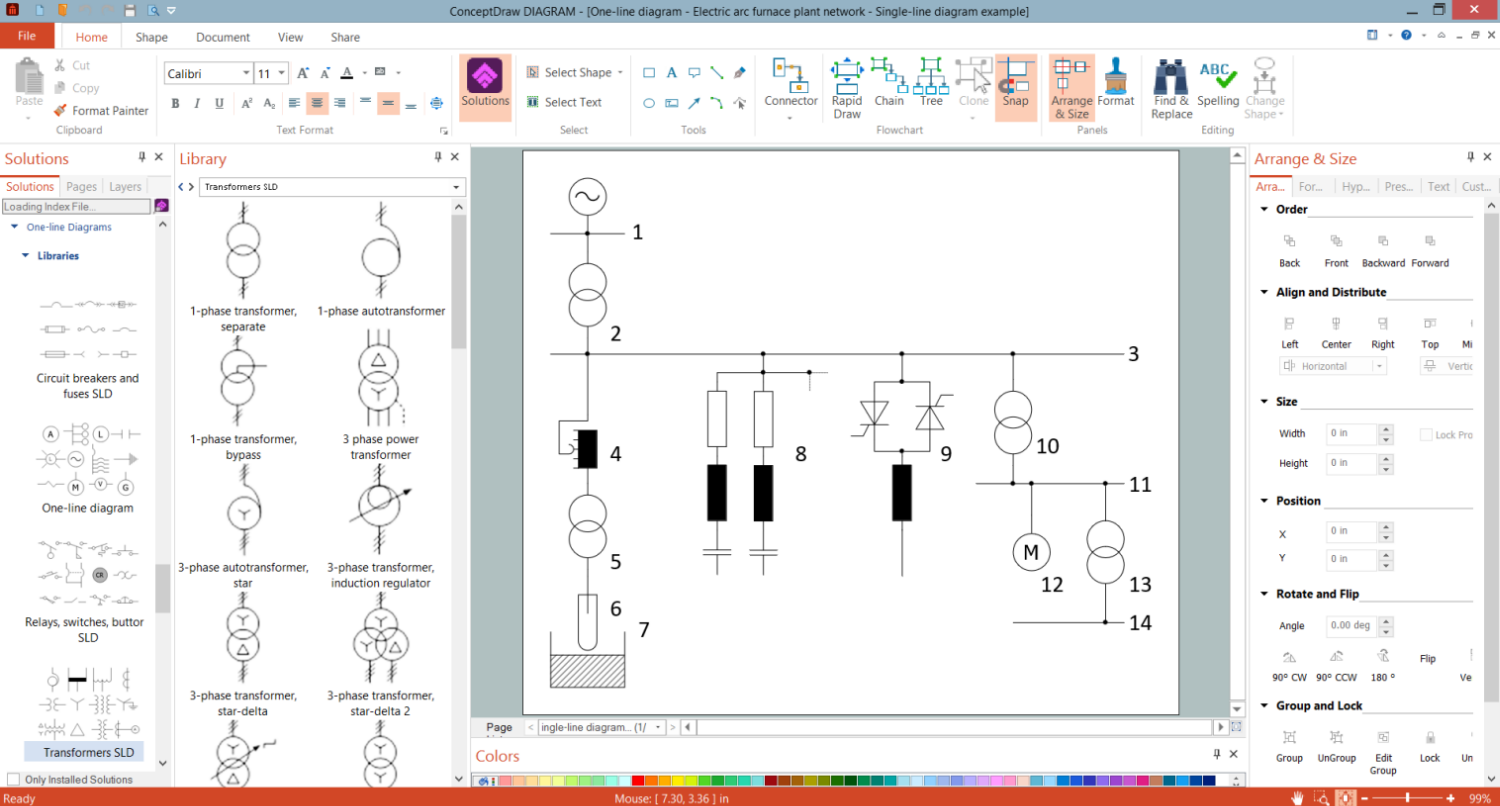
One-line Diagram
One-line diagram also known as a Single-line diagram is a type of graphic representation of an electrical circuit or system. ConceptDraw's One-line Diagrams solution offers powerful tools for designing accurate, intuitive, and up-to-date One-line diagrams. Create innovative electrical engineering schematics to give an accurate picture of the electrical systems, generate reports about the engineering studies and research, design educational materials, identify potential sources of electric energy, analyze systems and track bottlenecks fast and easily. The included collection of predesigned vector objects and samples provides the simplicity and rapidity of drawing.This circle diagram sample was redesigned from the Wikimedia Commons file: Research cycle.png. "Some of the basic elements of the scientific method, arranged in a cycle to emphasize that it is an iterative process." [commons.wikimedia.org/ wiki/ File:Research_ cycle.png]
This file is licensed under the Creative Commons Attribution 2.0 Generic license. [creativecommons.org/ licenses/ by/ 2.0/ deed.en]
"The scientific method is a body of techniques for investigating phenomena, acquiring new knowledge, or correcting and integrating previous knowledge. To be termed scientific, a method of inquiry must be based on empirical and measurable evidence subject to specific principles of reasoning. ...
Four essential elements of the scientific method are iterations, recursions, interleavings, or orderings of the following:
(1) Characterizations (observations, definitions, and measurements of the subject of inquiry).
(2) Hypotheses (theoretical, hypothetical explanations of observations and measurements of the subject).
(3) Predictions (reasoning including logical deduction from the hypothesis or theory).
(4) Experiments (tests of all of the above)...
A linearized, pragmatic scheme of the four points above is sometimes offered as a guideline for proceeding:
(1) Define a question.
(2) Gather information and resources (observe).
(3) Form an explanatory hypothesis.
(4) Test the hypothesis by performing an experiment and collecting data in a reproducible manner.
(5) Analyze the data.
(6) Interpret the data and draw conclusions that serve as a starting point for new hypothesis.
(7) Publish results.
(8) Retest (frequently done by other scientists).
The iterative cycle inherent in this step-by-step method goes from point 3 to 6 back to 3 again." [Scientific method. Wikipedia]
The circle diagram example "Research cycle" was created using the ConceptDraw PRO diagramming and vector drawing software extended with the Target and Circular Diagrams solution from the Marketing area of ConceptDraw Solution Park.
www.conceptdraw.com/ solution-park/ marketing-target-and-circular-diagrams
Marketing Research Project
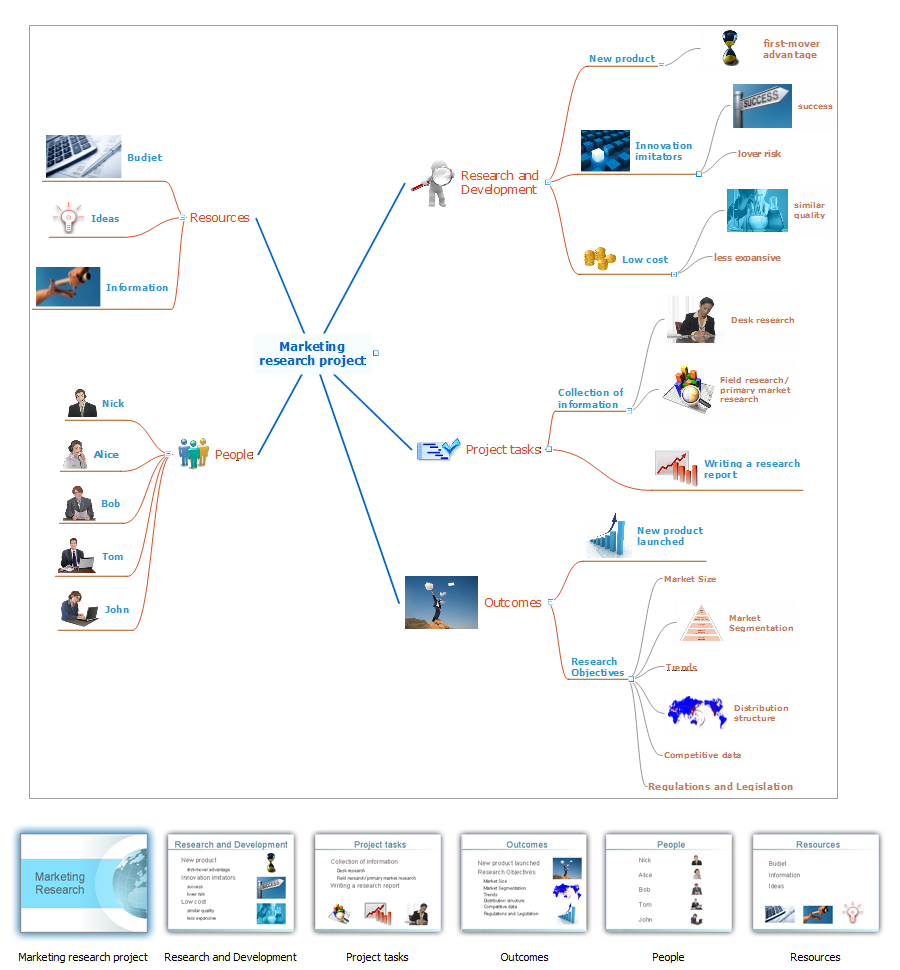
Researches are the main tools used to expand the boundaries of our knowledge in all fields of science and business. Today, it is impossible to authentically explain the behavior and intentions of customers of the company, its dealers and competitors, without serious marketing researches. The efficiently gathered, reliable and accurate information is extremely important when making the marketing decisions. It gives a company the opportunity to achieve a certain competitive advantage, to reduce financial risks, dangers and uncertainties, to objectively determine the attitude of consumers, to analyze external environment, to improve the strategy and tactics of market behavior. The marketing researches cover the market, competitors, consumers, prices, internal capacity of an enterprise and many other factors, but themselves they do not guarantee a success. However their quality performance and skillful use contribute to the achievement of company objectives. ConceptDraw MINDMAP is convenient for professional designing the Mind Maps, which represent knowledge about the process of marketing researches, visually reflect the results of marketing researches, organize the information about tasks, resources, outcomes and people for a marketing research project.
 Critical Infrastructure Sectors
Critical Infrastructure Sectors solution for ConceptDraw DIAGRAM software provides a set of examples and vector stencil libraries for designing infographics and diagrams about means for the most efficient protection of critical infrastructure, energy sector, and rapid recovery in the case of disruptions. Illustrate your projects on the prevention of physical, environmental, and cyber threats, development of information technology and detection equipment. Improve your projects in communications, financial services, emergency services, homeland security, cybersecurity to solve critical issues efficiently and decrease the detrimental effects of disruptions on society and citizens. Show the results of testing new technologies and newest equipment for critical infrastructure protection and increasing resilience.
Interior Design
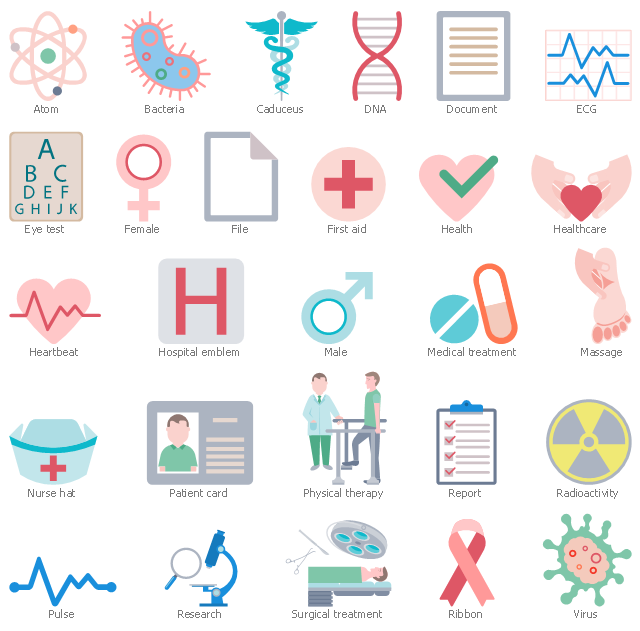
Interior design is simultaneously the science and art directed on beautification of interior space with the aim to provide convenience, comfort, aesthetic for pleasant staying of people. Interior design is very multifaceted, it includes the processes of interior design development, space planning, research, communication with project's stakeholders, programming, management, coordination, site inspections, all they are realized directly by interior designers or under its supervision. Creation of interior design project lets you plan and optimize the space, improve the navigation inside large premises, develop the decoration project according to the chosen style, create the lighting plan, ventilation scheme, plumbing and heating plans, and schematic of furniture arrangement. Numerous solutions from Building Plans area of ConceptDraw Solution Park contain examples, samples, templates and vector stencils libraries helpful for development the interior designs of different styles, for professional creation the interior design drawings and using them for technical documentation.The vector stencils library "Healthcare pictograms" contains 27 medical pictograms.
Use it to design your healthcare workflow diagrams, flowcharts and infographics with ConceptDraw PRO software.
"A pictogram, also called a pictogramme, pictograph, or simply picto, and in computer usage an icon, is an ideogram that conveys its meaning through its pictorial resemblance to a physical object. Pictographs are often used in writing and graphic systems in which the characters are to a considerable extent pictorial in appearance." [Pictogram. Wikipedia]
The medical pictogram set example "Design elements - Healthcare pictograms" is included in Healthcare Workflow Diagrams solution from Business Processes area of ConceptDraw Solution Park.
Marketing Plan Infographic
You need design the Marketing Plan Infographic and dream to find the useful tools to draw it easier, quickly and effectively? ConceptDraw DIAGRAM offers the unique Marketing Infographics Solution from the Business Infographics Area that will help you!The vector clipart library "Presentation" design elements contains 45 symbols you can use to design your presentation slides and illustrations using the ConceptDraw PRO diagramming and vector drawing software.
"Although some think of presentations in a business meeting context, there are often occasions when that is not the case. For example, a non-profit organization presents the need for a capital fund-raising campaign to benefit the victims of a recent tragedy; a school district superintendent presents a program to parents about the introduction of foreign-language instruction in the elementary schools;an artist demonstrates decorative painting techniques to a group of interior designers; a horticulturist shows garden club members or homeowners how they might use native plants in the suburban landscape; a police officer addresses a neighborhood association about initiating a safety program. ...
A study done by Wharton School Of Business showed that the use of visuals reduced meeting times by 28 percent. Another study found that audiences believe presenters who use visuals are more professional and credible than presenters who merely speak. Other research indicates that meetings and presentations reinforced with visuals help participants reach decisions and consensus more quickly." [Presentation. Wikipedia]
The clip art example "Design elements - Presentation symbols" is included in the Presentation Clipart solution from the Illustration area of ConceptDraw Solution Park.
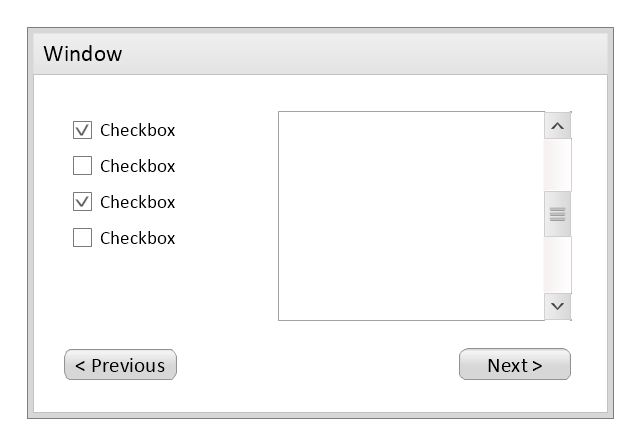
Use this template to prototype and design the wireframe graphic user interface (GUI).
"A website wireframe, also known as a page schematic or screen blueprint, is a visual guide that represents the skeletal framework of a website. Wireframes are created for the purpose of arranging elements to best accomplish a particular purpose. The purpose is usually being informed by a business objective and a creative idea. The wireframe depicts the page layout or arrangement of the website’s content, including interface elements and navigational systems, and how they work together. The wireframe usually lacks typographic style, color, or graphics, since the main focus lies in functionality, behavior, and priority of content. In other words, it focuses on what a screen does, not what it looks like. Wireframes can be pencil drawings or sketches on a whiteboard, or they can be produced by means of a broad array of free or commercial software applications. Wireframes are generally created by business analysts, user experience designers, developers, visual designers and other roles with expertise in interaction design, information architecture and user research.
Wireframes focus on:
(1) The kinds of information displayed.
(2) The range of functions available.
(3) The relative priorities of the information and functions.
(4) The rules for displaying certain kinds of information.
(5) The effect of different scenarios on the display.
The website wireframe connects the underlying conceptual structure, or information architecture, to the surface, or visual design of the website. Wireframes help establish functionality, and the relationships between different screen templates of a website. An iterative process, creating wireframes is an effective way to make rapid prototypes of pages, while measuring the practicality of a design concept. Wireframing typically begins between “high-level structural work - like flowcharts or site maps - and screen designs.” Within the process of building a website, wireframing is where thinking becomes tangible.
Aside from websites, wireframes are utilized for the prototyping of mobile sites, computer applications, or other screen-based products that involve human-computer interaction." [Website wireframe. Wikipedia]
The wireframe GUI template for the ConceptDraw PRO diagramming and vector drawing software is included in the Graphic User Interface solution from the Software Development area of ConceptDraw Solution Park.
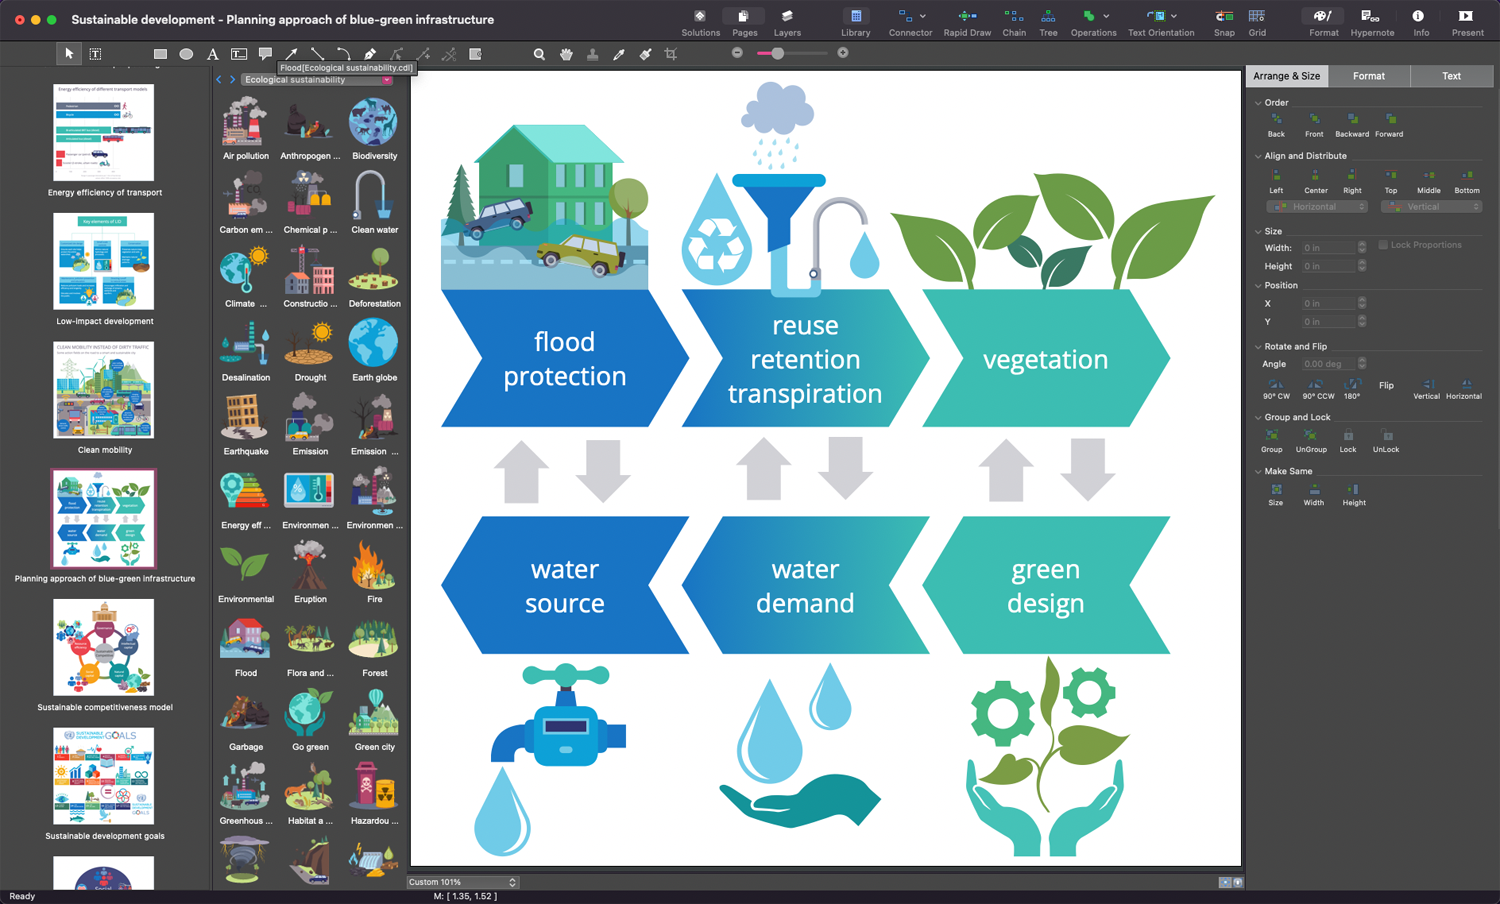
Sustainable Agriculture
Sustainable agriculture is a system approach to meet society’s needs in goods produced by agriculture, food, textile without damage to future generations, offering future generations the ability to meet also their needs in similar products. It involves the use of methods that help to save a healthy environment, take care of social and economic equity and profitability. ConceptDraw DIAGRAM enhanced with Sustainable Development solution is a perfect software to illustrate ways of sustainable development, in particular the innovative methods developed and applied for sustainable agriculture.Agriculture Infographic
Use the Agriculture Infographics solution to create multifarious visuals, agriculture and farm graphics, infographics, illustrations, and diagrams illustrating the efficiency of various farming methods and principles of organic farming promoting soil and environment health, and biodiversity. Show the allocation of various crops and livestock worldwide, major crops produced in various regions, the flow of agricultural products between countries, application of smart technologies or data analytics tools, global supply chains, major exporters and importers, and outline key governmental policies in the agriculture field. Highlight productivity differences and compare crop yields across different countries or continents, indicate climate factors that affect crop yields, show global production patterns, trade dynamics, market trends, regional agricultural strengths and challenges, investment opportunities, and economic impacts. Present insights into how innovations can enhance productivity and sustainability in farming, reduce pollution, and enhance ecosystem health.Creating a default presentation in ConceptDraw MINDMAP
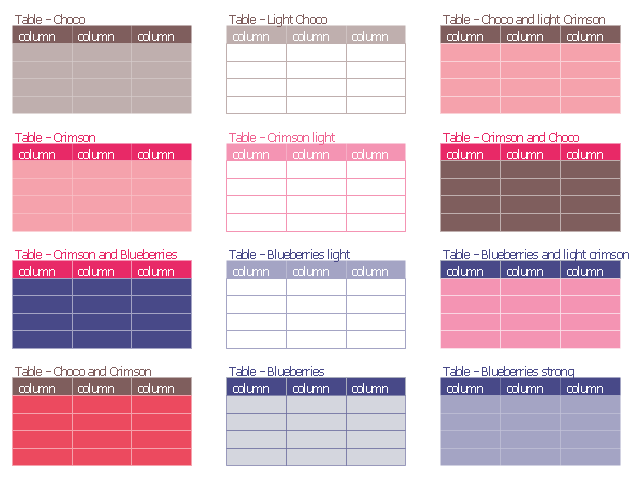
ConceptDraw MINDMAP a versatile, yet easy-to-use tool for organizing ideas and data. Creates mind maps that intuitively illustrate your thought process. Outputs a wide variety of document styles and formats. Delivers presentations from mind maps with built-in modes and MS PowerPoint export. Perfect for brainstorming, project planning, meeting management, note taking, and more.The vector stencils library "Tables" contains 12 table blocks. Use it to add typography elements into your infographics.
"A table is a means of arranging data in rows and columns. The use of tables is pervasive throughout all communication, research and data analysis. Tables appear in print media, handwritten notes, computer software, architectural ornamentation, traffic signs and many other places. The precise conventions and terminology for describing tables varies depending on the context. Further, tables differ significantly in variety, structure, flexibility, notation, representation and use. In books and technical articles, tables are typically presented apart from the main text in numbered and captioned floating blocks." [Table (information). Wikipedia]
The example "Design elements - Tables" was created using the ConceptDraw PRO diagramming and vector drawing software extended with the Typography Infographics solition from the area "What is infographics" in ConceptDraw Solution Park.
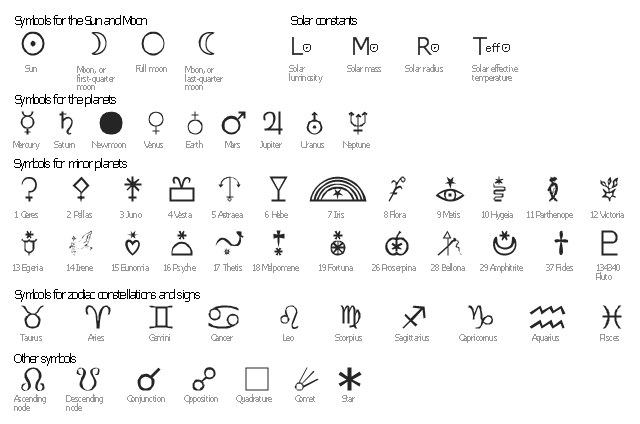
The vector stencils library "Astronomical symbols" contains 58 astronomical symbols and astrological signs of Solar system planets, stars, Sun, Moon, Earth, constellations, Mercury, Venus, Mars, Saturn, Jupiter, Uranus, Neptune, comet, Zodiac signs.
"Astronomical symbols are symbols used to represent various celestial objects, theoretical constructs and observational events in astronomy. The earliest forms of these symbols appear in Greek papyri of late antiquity. The Byzantine codices in which the Greek papyri were preserved continued and extended the inventory of astronomical symbols. New symbols were further invented to represent many just-discovered planets and minor planets discovered in the 18th-20th centuries.
All these symbols were once commonly used by professional astronomers, amateur astronomers, and astrologers. While they are still commonly used in almanacs and astrological publications, their occurrence in published research and texts on astronomy is relatively infrequent, with some exceptions such as the Sun and Earth symbols appearing in astronomical constants, and certain zodiacal signs used to represent the solstices and equinoxes." [Astronomical symbols. Wikipedia]
The pictograms example "Design elements - Astronomical symbols" was created using the ConceptDraw PRO diagramming and vector drawing software extended with the Astronomy solution from the Science and Education area of ConceptDraw Solution Park.
 Stakeholder Onion Diagrams
The Stakeholder Onion Diagrams solution supplies ConceptDraw DIAGRAM with powerful tools to simplify the process of creating Stakeholder Onion Diagrams. It includes the set of pre-made vector objects and templates for a quick start, and collection of examples illustrating the solution's power. This solution is useful for all specialists in management and business, especially for those who prefer to use the newest progressive tools.
The vector stencils library "Application" contains 40 icons of software applications.
Use it to design your computer and telecom illustrations and infographics with ConceptDraw PRO diagramming and vector drawing software.
The vector stencils library "Application" is included in the Computers and Communications solution from the Illustration area of ConceptDraw Solution Park.
Use it to design your computer and telecom illustrations and infographics with ConceptDraw PRO diagramming and vector drawing software.
The vector stencils library "Application" is included in the Computers and Communications solution from the Illustration area of ConceptDraw Solution Park.
- Research Design Process Flowchart
- LLNL Flow Charts | How To Design A Research Flow Diagram
- Research cycle - Circle diagram | Presentation design elements ...
- Research onion diagram | Research cycle - Circle diagram ...
- Aircraft - Design Elements | Aerospace - Design Elements ...
- Research onion diagram | Onion Diagram Process Design
- Target and Circular Diagrams | Circular Diagram For Research Design
- Process Flowchart | Development Research Design Icon
- Research onion diagram | Stakeholder diagram | Onion Diagram ...
- Vector stencils library | Aerospace - Design Elements | Moon Shuttle ...
