The vector stencils library "HR symbols" contains 45 HR pictograms.
Use this icon set with HR symbols to draw your HR flowcharts, workflow diagrams, process charts and infographics with the ConceptDraw PRO diagramming and vector drawing software.
The HR pictograms library "HR symbols" is included in the HR Flowcharts solution from the Management area of ConceptDraw Solution Park.
 HR Flowcharts
Human resource management diagrams show recruitment models, the hiring process and human resource development of human resources.
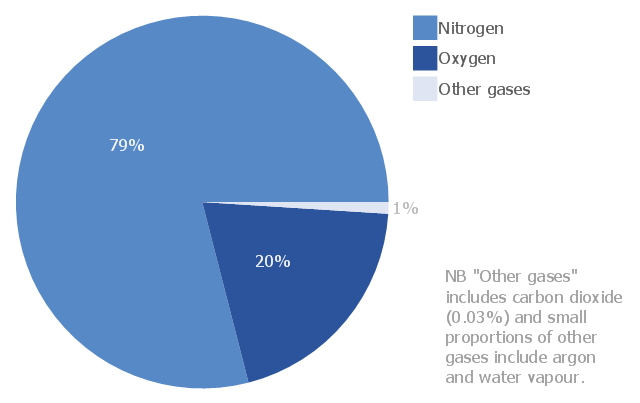
This pie chart sample shows the atmosphere air composition. It was designed on the base of the Wikimedia Commons file: Air composition pie chart.JPG.
[commons.wikimedia.org/ wiki/ File:Air_ composition_ pie_ chart.JPG]
This file is licensed under the Creative Commons Attribution-Share Alike 3.0 Unported license. [creativecommons.org/ licenses/ by-sa/ 3.0/ deed.en]
"The atmosphere of Earth is a layer of gases surrounding the planet Earth that is retained by Earth's gravity. The atmosphere protects life on Earth by absorbing ultraviolet solar radiation, warming the surface through heat retention (greenhouse effect), and reducing temperature extremes between day and night (the diurnal temperature variation).
The common name given to the atmospheric gases used in breathing and photosynthesis is air. By volume, dry air contains 78.09% nitrogen, 20.95% oxygen, 0.93% argon, 0.039% carbon dioxide, and small amounts of other gases. Air also contains a variable amount of water vapor, on average around 1%. Although air content and atmospheric pressure vary at different layers, air suitable for the survival of terrestrial plants and terrestrial animals currently is only known to be found in Earth's troposphere and artificial atmospheres." [Atmosphere of Earth. Wikipedia]
The pie chart example "Atmosphere air composition" was created using the ConceptDraw PRO diagramming and vector drawing software extended with the Pie Charts solution of the Graphs and Charts area in ConceptDraw Solution Park.
This financila dashboard example was drawn on the base of the Enterprise dashboard from the Mecklenburg County Government website.
[charmeck.org/ mecklenburg/ county/ CountyManagersOffice/ OMB/ dashboards/ Pages/ Enterprise.aspx]
"In management information systems, a dashboard is "an easy to read, often single page, real-time user interface, showing a graphical presentation of the current status (snapshot) and historical trends of an organization’s key performance indicators to enable instantaneous and informed decisions to be made at a glance."
For example, a manufacturing dashboard may show key performance indicators related to productivity such as number of parts manufactured, or number of failed quality inspections per hour. Similarly, a human resources dashboard may show KPIs related to staff recruitment, retention and composition, for example number of open positions, or average days or cost per recruitment.
Types of dashboards.
Dashboard of Sustainability screen shot illustrating example dashboard layout.
Digital dashboards may be laid out to track the flows inherent in the business processes that they monitor. Graphically, users may see the high-level processes and then drill down into low level data. This level of detail is often buried deep within the corporate enterprise and otherwise unavailable to the senior executives.
Three main types of digital dashboard dominate the market today: stand alone software applications, web-browser based applications, and desktop applications also known as desktop widgets. The last are driven by a widget engine.
Specialized dashboards may track all corporate functions. Examples include human resources, recruiting, sales, operations, security, information technology, project management, customer relationship management and many more departmental dashboards.
Digital dashboard projects involve business units as the driver and the information technology department as the enabler. The success of digital dashboard projects often depends on the metrics that were chosen for monitoring. Key performance indicators, balanced scorecards, and sales performance figures are some of the content appropriate on business dashboards." [Dashboard (management information systems). Wikipedia]
The example "Enterprise dashboard" was created using the ConceptDraw PRO diagramming and vector drawing software extended with the Composition Dashboard solution from the area "What is a Dashboard" of ConceptDraw Solution Park.
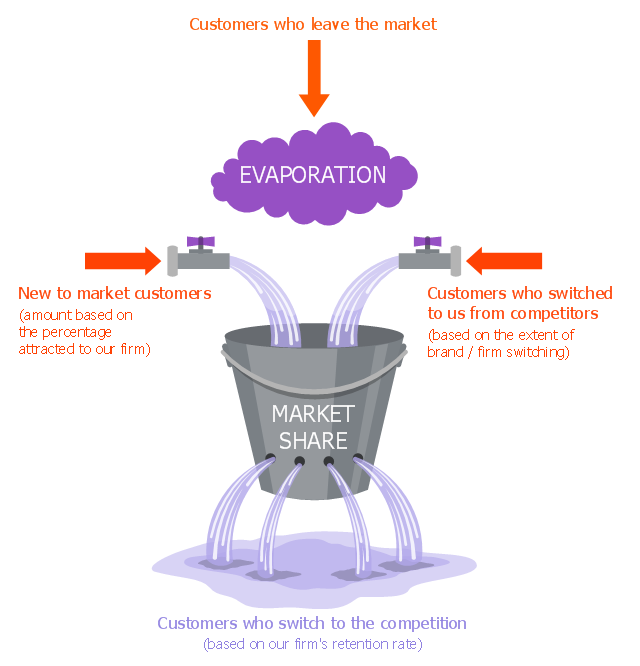
"The leaky bucket theory The leaky bucket theory is the model that seeks to describe the process of customer gain and loss, otherwise known as customer churn . Customer retention is one of the key concepts in relationship marketing. Most companies concentrate on recruiting new customers to replace customers who move on, rather than seeking to retain customers." [Blythe J. Key Concepts in Marketing. 2009. knowledge.sagepub.com/ view/ key-concepts-in-marketing/ n5.xml]
"Customer attrition, also known as customer churn, customer turnover, or customer defection, is the loss of clients or customers.
Banks, telephone service companies, Internet service providers, pay TV companies, insurance firms, and alarm monitoring services, often use customer attrition analysis and customer attrition rates as one of their key business metrics (along with cash flow, EBITDA, etc.) because the "...cost of retaining an existing customer is far less than acquiring a new one." Companies from these sectors often have customer service branches which attempt to win back defecting clients, because recovered long-term customers can be worth much more to a company than newly recruited clients." [Customer attrition. Wikipedia]
The example "Leaky bucket diagram" was created using the ConceptDraw PRO diagramming and vector drawing software extended with the Marketing Diagrams solution from the Marketing area of ConceptDraw Solution Park.
"In association football, the formation describes how the players in a team are positioned on the pitch. Different formations can be used depending on whether a team wishes to play more attacking or defensive football. ...
The 4–3–3 was a development of the 4–2–4, and was played by the Brazilian national team in the 1962 World Cup. The extra player in midfield allows a stronger defence, and the midfield could be staggered for different effects. The three midfielders normally play closely together to protect the defence, and move laterally across the field as a coordinated unit. The three forwards split across the field to spread the attack, and may be expected to mark the opposition full-backs as opposed to doubling back to assist their own full-backs, as do the wide midfielders in a 4–4–2. When used from the start of a game, this formation is widely regarded as encouraging expansive play, and should not be confused with the practice of modifying a 4–4–2 by bringing on an extra forward to replace a midfield player when behind in the latter stages of a game. This formation is suited for a short passing game and useful for ball retention.
A staggered 4–3–3 involving a defensive midfielder (usually numbered four or six) and two attacking midfielders (numbered eight and ten) was commonplace in Italy, Argentina, and Uruguay during the 1960s and 1970s. The Italian variety of 4–3–3 was simply a modification of WM, by converting one of the two wing-halves to a libero (sweeper), whereas the Argentine and Uruguayan formations were derived from 2–3–5 and retained the notional attacking centre-half. The national team which made this famous was the Dutch team of the 1974 and 1978 World Cups, even though the team won neither." [Formation (association football). Wikipedia]
The diagram example "Association football (soccer) formation 4-3-3" was created using the ConceptDraw PRO diagramming and vector drawing software extended with the Football solution from the Sport area of ConceptDraw Solution Park.
www.conceptdraw.com/ solution-park/ sport-soccer
The vector stencils library "HR symbols" contains 45 HR pictograms.
Use this icon set with HR symbols to draw your HR flowcharts, workflow diagrams, process charts and infographics with the ConceptDraw PRO diagramming and vector drawing software.
The HR pictograms library "HR symbols" is included in the HR Flowcharts solution from the Management area of ConceptDraw Solution Park.
Use this icon set with HR symbols to draw your HR flowcharts, workflow diagrams, process charts and infographics with the ConceptDraw PRO diagramming and vector drawing software.
The HR pictograms library "HR symbols" is included in the HR Flowcharts solution from the Management area of ConceptDraw Solution Park.
- Circular Diagram | Customer Retention Flow Charts
- Circular Diagram | Enterprise dashboard | Customer Retention ...
- Leaky bucket diagram | Circular Diagram | Customer Retention With ...
- Employee Retention Dashboard
- Retention Round Icon Png
- Retention
- Dress Code Vector Png
- Symbol For Skill Acquisition
- Motivation Clipart Png
- Absenteeism Icon Png
- Workplace Efficiency
- Bucket Theory Of Marketing
- Png Clipart Motivation
- Relationship marketing | Venn diagram - Relationship marketing ...
- Leadership Symbols Png
- Human Resource Management | HR symbols - Vector stencils ...
- HR symbols - Vector stencils library | HR workflow - Vector stencils ...
- Partnership Vector Png
- Extragalactic distance ladder | Ladder of customer loyalty diagram ...
- HR symbols - Vector stencils library | HR Flowchart Symbols ...


-formation-diagram-association-football-(soccer)-formation-4-3-3.png--diagram-flowchart-example.png)