Cause and Effect Analysis
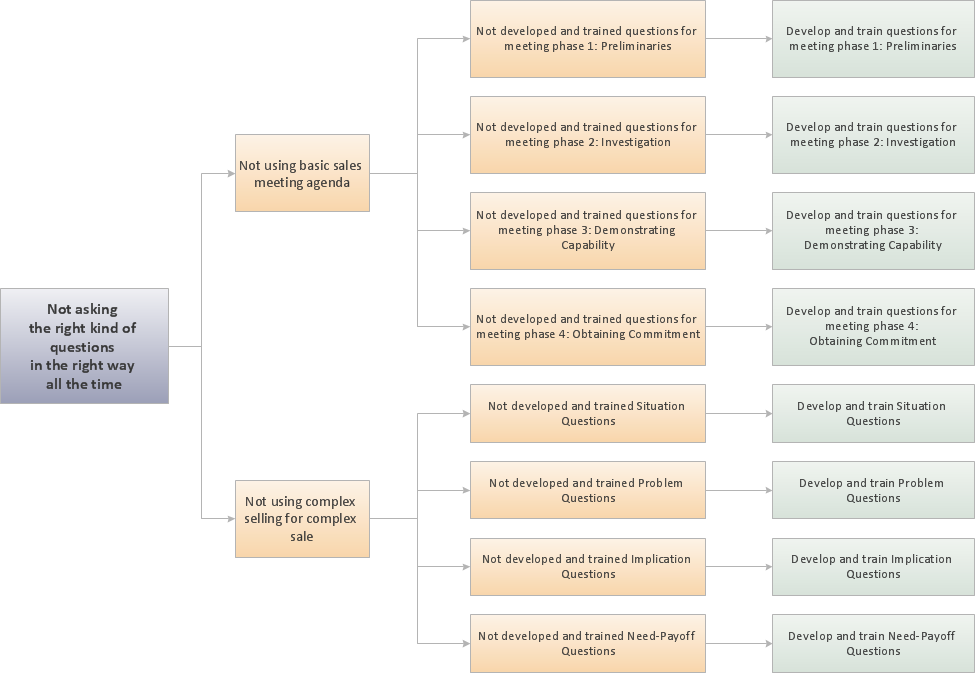
Cause and Effect Analysis - The Seven Management and Planning Tools is a tool for Cause and Effect Analysis that allows users to analyze the root causes for factors that influenced the problem. This diagram is constructed separately for each highly prioritized factor. The Diagram is then used for further formulation of potential actions.
CORRECTIVE ACTIONS PLANNING. Risk Diagram (PDPC)
Risk Diagram (PDPC) - ConceptDraw Office suite is a software for Risks Diagram making. This diagram identifies possible risks in accomplishing corrective actions. With the Risks Diagram, one analyzes each action separately in a tree of all actions and develops a preventive action in response of each potential obstacles or circumstances which may be a risk.
Decision Making
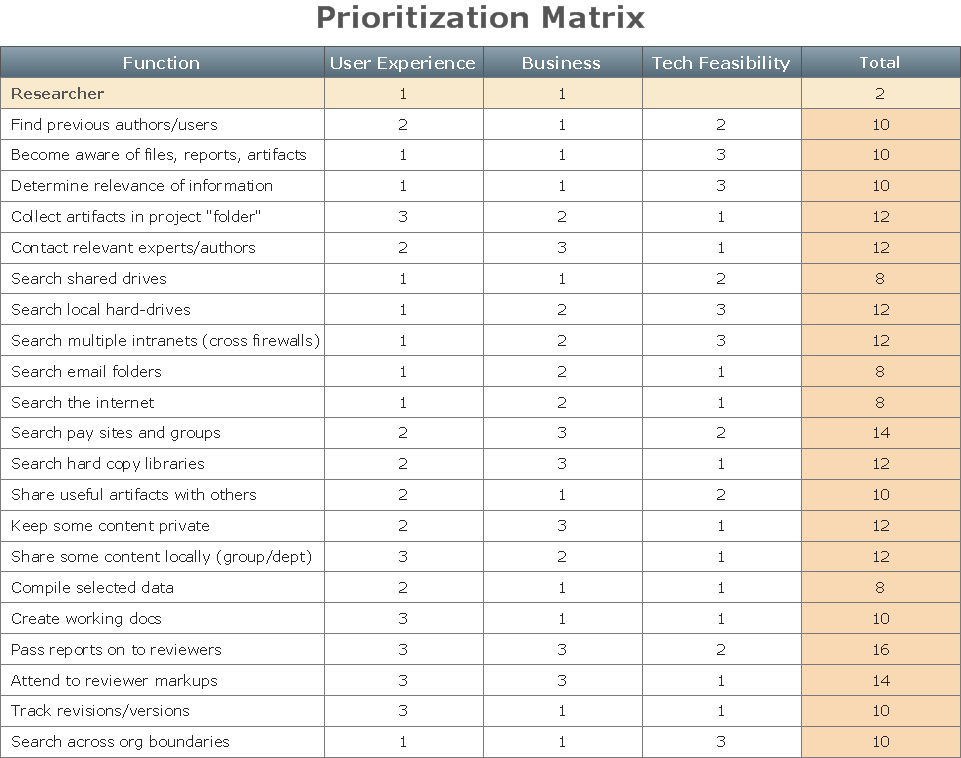
Decision Making - ConceptDraw Office suite provides visual tools that are given support on the stage of the decision making.The Seven Management and Planning Tools is a set for such diagrams: Affinity Diagram, Relations Diagram, Prioritization Matrix, Root Cause Tree Diagram, Involvement Matrix, PERT Chart, Risk Diagram (PDPC).

Prioritization Matrix
You can design the Prioritization Matrix by hand on the paper, but we offer you the most easier way - to use the ConceptDraw PRO diagramming and vector drawing software extended with Seven Management and Planning Tools Solution from the Management Area.Corrective Action Planning
One of the stages of the problem's solving process scenario is Corrective Action Planning.Corrective action planning define people and groups involvement in corrective actions by roles, identify logical sequences of scheduled actions and critical path of problem solving, identify possible risks of action plan and propose preventive actions.

"Process Decision Program Chart (PDPC).
A useful way of planning is to break down tasks into a hierarchy, using a tree diagram. The PDPC extends the tree diagram a couple of levels to identify risks and countermeasures for the bottom level tasks. Different shaped boxes are used to highlight risks and identify possible countermeasures (often shown as 'clouds' to indicate their uncertain nature). The PDPC is similar to the Failure Modes and Effects Analysis (FMEA) in that both identify risks, consequences of failure, and contingency actions; the FMEA also rates relative risk levels for each potential failure point." [Seven Management and Planning Tools. Wikipedia]
The Risk diagram (process decision program chart, PDPC) determines the risks when corrective action is not performed correctly. Also, it helps develop descriptions for preventive actions at the level of execution.
The Risk diagram (PDPC) template for the ConceptDraw PRO diagramming and vector drawing software is included in the solution "Seven Management and Planning Tools" from the Management area of ConceptDraw Solution Park.
PROBLEM ANALYSIS. Root Cause Analysis Tree Diagram
Root Cause Analysis Tree Diagram. Use the Root Cause Diagram to perform visual root cause analysis. Root Cause Analysis Tree Diagram is constructed separately for each highly prioritized factor. The goal of this is to find the root causes for the factor and list possible corrective action.ConceptDraw Office suite is a software for problem analysis.

The Action Plan
Action Plan - For the action planning define people and groups involvement in corrective actions by roles, identify logical sequences of scheduled actions and critical path of problem solving, identify possible risks of action plan and propose preventive actions.ConceptDraw Office suite is a software for decision making and action plan.

"Process Decision Program Chart (PDPC) is a technique designed to help prepare contingency plans. The emphasis of the PDPC is to identify the consequential impact of failure on activity plans, and create appropriate contingency plans to limit risks. Process diagrams and planning tree diagrams are extended by a couple of levels when the PDPC is applied to the bottom level tasks on those diagrams. ...
From the bottom level of some activity box, the PDPC adds levels for:
(1) identifying what can go wrong (failure mode or risks);
(2) consequences of that failure (effect or consequence);
(3) possible countermeasures (risk mitigation action plan)." [Process decision program chart. Wikipedia]
The process decision program chart (PDPC) example "Personal activity" was created using the ConceptDraw PRO diagramming and vector drawing software extended with the solution "Seven Management and Planning Tools" from the Management area of ConceptDraw Solution Park.
Preventive Action
Preventive Action - ConceptDraw Office suite is a software for the Preventive Action making. The Seven Management and Planning Tools solution is a set of such tools for problems preventive actions via investigating of the core problem.Skilled use of these diagrams makes collaborative teamwork both more engaging and more effective.

PDPC
ConceptDraw PRO extended with Seven Management and Planning Tools Solution from the Management Area of ConceptDraw Solution Park is the best software for drawing all types of diagrams from the Seven Management and Planning Tools: Affinity Diagram, Relations Diagram, Prioritization Matrix, Root Cause Analysis Tree Diagram, Involvement Matrix, PERT Chart, and Risk Diagram (PDPC).Root Cause Analysis
The Seven Management and Planning Tools is a tool for Root Cause Analysis Tree Diagram drawing. This diagram is for Root Cause Analysis.Analyze the root causes for factors that influenced the problem. This diagram is constructed separately for each highly prioritized factor. The goal of this is to find the root causes for the factor and list possible corrective action.

HelpDesk
How to Manage Problem Solving Using Seven Management and Planning Tools
Stage by stage gouide on using visual tools to move toward solving the problem.
TQM Diagram — Professional Total Quality Management
The Total Quality Management Diagram solution helps you and your organization visualize business and industrial processes. Create Total Quality Management diagrams for business process with ConceptDraw software.Decision Making Software For Small Business
A software tool that saves your time on making decisions now has the ability to make decisions with remote team via Skype.
- Decision tree diagram | Decision Making | Influence Diagram ...
- Decision Making | Block diagram - Customer decision making ...
- Decision tree diagram | Decision Making | Influence Diagram ...
- Decision Tree Maker
- Example Decision Tree Diagram Software
- Decision Making | Decision tree diagram | Influence Diagram ...
- Decision Making Trees In Healthcare
- Decision Making | CORRECTIVE ACTIONS PLANNING. Risk ...
- Risk diagram (PDPC) - Template | PDPC | CORRECTIVE ACTIONS ...
- Process decision program chart (PDPC) - Personal activity | Risk ...
- Risk Analysis | CORRECTIVE ACTIONS PLANNING. Risk Diagram ...
- Online Decision Tree Maker
- Process decision program chart (PDPC) - Personal activity ...
- Decision Making | How To Make the Right Decision in Projects ...
- Decision Tree Software
- Decision Making | Corrective Action Planning | CORRECTIVE ...
- How To Create Risk Diagram (PDPC) | How to Manage Problem ...
- PROBLEM ANALYSIS. Root Cause Analysis Tree Diagram | Project ...
- CORRECTIVE ACTIONS PLANNING. Risk Diagram (PDPC ...
- Decision Making | PROBLEM ANALYSIS. Root Cause Analysis Tree ...


---template.png--diagram-flowchart-example.png)


---personal-activity.png--diagram-flowchart-example.png)


