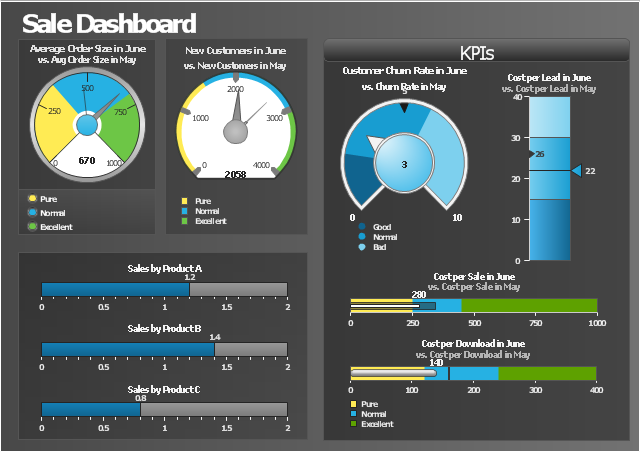
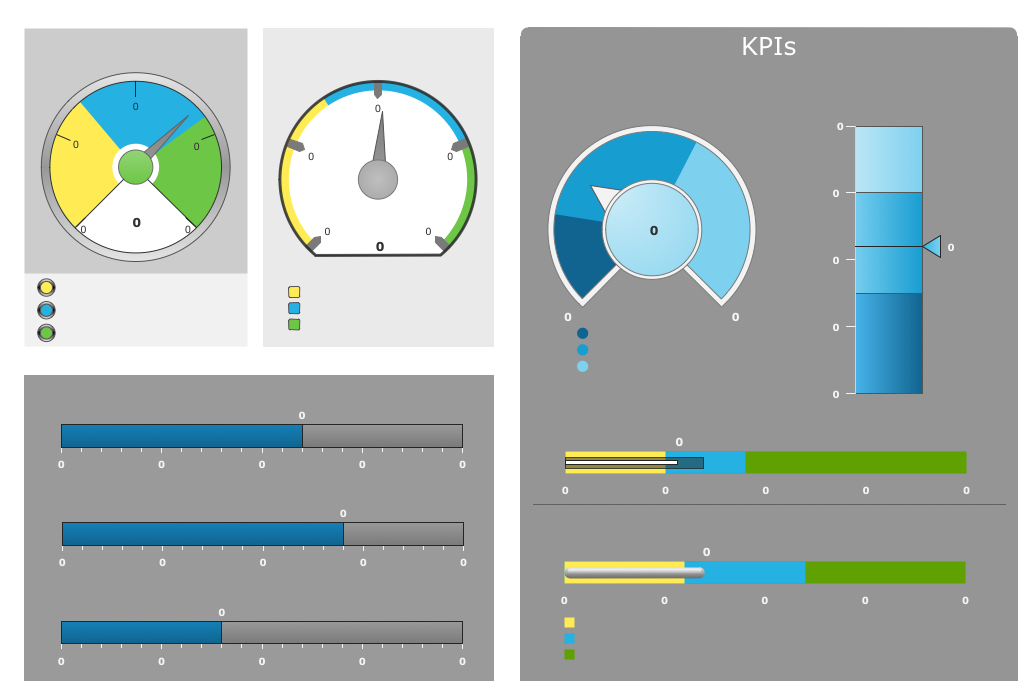
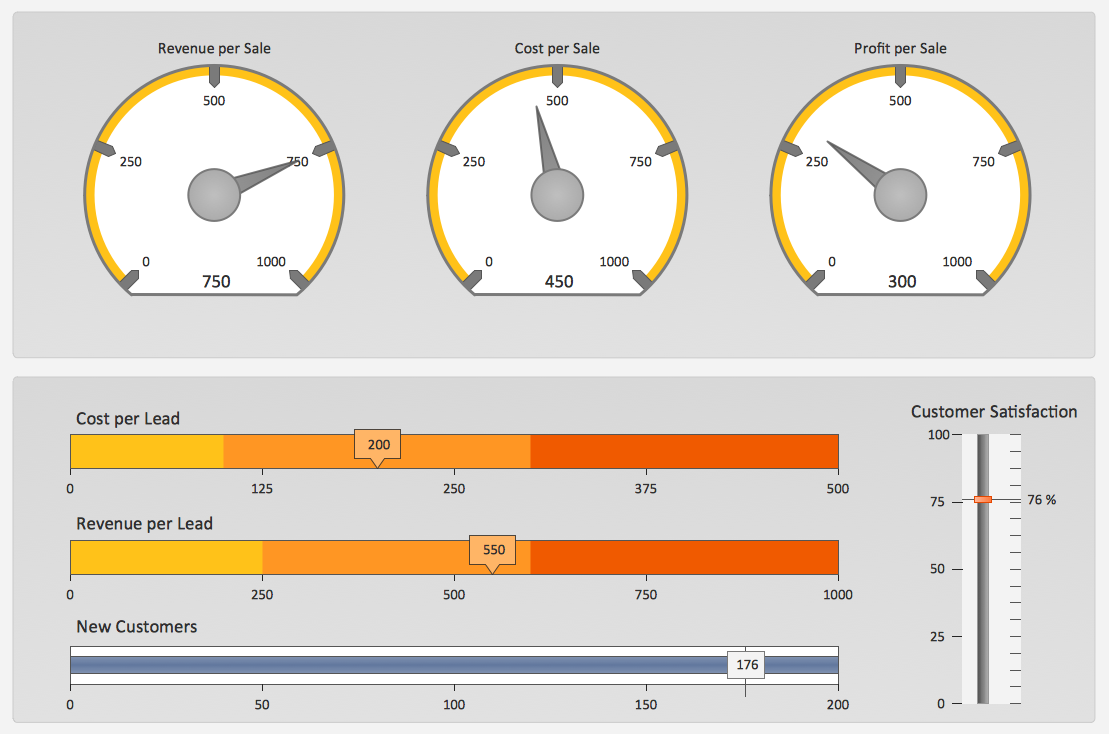
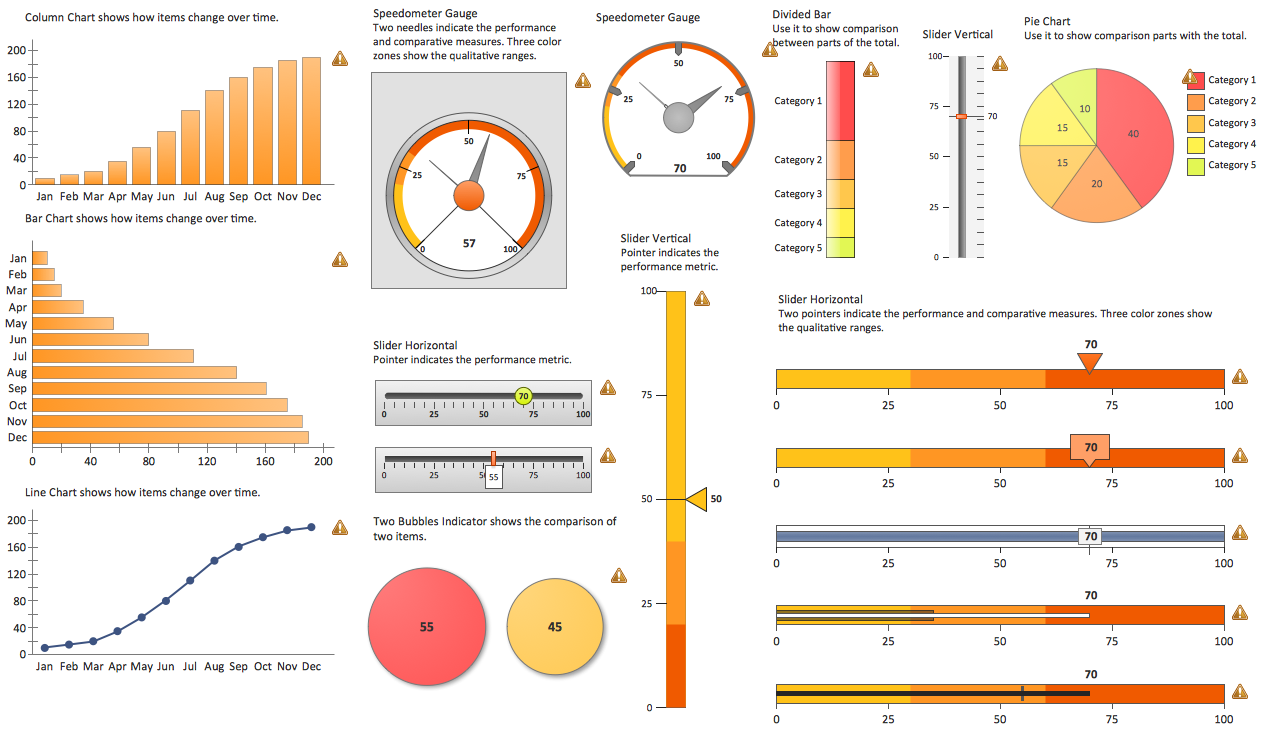
This sale dashboard example contains KPIs and sales effectiveness metrics visual indicators: speedometer gauge, dial, slider, level meter and bullet indicators.
"Sales effectiveness refers to the ability of a company’s sales professionals to “win” at each stage of the customer’s buying process, and ultimately earn the business on the right terms and in the right timeframe.
Improving sales effectiveness is not just a sales function issue; it’s a company issue, as it requires deep collaboration between sales and marketing to understand what’s working and not working, and continuous improvement of the knowledge, messages, skills, and strategies that sales people apply as they work sales opportunities.
Sales effectiveness has historically been used to describe a category of technologies and consulting services aimed at helping companies improve their sales results.
Many companies are creating sales effectiveness functions and have even given people titles such as VP of Sales Effectiveness." [Sales effectiveness. Wikipedia]
The example "Sales metrics and KPIs" was created using the ConceptDraw PRO diagramming and vector drawing software extended with the Meter Dashboard solution from the area "What is a Dashboard" of ConceptDraw Solution Park.
A KPI Dashboard Provides the Answers Your Sales Team
Sales dashboard is a tool that provides the answers to all questions your sales team may have. A mature sales dashboard provides complete set of KPI to shows corporate, team or personal performance to keep sales process clear.Customer Relationship Management
Customer relationship management is an important component of sales success. Visualizing sales data you may put some KPI related to customers relationship management to your Sales dashboard and track this important aspect in real time.Empower Your Sales Team With a Sales Dashboard
ConceptDraw Sales Dashboard solution allows you empower your sales team with a sales dashboard that visualizes all team and personal KPI your team need to work effectively.Data Visualization Software Solutions
To see how your business can improve you can try data visualization software solutions that allows you visualize all your sales KPI in one sales dashboard allows you monitor and analyse sales activities.What is a KPI?
What is a KPI? Key performance indicators (KPIs) represent a set of measures that are focused on the aspects of organizational performance which are the most important for its current and future success. ConceptDraw PRO diagramming and vector drawing software enhanced with Sales Dashboard solution from the Marketing area of ConceptDraw Solution Park allows effectively develop, analyze and improve your business thanks to the excellent possibility of monitoring all KPIs on one screen in a real time.Sales Dashboard Solutions can help your sales team keep an eye on performance
ConceptDraw Sales Dashboard Solution is a simple and effective way of visualizing sales data and get clear picture of your sales process to see how your business can improve.Business Intelligence Dashboard Software
ConceptDraw PRO is a business intelligence dashboard software that allows you produce sales dashboard that suites your specific needs. To see how your business can improve with sales dashboards select KPI and start tracking it.Sales Dashboard - Access Anywhere
ConceptDraw Sales Dashboard is an automatically updated sales dashboard you can customize to see KPI you need. You can access sales dashboard anywhere to get fresh data and use any minute to see how your business can improve.
 Sales Dashboard
Sales Dashboard solution extends ConceptDraw PRO software with templates, samples and library of vector stencils for drawing the visual dashboards of sale metrics and key performance indicators (KPI).
Sales Teams are Inherently Competitive
Sales teams are inherently competitive, so you don't need to invent extra ways to stimulate the competition. At the same time, you can provide the team with a sales dashboard shows company, team and personal KPI to make the competition clear.The Facts and KPIs
Visualizing sales data help you see the facts and KPIs about your sales process to make conclusions and see how your business can improve.Definition TQM Diagram
The Total Quality Management Diagram solution helps your organization visualize business and industrial processes. Create Total Quality Management diagrams for business process with ConceptDraw software.Sales Dashboards for Your Company
ConceptDraw PRO software extended with the Sales Dashboard solution allows you produce sales dashboards for your company easily. You can start from samples and templates delivered with the solution and then modify them to get a dashboard that suites your specific needs.PROBLEM ANALYSIS. Relations Diagram
Use the Relations Diagram to create a relations factors map and to identify which factors are “drivers” and “indicators”. This diagram identifies causal relationships and determine what factors are causes or effects. ConceptDraw Office suite is a software for relation diagram making.
- KPIs and Metrics | Sales metrics and KPIs - Visual dashboard ...
- Sales metrics and KPIs - Visual dashboard | Sales KPIs ...
- Cross-functional flowchart Templates portrait, metric | KPIs and ...
- Sales metrics and KPIs - Visual dashboard | The Sales Process ...
- Design elements - Meter indicators | Sales metrics and KPIs - Visual ...
- Sales Dashboards for Your Company | A KPI Dashboard | Sales ...
- KPIs and Metrics | Sales metrics and KPIs - Visual dashboard | KPI ...
- Cafe performance metrics vs. air temperature - Visual dashboard ...
- Process Mapping | Drawing Workflow Diagrams | Sales metrics and ...
- Illustration | UML composite structure diagram - Drive a taxi | Sales ...
- Sales metrics and KPIs - Visual dashboard | Sales dashboard ...
- Sales metrics and KPIs - Visual dashboard | KPIs and Metrics | What ...
- The Facts and KPIs | KPIs and Metrics | Website KPIs - Visual ...
- Sales Dashboard | Meter Dashboard | Sales Dashboard Examples ...
- Sales KPI Dashboards
- Sales metrics and KPIs - Visual dashboard | Website KPIs - Visual ...
- Sales Dashboard | How to Create a Sales Dashboard Using ...
- KPIs and Metrics | Sales KPIs and Metrics - Vector stencils library ...
- Process Flowchart | Sales Process Flowchart Symbols | F&B ...


