Business Process
A business process is an activity or set of related and structured activities or tasks, which are used to accomplish a specific organizational goals, are directed on the production some specific product or service for particular customers. To measure the success of the business process within an organization is used the tracking of benchmarks, for improvement the business processes is applied the approach named as business process management. For visual depiction and modeling the business processes are successfully used the Mind Maps and Flowcharts. ConceptDraw MINDMAP is ideal software for business process mapping, business process diagramming and business modeling. It offers all needed tools for fast and easy designing the Business Process Mind Maps and Business Process Diagrams (Process Charts, Business Process Modeling Diagrams, Cross-Functional Flowcharts, Workflows, Timeline Diagrams, Calendars, Gantt Charts, IDEF0 and IDEF2, Audit and Opportunity Flowcharts), for visual documenting and communication the business process information, creation vivid presentations.How to Deliver Presentations using Mind Maps
Creating and organizing presentations, structuring received presentations, presenting mind maps, and preparing for public presenting.Concept Map Maker
ConceptDraw DIAGRAM diagramming and vector drawing software extended with Concept Maps Solution from the "Diagrams" Area is a powerful Concept Map Maker.Samples of Flowcharting
This sample shows the Flowchart for determine is a species heterotroph or autotroph, or a subtype. This diagram has start point and end points. The diamonds on the Flowchart represent the decisions. The Flowcharts are widely used in science, analytics, government, politics, business, engineering, architecture, marketing, manufacturing, administration, etc.HelpDesk
How to Create a Sales Flowchart
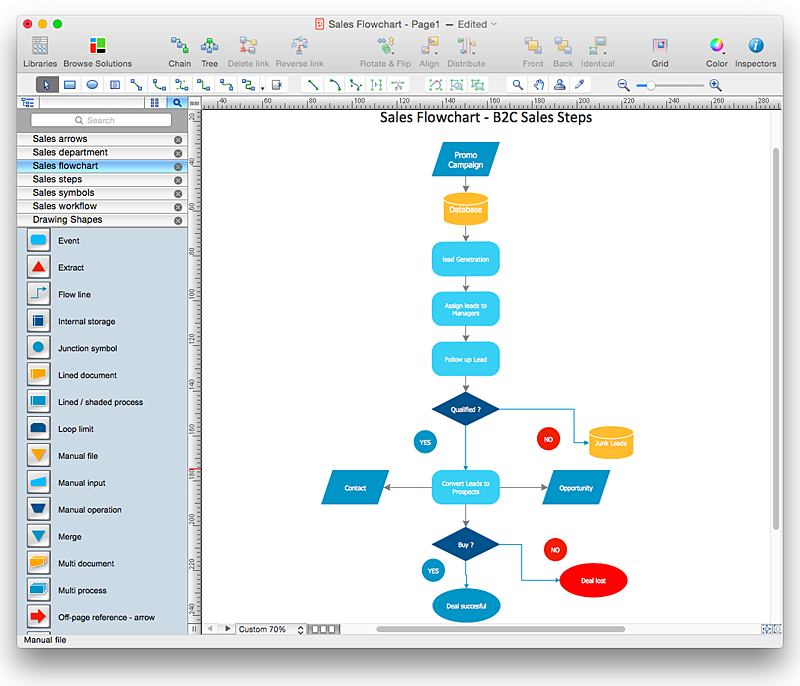
A Sales flowchart is a specialized type of flowchart. With the help of a sales flowchart, you can visually describe tasks, documents, people responsible for execution at each stage of the sales process. For most commercial organizations, the sales process is inherent to its existence and ability to create profit. Although each company will achieve this aim in its own way, the core selling process remains similar throughout — a potential buyer or prospective customer exchanges money with an organization in return for goods or services. Despite this rather simplistic definition, there exists a huge scope as to which approach is taken. Indeed, it is not uncommon for the sales division to be the largest within a corporate structure, employing a team of salespeople, analysts, and the sales managers, who are in charge of sales division operations. The practical applications of sales process flowcharts are numerous and wide-ranging. At sales level, you might map the process of customer interact8 Step Problem Solving
Time by time the problems appear in any field of our life and activities, and we can't to escape this. Any problem always has a certain content, the reasons and the circle of involved people. But the main task of any human, any organization, any company that was faced with a problem, is not to get lost and vice versa confidently look for the ways of solving this problem. The first you need to clarify the problem's essence, then to breakdown your problem and set a target. The most responsible step is to identify the cause-effect relationship, because each problem has its own root causes, and their detection will allow qualitatively solve this problem and avoid the similar problems in a future. Then you need to develop the countermeasures to counter the root cause of the problem and to make sure in their effectiveness, that they lead to the desired results. And finally standardize successful processes. This Mind Map designed with help of ConceptDraw MINDMAP software represents step-by-step the 8 steps approach of solving any kind of product or service problems.Sales Process Flowchart Symbols
The most easier way of creating the visually engaging and informative Sales Process Flowchart is to create the new ConceptDraw document and to use the predesigned vector symbols offered in 6 libraries of the Sales Flowchart Solution. There are more than six types of sales process flow diagrams, ConceptDraw DIAGRAM software is flowchart maker which include six collections of extended flowchart symbols for effective diagramming. There are main collections of color coded flowchart symbols: Sales Department, Sales Steps, Sales Workflow, Sales Symbols and special set of Sales Arrows and Sales Flowchart.Accounts Payable Process Flow Chart
Accounts Payable Process Flow Chart - ConceptDraw DIAGRAM diagramming and vector drawing software extended with Accounting Flowcharts Solution provides the useful tools that will help you create easily and quickly. The Accounts Payable Process Flow Chart is very popular and widely used type of accounting flowcharts. Now their designing is simple thanks to the Accounting Flowcharts Solution that provides the Accounting Flowcharts library of predesigned commonly-used shapes and a set of templates and samples.Best Flowchart Software and Flowchart Symbols
For many years ConceptDraw Solution Park delivers a great quantity of high-quality business process flowchart and flow diagram solutions, which are turned the ConceptDraw DIAGRAM into the most comprehensive and powerful software. Now it is an example of the best professional flowchart software available with extensive set of solutions, including the Flowcharts solution. The ConceptDraw solutions contain thousands of standard basic and creative flowchart symbols and other design elements, numerous quick-start templates, samples and examples. ConceptDraw DIAGRAM diagramming and vector graphics software includes specific drawing tools that you need to easily design the flowcharts and diagrams of any complexity and degree of detailing. Use ConceptDraw DIAGRAM to draw your own diagrams, charts, graphs and flowcharts for graphic communication, simple visual presentation of complex structures, numerical data and logical relations, explanation business and personal ideas and concepts, representation step-by-step flows of actions or operations, etc. Sales Process FlowchartFlowchart Examples
Sales Process Flowchart is an invaluable tool for business. It gives you opportunity to visualise and better understand the sales process, reveal and also visually highlight issues or bottlenecks, and predict the number of sales. The Flowchart is ideal method to represent in details all steps of the process, tasks and decisions needed to obtain maximum effectiveness and success. The steps are graphically represented by boxes linked with arrows indicating direction of the workflow, decision is shown by diamond. The sales process is closely linked to the company's success and usually includes the following main steps: Product knowledge, Prospecting, Planning the sale (Pre-approach), Approach, Need assessment, Presentation, Meeting objections, Gaining commitment, Follow-up.
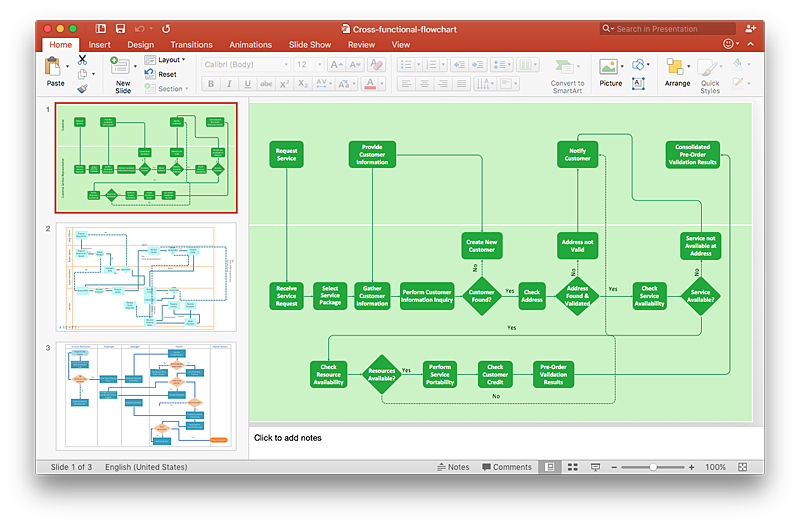
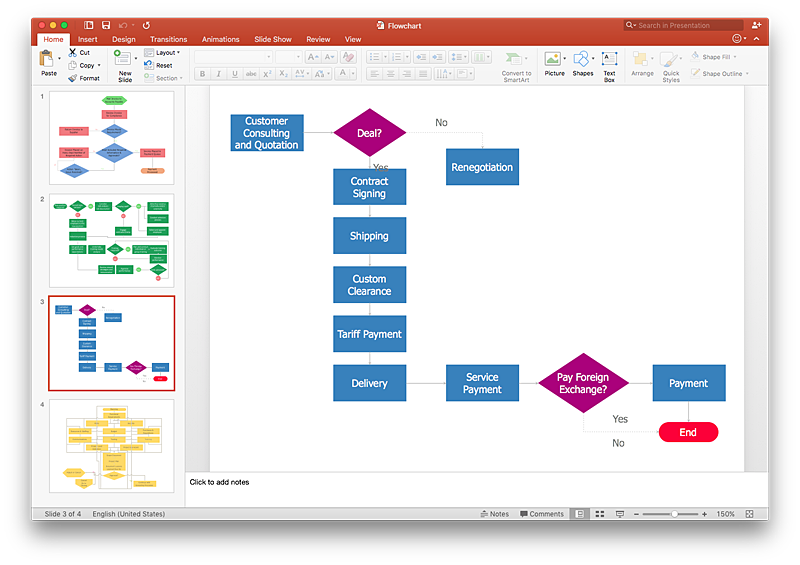
Create fast and easy your own Flowcharts of sales business processes using the ConceptDraw DIAGRAM ector graphic software extended with Cross-Functional Flowcharts solution from Business Processes area and also Sales Flowcharts solution from Marketing area of ConceptDraw Solution Park.
Sales Flowcharts
The Sales Flowcharts solution lets you create and display sales process maps, sales process workflows, sales steps, the sales process, and anything else involving sales process management.
The vector stencils library "Sales symbols" contains 55 sales pictograms.
Use these icon set to draw your sales flowcharts, workflow diagrams and process charts with the ConceptDraw PRO diagramming and vector drawing software.
The vector stencils library "Sales symbols" is included in the Sales Flowcharts solution from the Marketing area of ConceptDraw Solution Park.
Use these icon set to draw your sales flowcharts, workflow diagrams and process charts with the ConceptDraw PRO diagramming and vector drawing software.
The vector stencils library "Sales symbols" is included in the Sales Flowcharts solution from the Marketing area of ConceptDraw Solution Park.
The vector stencils library "Sales symbols" contains 55 sales process pictograms.
Use it to design your sales flowcharts, workflow diagrams and process charts by the ConceptDraw PRO diagramming and vector drawing software.
"A sales process is an approach to selling a product or service.
... a "sales process" is presented as consisting of eight steps. These are:
(1) Prospecting / initial contact,
(2) Preapproach - planning the sale,
(3) Identifying and cross questioning,
(4) Need assessment,
(5) Presentation,
(6) Meeting objections,
(7) Gaining commitment,
(8) Follow-up." [Sales process. Wikipedia]
The icons example "Design elements - Sales symbols" is included in the Sales Flowcharts solution from the Marketing area of ConceptDraw Solution Park.
Mac Compatible Remote Presentation
Mac compatible remote presentation, A simple way to share your presentation remotely via Skype. All participants receive presentation file.Visual Presentations Made Easy with Diagramming Software
Automatically create a presentation-quality diagram in one click with ConceptDraw DIAGRAM.Swim Lanes Flowchart. Flowchart Examples
This sample was created in ConceptDraw DIAGRAM diagramming and vector drawing software using the Cross-Functional Flowcharts solution from the Business Processes area of ConceptDraw Solution Park. This sample shows the Swim Lanes Flowchart of Identification and logging.Sales Process Flowcharts
ConceptDraw DIAGRAM diagramming and vector drawing software extended with Sales Flowcharts solution from the Marketing area of ConceptDraw Solution Park offers the set of extensive tools for quick and easy drawing professional looking Sales Process Flowcharts.Chart Maker for Presentations
Easy charting software comes with beautiful chart templates and examples. This makes it easy to create professional charts without prior experience.Do I Want to Go to Party
Mind Maps is an advanced decision-making technology, the spectrum of their application is extremely wide. The Mind Map algorithm is intuitive and involves abstractly-logical as well as figuratively-spatial thinking. Mind Maps allow effectively solve the business problems and help to make decisions more carefully. They allow to collect all information related to the task on a single sheet and to keep in sight all the pros and cons of one or other decision. The use of colors and visual images allows to activate associative thinking and intuition. Start a Mind Map design with representation of the main idea in center of the sheet. Place on the branches around the main idea the key means to achieve a goal and connect them with lines to the center. Then attach the topics with additional information. Use different colors for the main idea, for the branches and ideas of different levels, also symbols and drawings to illustrate the most important things on a Mind Map, and arrows to show relationships between the elements. In many cases, the process of drawing a Mind Map leads a person to the desired decision. ConceptDraw MINDMAP software allows you professionally design Mind Maps and visually explore the pros and cons for making decision.- How to Create a Sales Flowchart Using ConceptDraw PRO | Sales ...
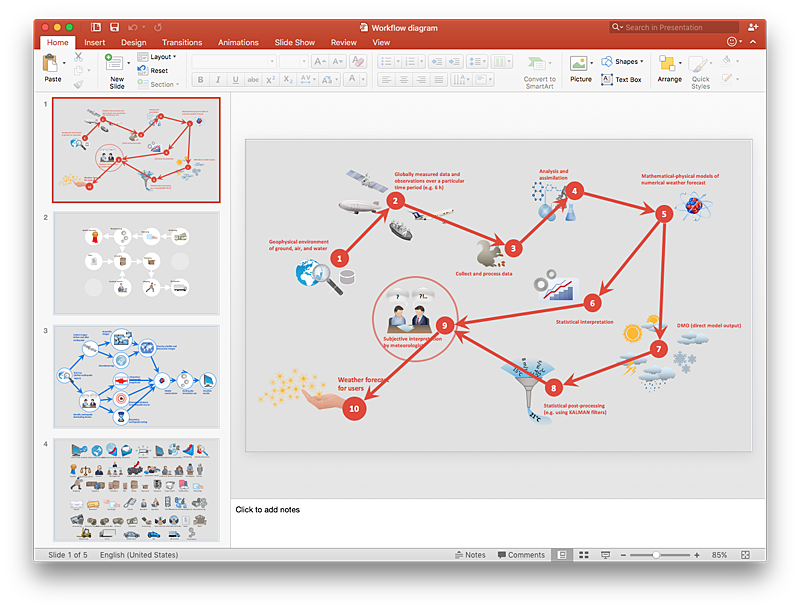
- How to Add a Workflow Diagram to a PowerPoint Presentation ...
- Sales Process Flowchart Symbols | Process Flowchart | Presentation ...
- How to Add a Cross-Functional Flowchart to a PowerPoint ...
- Sales Process Management | Process Flowchart | Skype Presentation
- How to Add a Cross-Functional Flowchart to a PowerPoint ...
- Presentation design elements - Vector clipart library | Sales flowchart
- Sales Dashboard | Presentation Exchange | Accounting Flowcharts ...
- Basic Flowchart Symbols and Meaning | Sales Call | How to do ...