HelpDesk
How to Create Flowchart Using Standard Flowchart Symbols
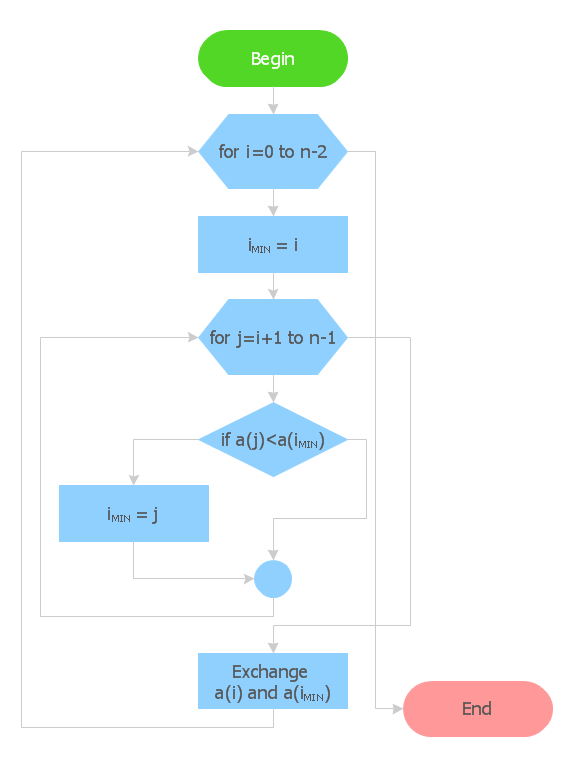
Flowcharts are used to display an algorithm for consistent execution of certain steps. Flowchart is probably the easiest way to make a graphical representation of any process. Flowcharts use the set of standard geometric symbols and arrows to define relationships. ConceptDraw PRO allows you to create professional flowchart quickly and easily. The ability to create flowcharts is contained in the Flowcharts solution. The solution provides a set of special tools for creating flowcharts.HelpDesk
How to Create a Sales Flowchart Using ConceptDraw PRO
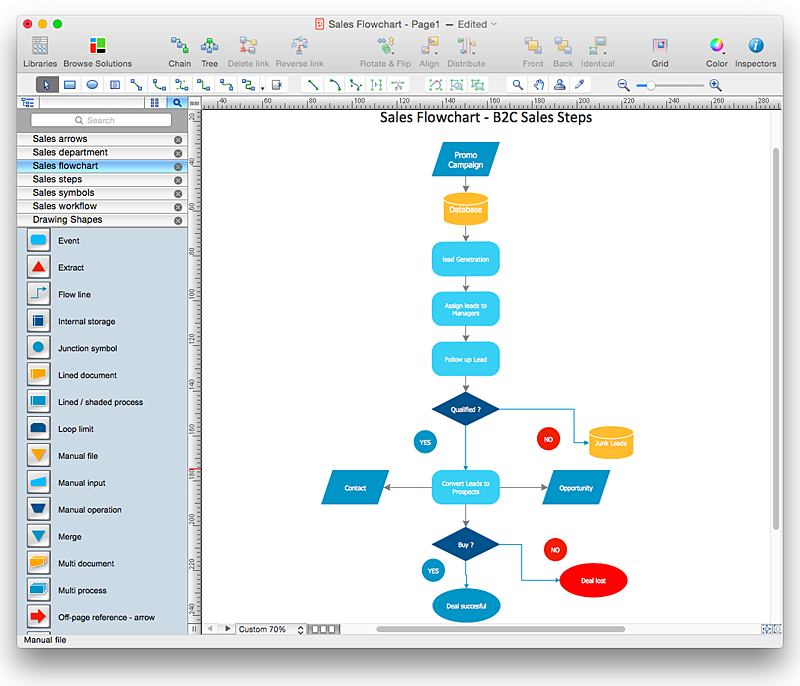
A Sales flowchart is a specialized type of flowchart. With the help of a sales flowchart you can visually describe tasks, documents, people responsible for execution at each stage of the sales process. For most commercial organizations, the sales process is inherent to its existence and ability to create profit. Although each company will achieve this aim in its own way, the core selling process remains similar throughout — a potential buyer or prospective customer exchanges money with an organization in return for goods or services. Despite this rather simplistic definition, there exists huge scope as to which approach is taken. Indeed, it is not uncommon for the sales division to be the largest within a corporate structure, employing a team of salespeople, analysts, and the sales managers, who are in charge of sales division operations.The practical applications of sales process flowcharts are numerous and wide ranging. At sales level, you might map the process of customer interactHelpDesk
How to Create a Cross - Functional Flowchart Using ConceptDraw PRO
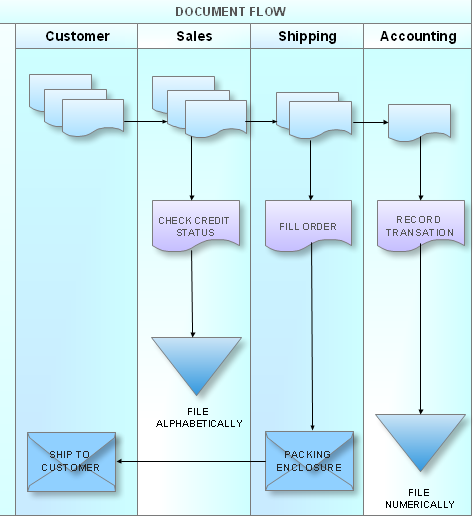
Cross-functional flowcharts are used to visualize cross-functional processes. Cross-functional process is a process that involves multiple divisions, each of which makes its part of the entire company workflow. For example: product development, lead management , client orders processing – and other critical processes. All of them are important both for business and customers, but the workflow and responsibilities distribution within these processes are divided between multiple departments and services. Cross-functional processes cannot be depicted with simple workflow diagrams, because of the specific interactions between company departments. ConceptDraw PRO has released the specialized solution to create cross-functional diagrams. Cross Functional Flowcharts solution includes a special set of templates and libraries to depict the cross-functional processes.
HelpDesk
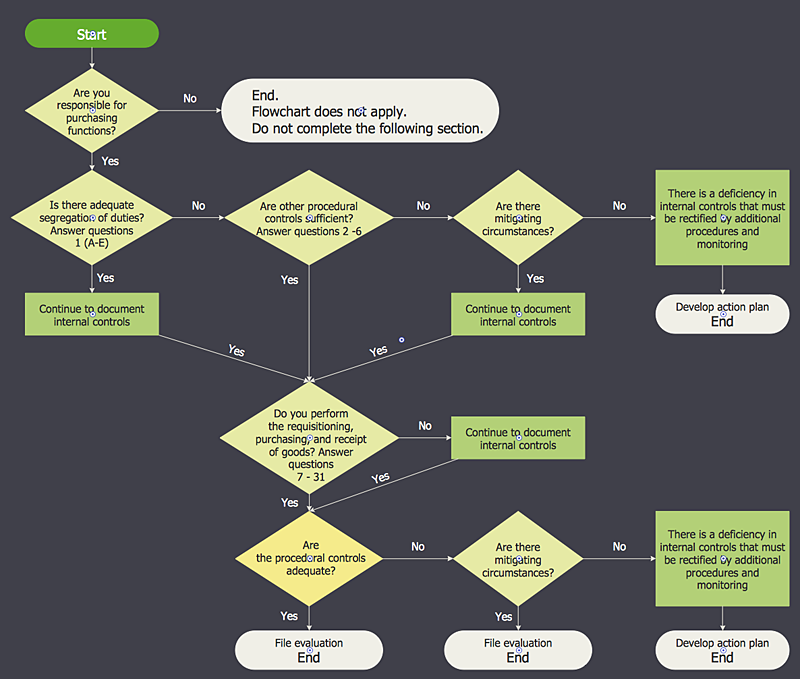
How to Create an Audit Flowchart Using ConceptDraw PRO
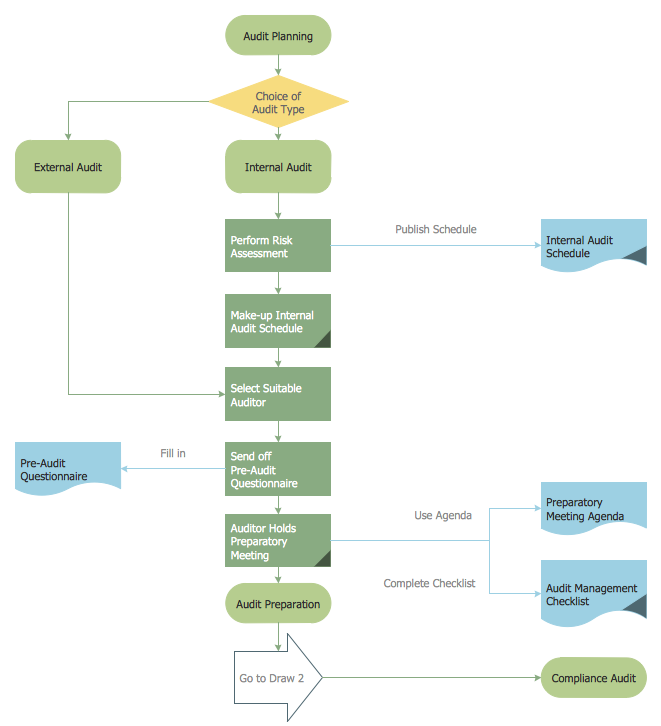
Audit flowcharts are often used in auditors activity. This is the most effective way of preparation and documentation of the audit process. Financial audit process has a clear structure, and therefore audit flowchart is often used to denote an audit process. This is the most effective way of preparation and documentation of the audit process. Flowcharts are often used in auditors activity. A flowchart may be created at any stage of an audit process as an aid in the determination and evaluation of a client's accounting system. ConceptDraw PRO allows you to create professional accounting flowchart quickly using the professional Audit Flowcharts solution.HelpDesk
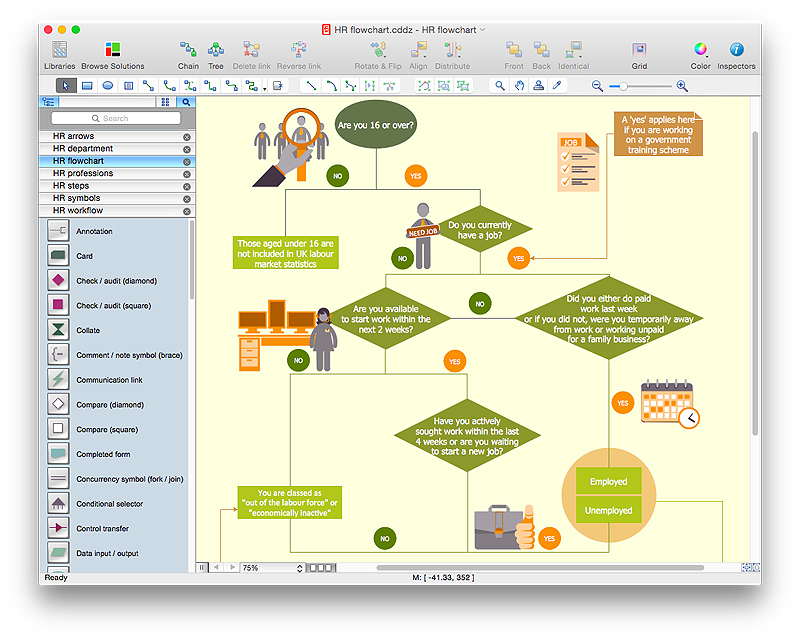
How to Create a HR Process Flowchart Using ConceptDraw PRO
One of the useful tools of each HR specialist is a HR Process Flowchart. HR Flowchart renders step-by-step the process of Human Resource management in any organization. HR flowchart shows the flow of all HR processes, identifies and standardizes the list of mandatory documents required for the implementation of all HR procedures, including the recruiting process. Usually, the descriptions of entire HR processes in a company requires a big set of graphic documents. They must be regularly redrawn to maintain up to date. The best tool for this is ConceptDraw PRO - the best software to create process flow diagrams of various types. In conjunction with ConceptDraw HR flowchart solution, it delivers comprehensive tool-set for human resource management.HelpDesk
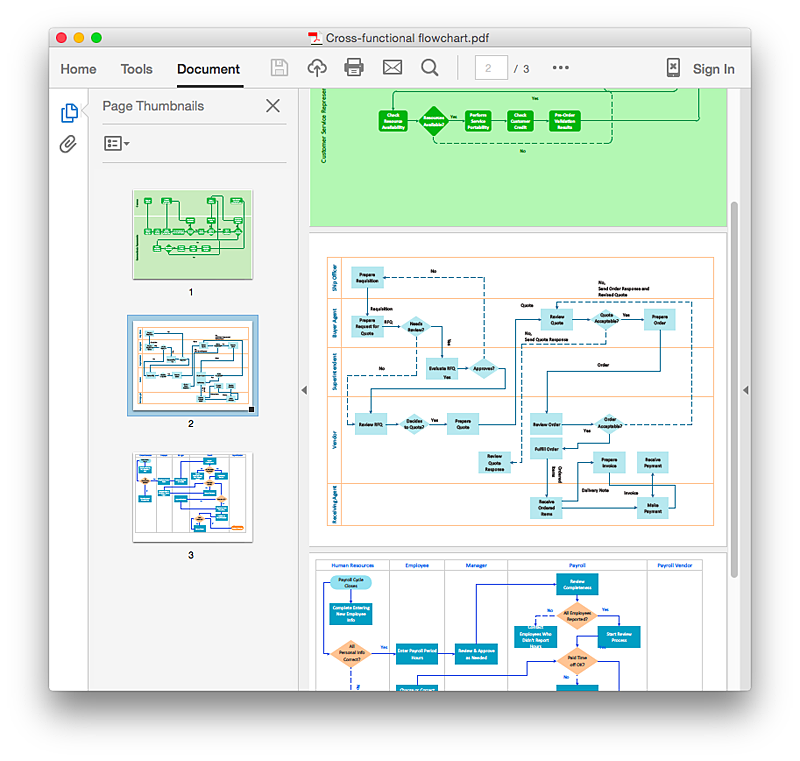
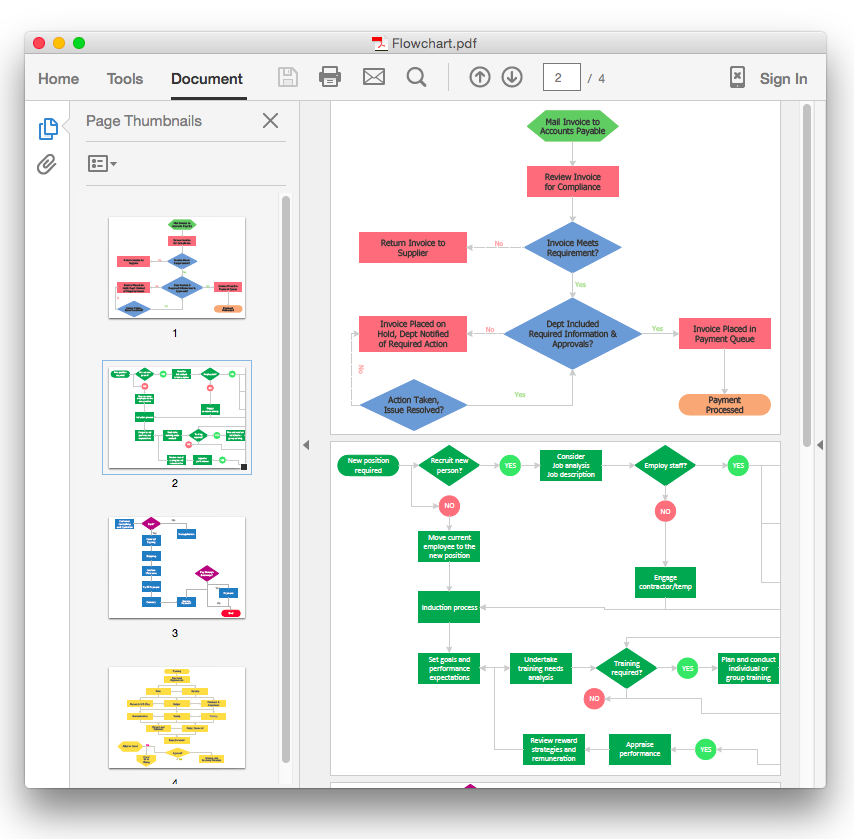
How to Add a Cross-Functional Flowchart to an Adobe PDF Using ConceptDraw PRO
ConceptDraw PRO allows you to easy share your business process documentation between different computers with different operating systems and applications using it's export capabilities. You can get your cross-functional flowcharts in pdf format and avoid any problems while communicating them.HelpDesk
How to Create an Accounting Flowchart Using ConceptDraw Solution Park
An Accounting flowchart is a specialized type of flowchart. With the help of an accounting flowchart you can visually describe tasks, documents, people responsible for execution at each stage of accounting workflow. Find out how you can easily create an accounting flowchart of any complexity using Accounting Flowchart Solution from the ConceptDraw Solution Park.HelpDesk
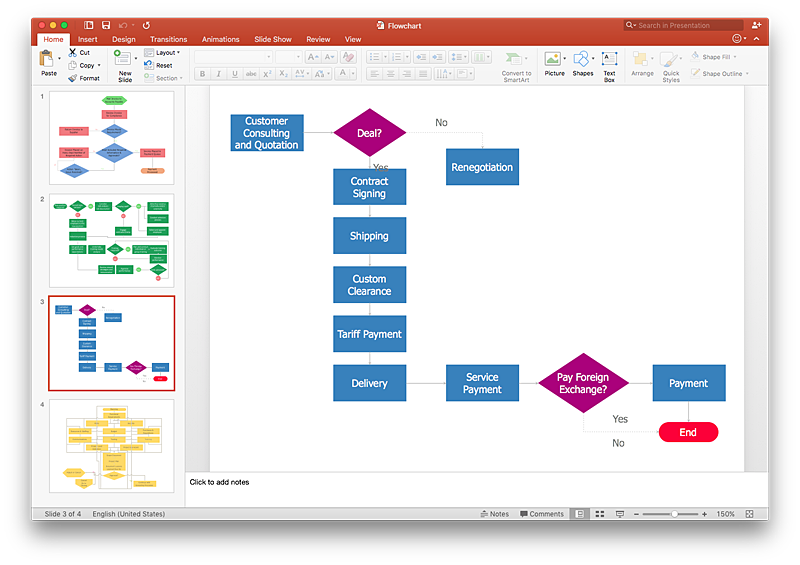
How To Make a PowerPoint Presentation of Flowcharts Using ConceptDraw PRO
ConceptDraw PRO allows you to create professional flowchart quickly and easily. The ability to create flowcharts is contained in the Flowcharts solution. To submit flowcharts for the audience, you can use export to MS PowerPoint.HelpDesk
How to Create a Timeline Diagram in ConceptDraw PRO
A Timeline is a chart which displays a project plan schedule in chronological order. A Timeline is used in project management to depict project milestones and visualize project phases, and show project progress. The graphic form of a timeline makes it easy to understand critical project milestones, such as the progress of a project schedule. Timelines are particularly useful for project scheduling or project management when accompanied with a Gantt chart. It captures the main of what the project will accomplish and how it will be done. making a project timeline is one of the most important skills a project manager needs have. Making comprehensive, accurate timelines allows you getting every project off in the best way. ConceptDraw PRO allows you to draw a timeline charts using special library.HelpDesk
How To Convert a Flowchart to Adobe PDF Using ConceptDraw PRO
ConceptDraw PRO allows you to easy exchange your drawings between different computers with different operating systems and applications using it's export capabilities. You can get clear business documentation in pdf format and avoid any problems while communicating it with stakeholders.HelpDesk
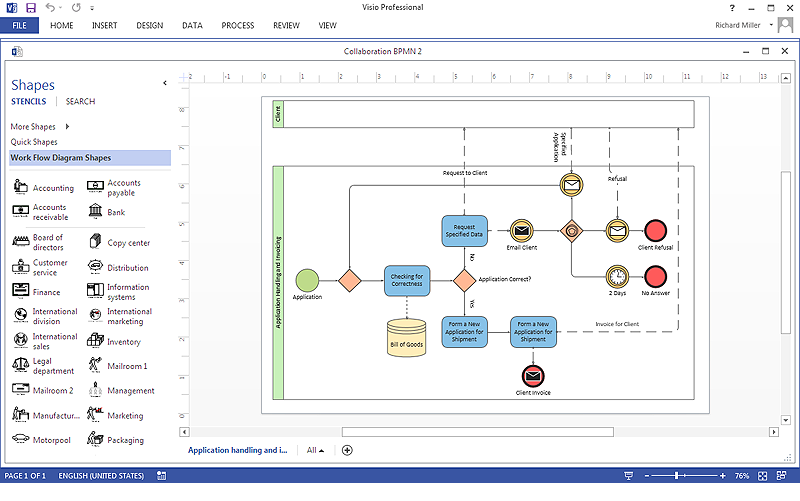
How To Create a MS Visio Business Process Diagram Using ConceptDraw PRO
Business process diagrams are specialized types of flowcharts based on the Business Process Model and Notation. The BPMN specification describes the symbols to display business processes in the form of business process diagrams. The main objective of BPMN is to create a standard set of symbols that are understandable to all business users, such as business analysts who create and improve processes, technical developers responsible for implementing processes and managers who take care processes and control them. Making a business process diagram involves many different elements that can be managed using ConceptDraw PRO. The ability to design Business process diagrams is delivered by the Business Process Diagrams solution. ConceptDraw PRO supports export of business process diagrams to MS Visio files. Thus, you can share your business documentation with MS Visio users.HelpDesk
Event-driven Process Chain (EPC) Diagram Software
An EPC diagram is a type of flowchart used in business process analysis. It shows different business processes through various work flows. The workflows are shown as processes and events that are related to different executes and tasks that allow business workflow to be completed. An EPC diagram shows different business processes through various workflows. The workflows are seen as functions and events that are connected by different teams or people, as well as tasks that allow business processes to be executed. The best thing about this type of enterprise modelling is that creating an EPC diagram is quick and simple as long as you have the proper tool. One of the main usages of the EPC diagrams is in the modelling, analyzing and re-engineering of business processes. With the use of the flowchart, businesses are able to see inefficiencies in the processes and modify to make them more productive. Event-driven process chain diagrams are also used to configure an enterprise resource plaHelpDesk
How to Create a Data Flow Diagram using ConceptDraw PRO
Data flow diagramming is a highly effective technique for showing the flow of information through a system. Data flow diagrams reveal relationships among and between the various components in a program or system. DFD is an important technique for modeling a system’s high-level detail by showing how input data is transformed to output results through a sequence of functional transformations. The set of standard symbols is used to depict how these components interact in a system. ConceptDraw PRO allows you to draw a simple and clear Data Flow Diagram using special libraries.HelpDesk
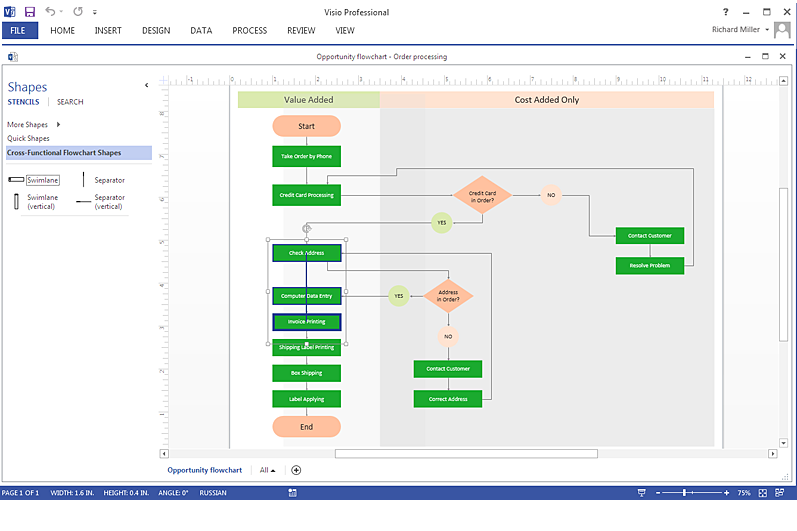
How To Create a MS Visio Cross-Functional Flowchart Using ConceptDraw PRO
Cross-functional is a process involving several functional layers. Such processes typically cause the most problems, and therefore, is the most potential for improvement. Cross-functional business processes are usually illustrate the processes of product development, commercial proposal development, the order execution process - everything, that involves several departments. The package of possible improvements - is the task of re-engineering. To illustrate the cross-functional processes often use cross-functional flowchart is often used to illustrate the cross-functional processes. ConceptDraw PRO allows you to easily create cross-functional flowchart. Then, you can export it to MS Visio VSDX or VDX format and successfully share it with your colleagues still using MS Visio.HelpDesk
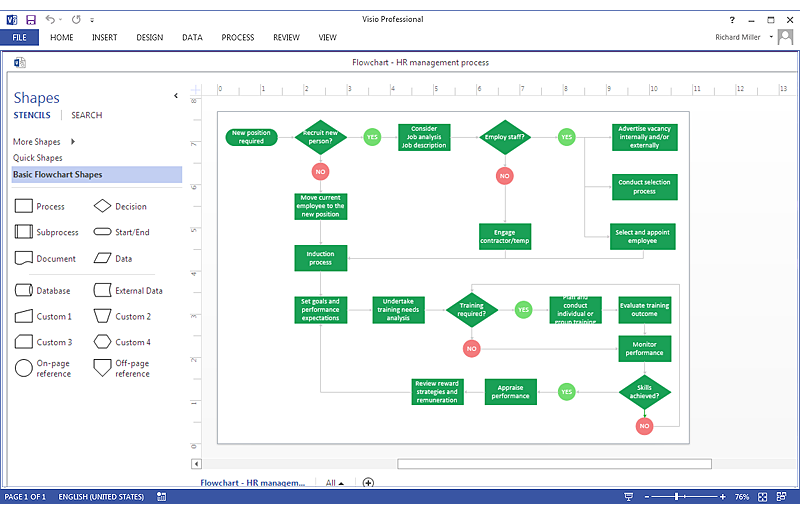
How To Create a MS Visio Flowchart Using ConceptDraw PRO
Making a process or work flow step-by-step visualization helps you to better understand it and effectively communicate with your audience. Flowcharting is the best way to do this. Flowchart is a diagram that successively depicts all process steps. Basic flowchart is the most easy and understandable type of a flowchart. Using ConceptDraw PRO you can design flowcharts of any complexity on Windows or OS X . Then you can export them to Visio format to share with the users of MS Visio. Moreover, using ConceptDraw PRO you can open and edit a flowchart made in Visio, regardless of whether you are using OS X or Windows.HelpDesk
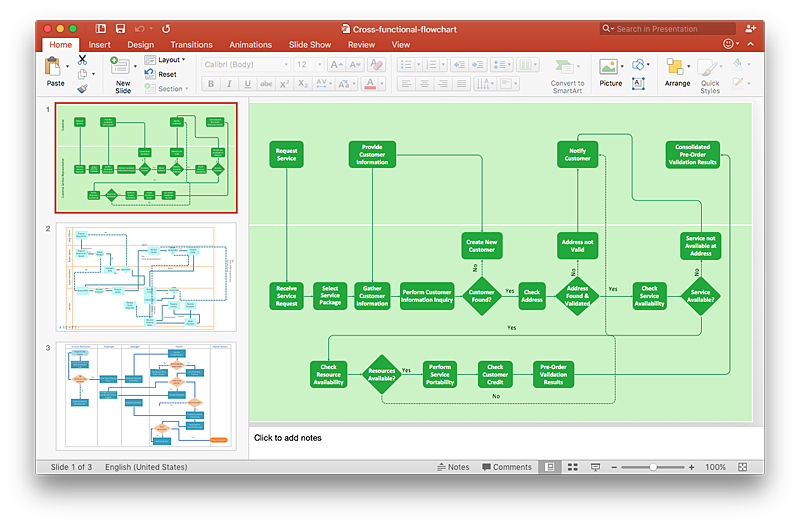
How to Add a Cross-Functional Flowchart to a PowerPoint Presentation Using ConceptDraw PRO
Using a Cross-Functional flowchart is a clear way of showing how business processes get shared or transferred between different teams and departments. ConceptDraw PRO allows you to make an MS PowerPoint Presentation from your flowcharts in a few simple steps.- Process Flowchart | Sales Process Flowchart . Flowchart Examples ...
- Basic Flowchart Symbols and Meaning | Sales Process Flowchart ...
- Basic Flowchart Symbols and Meaning | Flowchart design ...
- Sales Process Flowchart . Flowchart Examples | Sales Process Steps ...
- Process Flowchart | Sales Process Flowchart . Flowchart Examples ...
- Basic Flowchart Symbols and Meaning | Audit Flowchart Symbols ...
- Basic Flowchart Symbols and Meaning | How to Create Flowchart ...
- Basic Flowchart Symbols and Meaning | Flowchart design ...
- Sales Process Flowchart . Flowchart Examples | Sales Flowcharts ...
- Basic Flowchart Symbols and Meaning | Flow Chart Symbols ...
- Basic Flowchart Symbols and Meaning | How to Draw a Flowchart ...
- Basic Flowchart Symbols and Meaning | Account Flowchart ...
- Basic Flowchart Symbols and Meaning | Flowchart design ...
- Basic Flowchart Symbols and Meaning | How to Create a Data Flow ...
- Design elements - MOSFET | Design elements - Transistors | Sales ...
- How to Create Flowchart Using Standard Flowchart Symbols | Basic ...
- Process Flowchart | Basic Flowchart Symbols and Meaning ...
- Process Flowchart | Draw Flowcharts with ConceptDraw | Sales ...
- Process Flowchart | Basic Flowchart Symbols and Meaning ...
- Basic Flowchart Symbols and Meaning | How to Create Flowchart ...
