HelpDesk
How to Edit a Project Task List
A list of project tasks is core to any project plan. It is the basic part of a project schedule. The project task list should include all of the work associated with fulfilling the project on time. Having an entire and complete task list, the project manager will be able to estimate the costs and resources, necessary to implement the project. The project task list creation is a key piece of project management. The list of project tasks have include activities, should be performed, and the sequence in which tasks need to be completed.HelpDesk
How to Customize a Task‘s Duration
When you create an automatically scheduled task, ConceptDraw PROJECT assigns it duration of one day by default. You need modify that duration to reflect the real amount of time that the task requires.HelpDesk
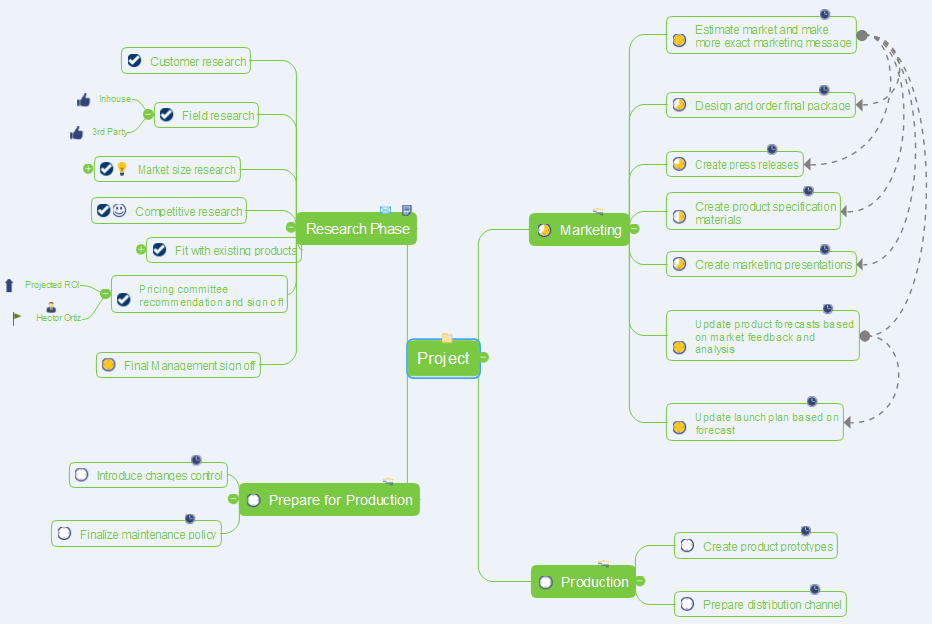
How to Make a Project Tasks Mind Map from Brainstorm
Start a project with creating a mind map, structuring ideas captured during a brainstorming session. The easiest way to start a new project is to conduct a brainstorming session that identifies the necessary tasks and then to develop it into a project schedule.HelpDesk
What Information to be Displayed in the ConceptDraw PROJECT Gantt Chart View
What information can contain the project task list? Gantt Chart view is a graphical representation of a project outline that allows one to allocate tasks. You can customize a project’s tasks list view to include the columns you need to meet your information requirements. The columns of the ConceptDraw PROJECT Gantt view contain the information you want to capture about each task in your project. The following article details what information can be contained in the columns of a project outline:<HelpDesk
How to Create a Mind Map from Selected Tasks in Project
You can see the project data in a mind map structure by create a mind map from the selected project tasks.HelpDesk
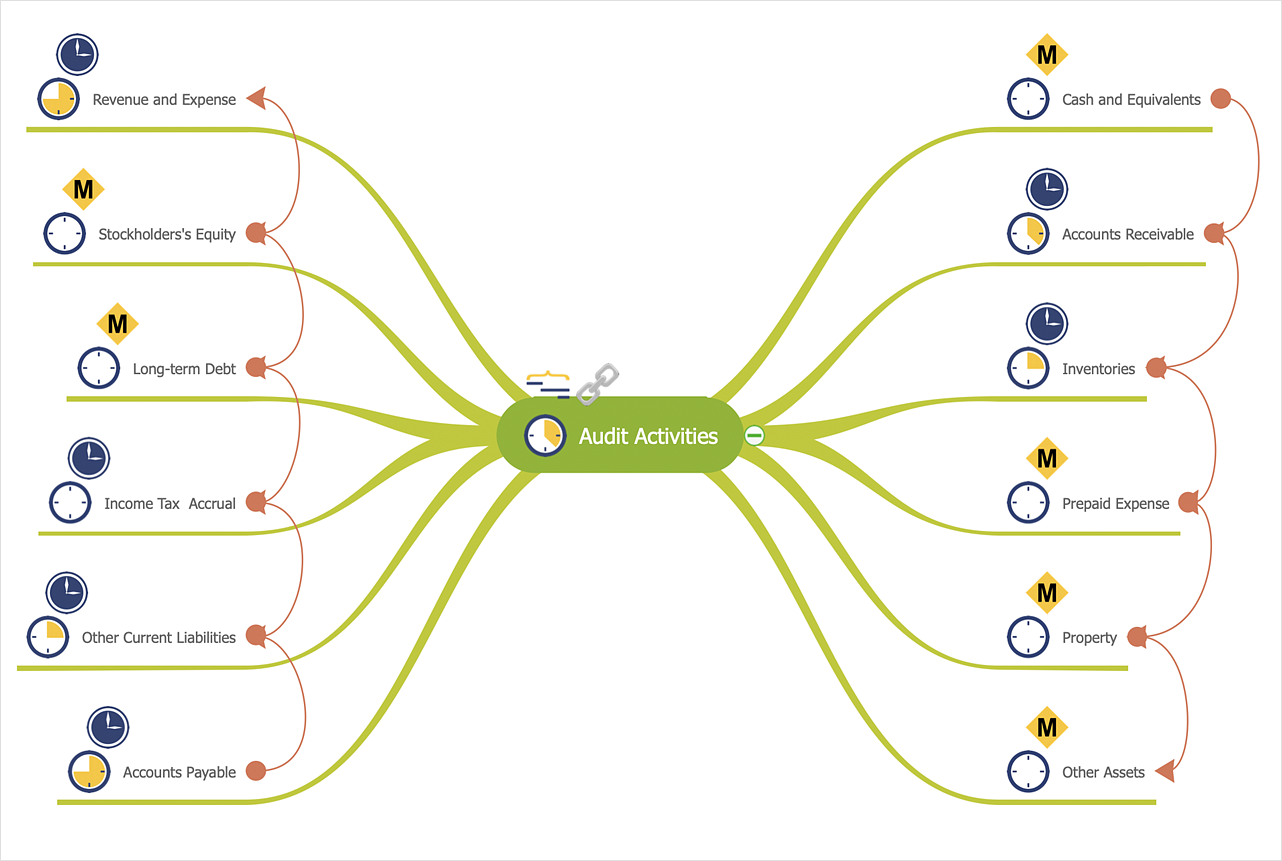
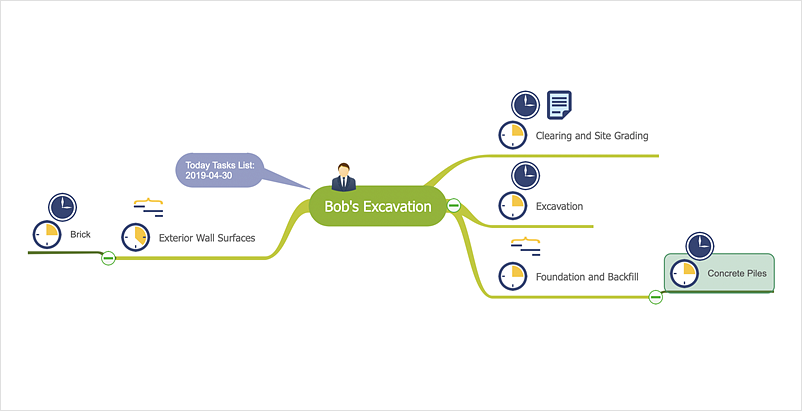
How to Manage a Multiple Project Participants Responsibilities With To-Do Mind Maps
All project participants are kept informed of their responsibilities in projects and can detail their tasks in a creative mind map format.HelpDesk
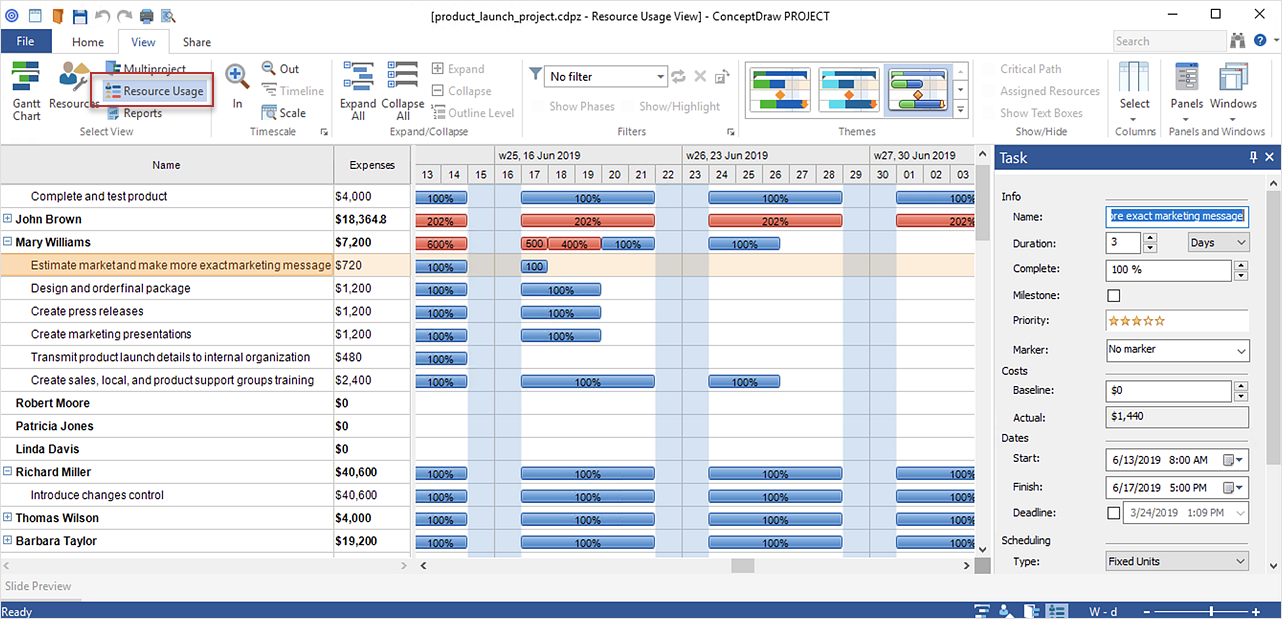
How to Plan and Allocate Resources with ConceptDraw PROJECT on PC
Effective resource management is a key factor in the successful project implementation. The common types of resources for which the project manager has an impact, include material resources (materials, energy), staff (work) and equipment. CoceptDraw PROJECT provides easy ways to project Resources Management: Create a list of project resources and assign the right human resource, as well as the necessary material, or equipment to be used.HelpDesk
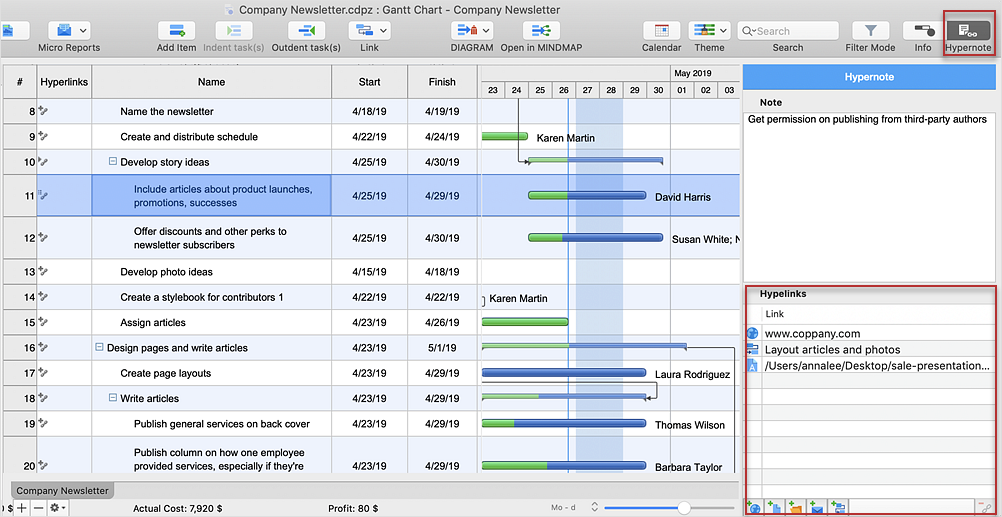
How to Add Several Hyperlinks to a Single Project Task
The number of hyperlinks, you can add to each project item in ConceptDraw PROJECT file is unlimited.Business diagrams & Org Charts with ConceptDraw DIAGRAM
The business diagrams are in great demand, they describe the business processes, business tasks and activities which are executed to achieve specific organizational and business goals, increase productivity, reduce costs and errors. They let research and better understand the business processes. ConceptDraw DIAGRAM is a powerful professional cross-platform business graphics and business flowcharting tool which contains hundreds of built-in collections of task-specific vector stencils and templates. They will help you to visualize and structure information, create various Business flowcharts, maps and diagrams with minimal efforts, and add them to your documents and presentations to make them successful. Among them are Data flow diagrams, Organization charts, Business process workflow diagrams, Audit flowcharts, Cause and Effect diagrams, IDEF business process diagrams, Cross-functional flowcharts, PERT charts, Timeline diagrams, Calendars, Marketing diagrams, Pyramids, Target diagrams, Venn diagrams, Comparison charts, Analysis charts, Dashboards, and many more. Being a cross-platform application, ConceptDraw DIAGRAM is very secure, handy, free of bloatware and one of the best alternatives to Visio for Mac users.
Activity Network (PERT) Chart
Activity Network and Project Evaluation and Review Technique, or PERT, charts are a way of documenting and analyzing the tasks in a project. This diagram is constructed as part of the process in creating a schedule of corrective actions. The Activity Network Chart (PERT) shows the logical connections and consequence of tasks to be performed. It displays the time period for problem solving and the implementation of all activities through the critical path.HelpDesk
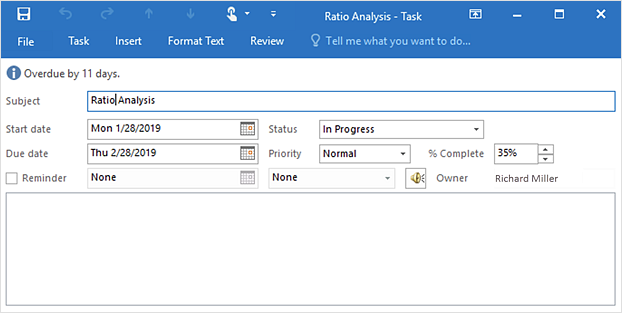
How to Send Task From a Mind Map to MS Outlook
ConceptDraw MINDMAP supports integration with MS Outlook. The mind map topic can be transformed into MS Outlook message.HelpDesk
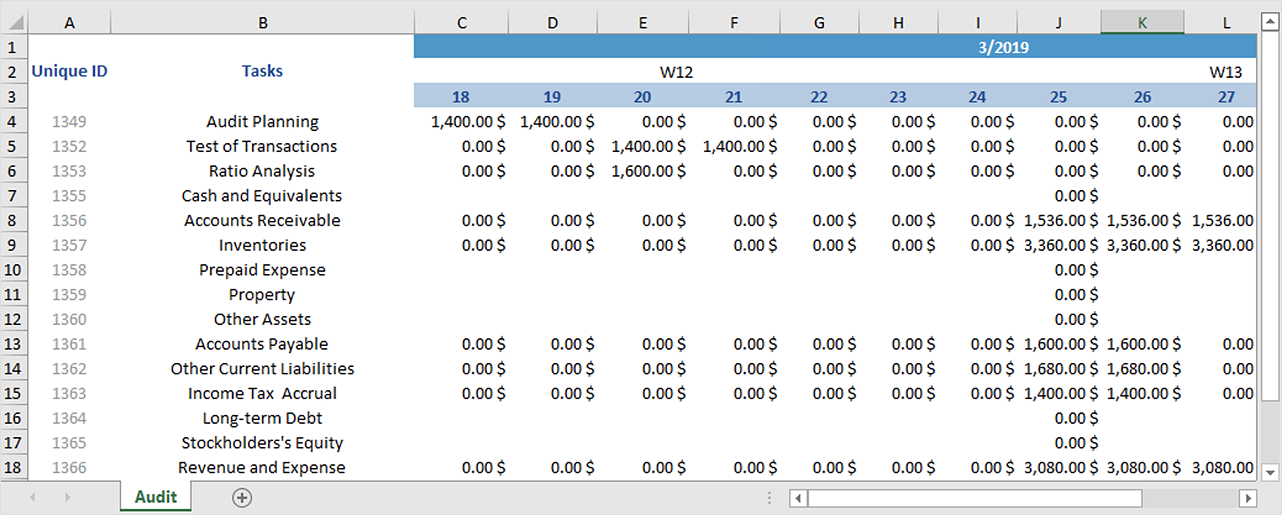
How to Generate Tabular Reports in ConceptDraw PROJECT for macOS
Project reporting is one of the key functions of effective project management. Using regular project reports, project manager can constantly track and analyze the project’s execution. This analytic process can help to ensure that the team reaches the best possible solutions. ConceptDraw PROJECT is a professional software tool for project management with the advanced mechanism of reporting. You can create the set of regular reports on project activities, task statuses, cash flow and assignments in MS Excel format. Mind map reports are also available.HelpDesk
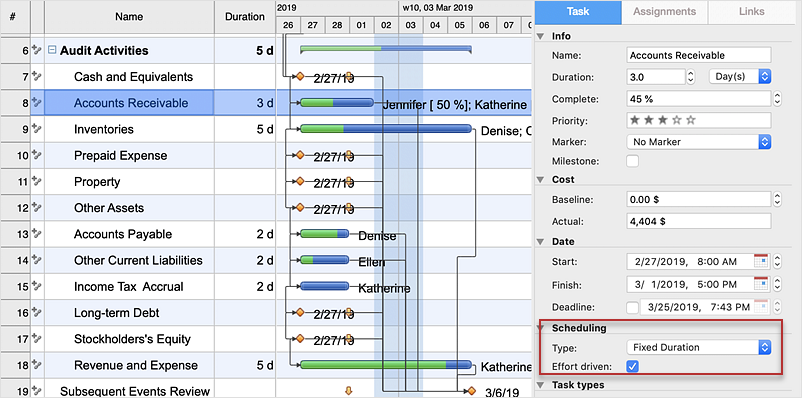
How to Use the Effort-Driven Scheduling Method
The idea of Effort-driven scheduling in project management is that each project task can be scheduled and assumed basing to the amount of the available work hours. Effort-driven scheduling is used as the default method of project scheduling in ConceptDraw PROJECT. This means that task duration, units, and work amount for individual assignment depend on the entire work, required for a given task. Whether you add or remove resources, the total work amount still the same, while the ConceptDraw PROJECT regulates the duration of task or units assigned for the given resources.HelpDesk
How to Draw a Gantt Chart
A Gantt chart is intended to provide a visualization of a project schedule. It is developed to help planning, coordinating, and tracking on project tasks implementation. One of the most critical resources for project implementation are time resources. Gantt chart - is one of the most convenient and popular ways of graphical representation of a project tasks progress in conjunction with the corresponding time consumption. Gantt chart's function is to show project tasks completed in progress and to make a project manager sure that project tasks were completed on time. ConceptDraw Office is a clear and easy-to-use tool for project management. It is a very handy visual tool that helps make a project processing clear.HelpDesk
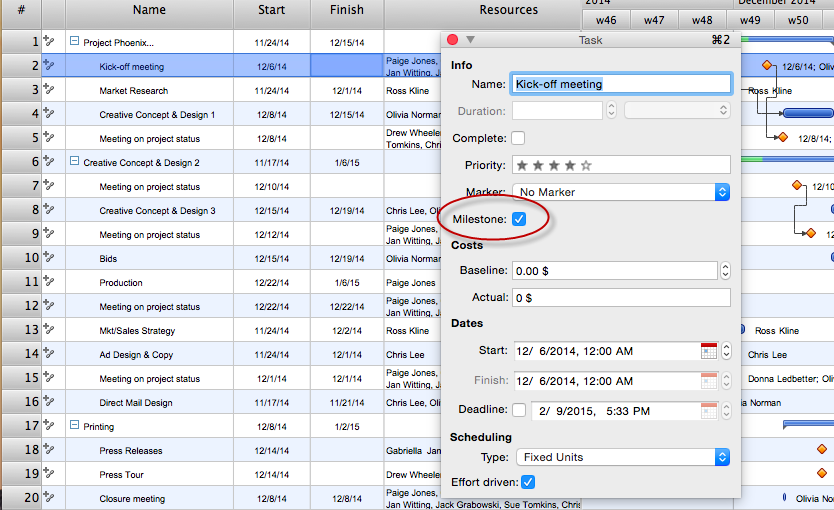
How to Identify Project Milestones
In ConceptDraw PROJECT you can easily turn any task from a project schedule into a milestone. Here are some tips on how to set milestones in a project file.- Sales Dashboard Template | Project task status dashboard ...
- Project tasks dashboard | How To Prioritize Customers Sales Call ...
- Status Dashboard | Dashboard | Project task status dashboard ...
- Sale dashboard | Sales dashboard - Vector stencils library | Project ...
- Status Dashboard | | How to Shift Dates in ConceptDraw PROJECT ...
- PM Dashboards | Status Dashboard | Project management task ...
- Status Dashboard | Project task status dashboard - Template | PM ...
- Status Dashboard | Projects HR dashboard | Project tasks ...
- PM Dashboards | Status Dashboard | Project management task ...
- Project Update Dashboard
- Land sales process flowchart | How to Customize a Task's Duration ...
- Prioritizing Tasks Chart
- How To Create Project Report | | Business Intelligence Dashboard ...
- Status Dashboard | PM Dashboards | How to Create Project ...
- How to Make a Project Tasks Mind Map from Brainstorm | How to ...
- Gantt Chart Software | PM Easy | Project tasks dashboard | On Time ...
- Status Dashboard | Project task status dashboard | Project ...
- PM Dashboards | Status Dashboard | How to Create Project ...
- How to Create a Sales Flowchart Using ConceptDraw PRO | How ...
- PROBLEM ANALYSIS. Prioritization Matrix | Pyramid Diagram ...


