Process Flowchart


"Workflow components.
A workflow can usually be described using formal or informal flow diagramming techniques, showing directed flows between processing steps. Single processing steps or components of a workflow can basically be defined by three parameters:
(1) input description: the information, material and energy required to complete the step,
(2) transformation rules, algorithms, which may be carried out by associated human roles or machines, or a combination,
(3) output description: the information, material and energy produced by the step and provided as input to downstream steps.
Components can only be plugged together if the output of one previous (set of) component(s) is equal to the mandatory input requirements of the following component. Thus, the essential description of a component actually comprises only in- and output that are described fully in terms of data types and their meaning (semantics). The algorithms' or rules' description need only be included when there are several alternative ways to transform one type of input into one type of output – possibly with different accuracy, speed, etc.
When the components are non-local services that are invoked remotely via a computer network, such as Web services, additional descriptors (such as QoS and availability) also must be considered." [Workflow. Wikipedia]
The workflow diagram template for the ConceptDraw PRO diagramming and vector drawing software is included in the Workflow Diagrams solution from the Business Processes area of ConceptDraw Solution Park.
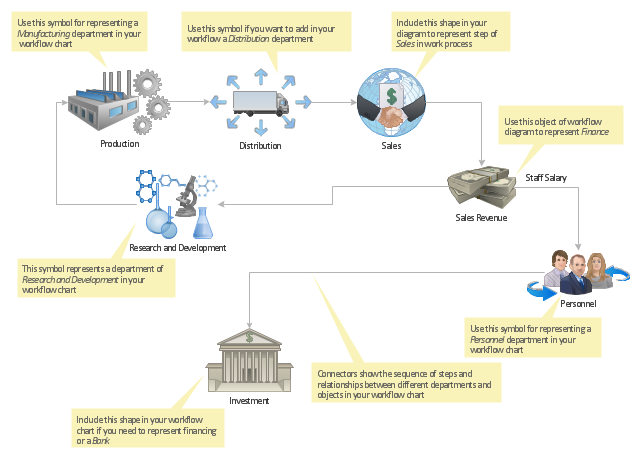
Workflow diagram template
 Target and Circular Diagrams
This solution extends ConceptDraw PRO software with samples, templates and library of design elements for drawing the Target and Circular Diagrams.
- Workflow diagram - Template | Workflow diagrams - Vector stencils ...
- Bank Workflow Template
- How to Create a Bank ATM Use Case Diagram Using ConceptDraw ...
- Process Flowchart | HR department - Vector stencils library | Sales ...
- IDEF0 Diagrams | Sales department - Vector stencils library ...
- Sales Growth. Bar Graphs Example | Sales KPIs and Metrics - Vector ...
- Organization Chart Templates | Marketing and Sales Organization ...
- Process Flowchart | Social Media Response | Sales department ...
- HR department - Vector stencils library | Sales department - Vector ...
- Sales Process Flowchart. Flowchart Examples | Sales department ...
- Process Flowchart | Bank social media response flowchart ...
- Cross-Functional Process Map Template | Workflow diagrams ...
- Auditing Of Banking Company By Diagram
- Bar Chart Examples | Sales Growth. Bar Graphs Example | Financial ...
- Flowchart on Bank . Flowchart Examples | Social Media Response ...
- Sales department - Vector stencils library | Design elements - Sales ...
- It Security Research
- Sales Process Management | Process Flowchart | Seven ...
- Sales Work Flow
- How to Draw an Organization Chart | Orgchart | Organizational Chart ...