HelpDesk
How to Use ConceptDraw Sales Dashboard Solution
The interactive visual dashboard is a valuable tool for any sales team. Sales dashboard allows you to view and monitor sales indicators that are important for manager and sales staff . It helps to use the timely and reliable information to improve the quality of sales performance and increase sales revenues. ConceptDraw Sales Dashboard solution is a tool for both: sales manager and sales team. It provides the visualization of key performance indicators that are critical to the entire sales organization. The custom sales dashboard displays the real-time information on sales performance KPIs with the help of intuitive and easy-to-understand diagrams and charts. Sales Dashboard helps the entire team see where they are, and what needs to be done. With ConceptDraw PRO you can easily create a visual Sales Dashboard using Live Objects Technology.
HelpDesk
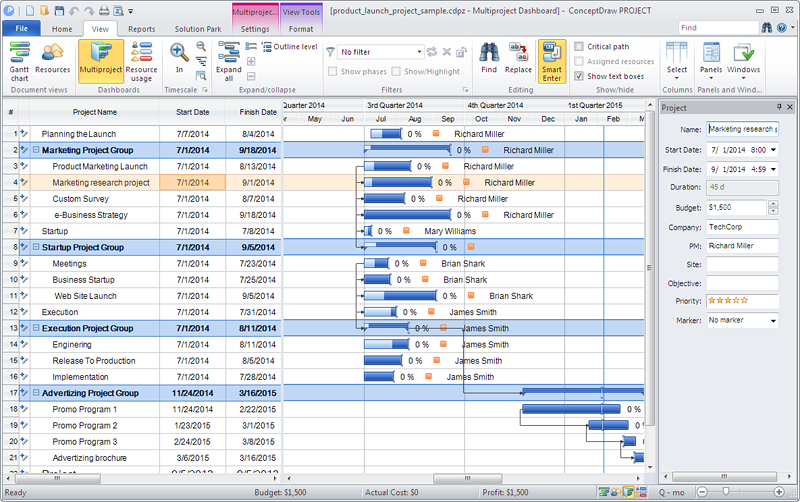
How to Manage Multiple Projects on Windows
ConceptDraw PROJECT lets you to track multiple projects at the same time.
 Audit Flowcharts
Audit flowcharts solution extends ConceptDraw PRO software with templates, samples and library of vector stencils for drawing the audit and fiscal flow charts.
Flow chart Example. Warehouse Flowchart
Warehouse Flowcharts are various diagrams that describe the warehousing and inventory management processes on the warehouses. Typical purposes of Warehouse Flowcharts are evaluating warehouse performance, measuring efficiency of customer service and organizational performance. This type of Workflow diagrams can be used for identifying any disconnection between business activities and business objectives. They are effectively used by warehouse-related people and organizations, manufacturers, wholesalers, exporters, importers, transporters, and others. Standard Warehousing process flow diagram and standard Workflow diagram are used for process identification for further evaluating effectiveness and profitability of overall business process. Use the ConceptDraw PRO vector graphic software extended with Flowcharts solution to design your own professional-looking Workflow diagrams and Flowcharts of any types, including the Warehouse flowchart, Process flow diagrams which depict in details all steps of Warehouse packages flow. Microsoft Visio, designed for Windows users, can’t be opened directly on Mac. But fortunately, there are several Visio alternatives for Mac which will help Mac users to work Visio files. With ConceptDraw PRO, you may open, edit and save files in Visio format.
HelpDesk
How to Track Your Project Plan vs. the Actual Project Condition
Conceptdraw PROJECT provides user with the possibility to track how the project is going. Project Manager can compare the actual data with the planned and assess possible measures to resolve issues. Conceptdraw PROJECT has several types of visual reports that can help to assess visually the difference between planned and actual project data.
 Sales Dashboard
Sales Dashboard solution extends ConceptDraw PRO software with templates, samples and library of vector stencils for drawing the visual dashboards of sale metrics and key performance indicators (KPI).
HelpDesk
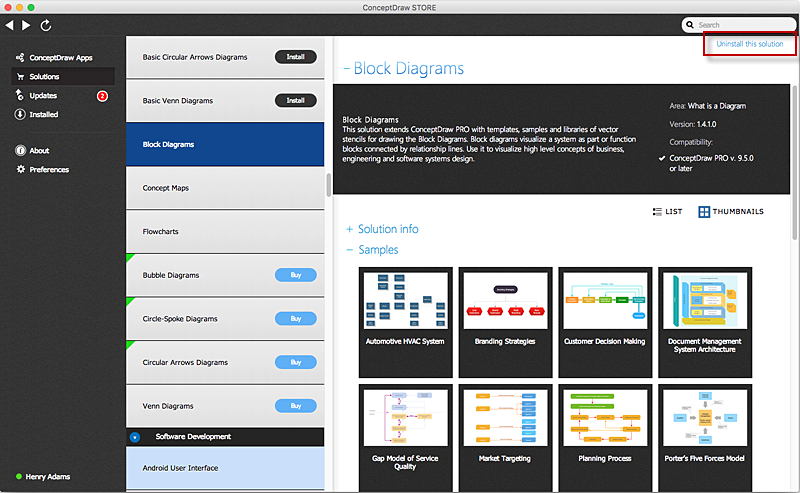
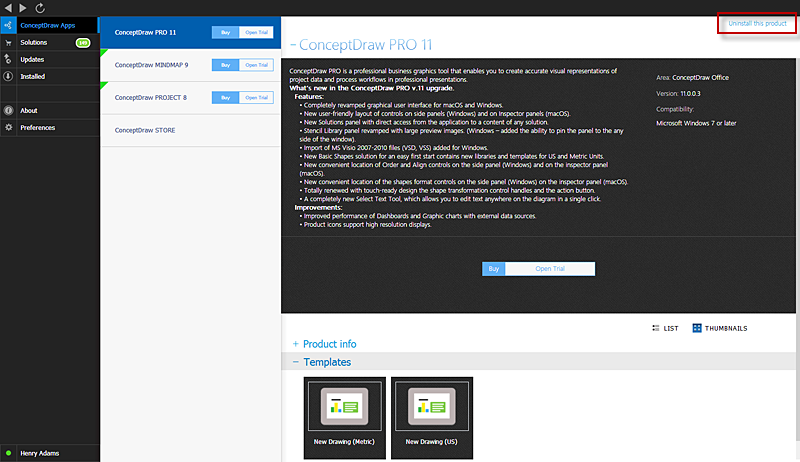
How to Uninstall ConceptDraw Solutions on Mac Using ConceptDraw STORE
Instruction for those trial users who want to remove ConceptDraw solutions after the trial period is over. You will find ideas and ways for the quickest and most effective way to uninstall ConceptDraw completely from any computer.HelpDesk
How to Remove ConceptDraw Products from Mac and PC
CS Odessa provides registered users a 21 day trial period at no charge. A Trial License can be used to run a fully functional version of ConceptDraw products for 21 days. Trial mode functions exactly as a fully licensed copy of the product does. After your trial has expired and you have not yet purchased a license, the product reverts to Demo mode. The following article contains the instruction for those trial users who want to remove ConceptDraw products after the trial period is over.HelpDesk
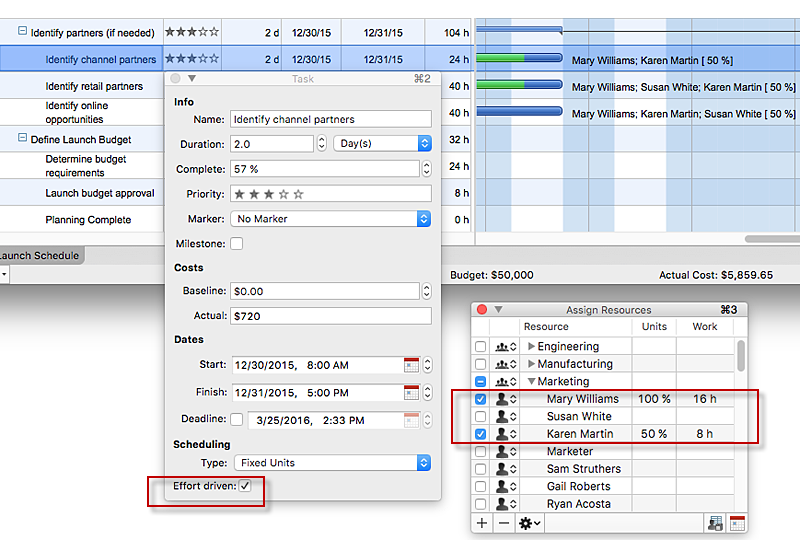
How to Use the Effort-Driven Scheduling Method
Effort-driven scheduling is the default method of project scheduling in ConceptDraw PROJECT.HelpDesk
How to Uninstall ConceptDraw Products on PC Using ConceptDraw STORE
Instruction for those trial users who want to remove ConceptDraw products after the trial period is over. You will find ideas and ways for the quickest and most effective way to uninstall ConceptDraw completely from any computer.HelpDesk
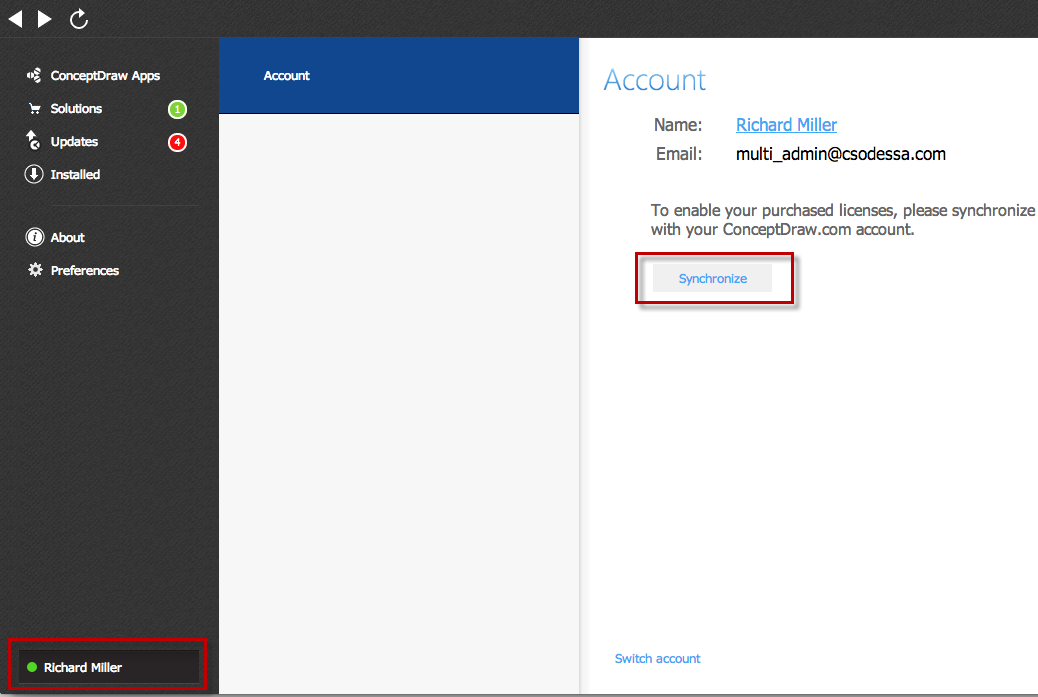
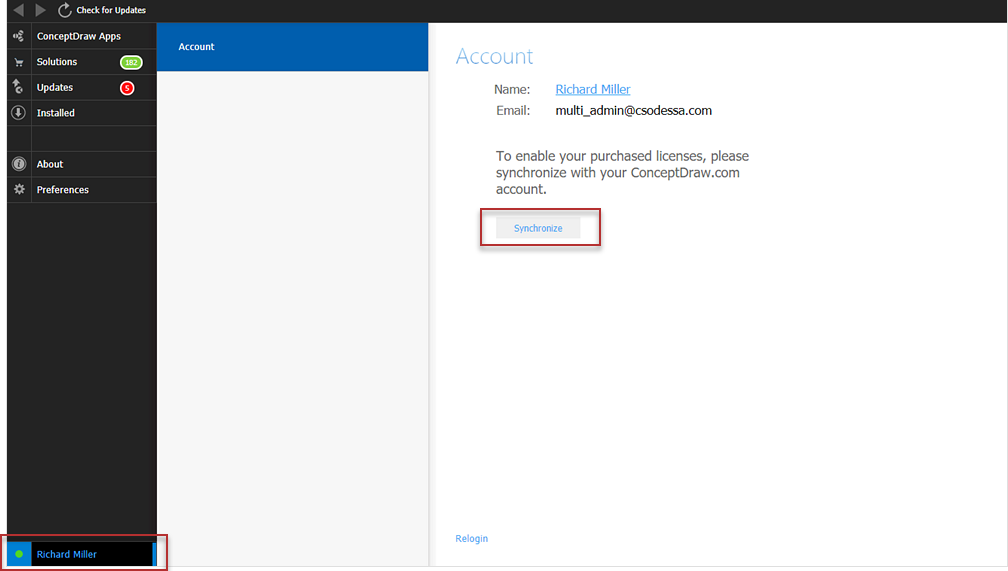
How to Activate ConceptDraw Purchased Through Reseller
Instructions on how to activate ConceptDraw products after purchase and installationHelpDesk
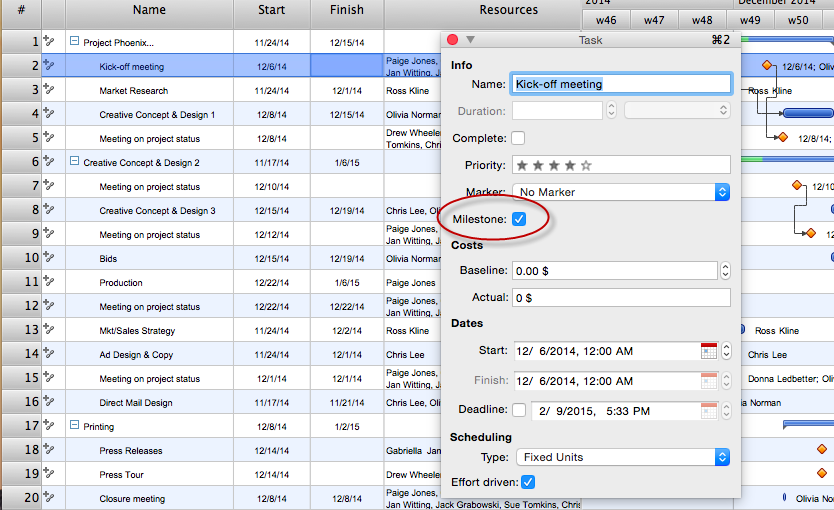
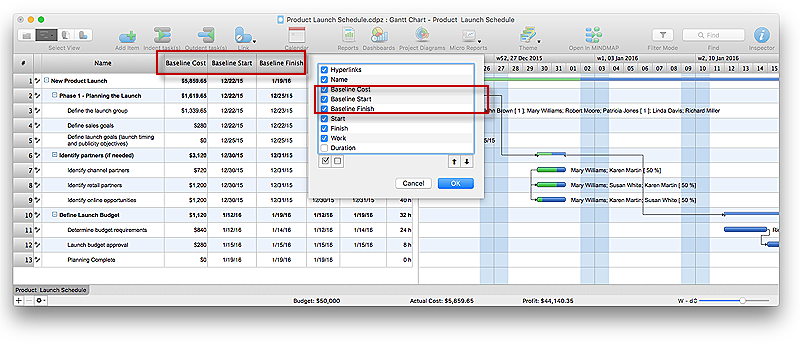
How to Set a Project Baseline Using ConceptDraw PROJECT
Project baseline in ConceptDraw PROJECT is excellent forguiding the execution of the current project and can be useful for further projects.Performance Indicators
ConceptDraw PRO diagramming and vector drawing software offers the useful tools of the Sales Dashboard solution from the Marketing area for easy creating professional looking live dashboards which allow to track the business sales activity and progress thanks to representing the Key Performance Indicators (KPIs) on them.HelpDesk
Downloading the Old Versions of ConceptDraw Products
These are the last updates that were released for the previous versions of ConceptDraw products.HelpDesk
ConceptDraw Software Full Versions Free Download
ConceptDraw software provides registered users a 21 day trial period at no charge. It functions exactly as a fully licensed copy of the product does. Once you have activated your account you are then able to download and install ConceptDraw software as well, as solutions from Solution Park. Here is an instructions on how to download and try ConceptDraw products for free. For 21 days the trial functions exactly like the purchased product. There are no limitations to file size, how many times you can print, or any of the products functionality. After the trial period expires, you will be able to open ConceptDraw documents to view.- Sales Dashboard | Sales Process Flowchart . Flowchart Examples ...
- Sales Process Flowchart . Flowchart Examples | Sales Process Steps ...
- Flowchart Marketing Process . Flowchart Examples | Sales Process ...
- Basic Flowchart Symbols and Meaning | Flowchart design ...
- Sales Process Flowchart . Flowchart Examples | Block diagram ...
- How to Use ConceptDraw Sales Dashboard Solution | Banquet hall ...
- Process Flowchart | Sales Process Flowchart . Flowchart Examples ...
- Sales Process Flowchart . Flowchart Examples | How to Create a ...
- Sales Process Flowchart . Flowchart Examples | Marketing and Sales ...
- Marketing and Sales Organization chart. Organization chart ...
- Flowchart design. Flowchart symbols, shapes, stencils and icons ...
- Work Order Process Flowchart . Business Process Mapping ...
- Sales Process Flowchart . Flowchart Examples | Basic Flowchart ...
- Sales Process Flowchart . Flowchart Examples | UML composite ...
- Copying Service Process Flowchart . Flowchart Examples | Flow ...
- Marketing and Sales Organization chart. Organization chart ...
- Copying Service Process Flowchart . Flowchart Examples | Sales ...
- Types of Flowchart - Overview | Process Flowchart | HR Flowcharts ...
- Finance Department Process Flow Chart

