HelpDesk
How to Create a BPMN Diagram Using ConceptDraw PRO
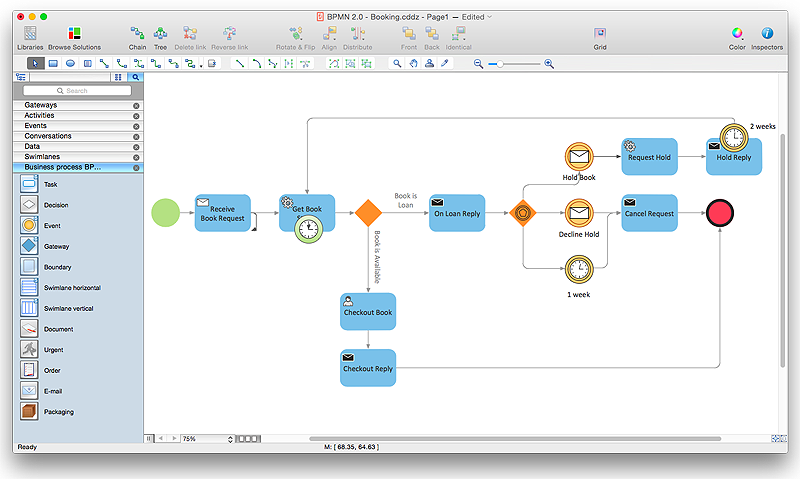
Business Process Modeling Notation (BPMN) is a method of illustrating business processes in the form of a diagram. The most effective method of creating or analyzing a business process is to visually interpret the steps using a business process diagram, flowchart or workflow. This is known as business process modeling, and will be performed within a company by a team who have detailed knowledge of company process, and analysts with expertise in the modeling discipline. The objective is often to increase production or lower costs — by modeling the process initially using a flowchart, inefficiencies and problems can be spotted before committing to a decision or strategy. You can create BPMN diagrams using the ConceptDraw PRO diagramming tools. ConceptDraw have designed a solution that combines BPMN v2.0 methodology and graphical notification into one powerful package. The Business Process Diagrams solution from ConceptDraw Solution Park provides a comprehensive collection of vectorHelpDesk
How to Create a Business Process Diagram
Making a Business Process diagram involves many different elements that can be managed using ConceptDraw PRO. The ability to design Business Process diagrams is delivered by the Business Process Diagrams solution.HelpDesk
How to Make a Workflow Diagram Using ConceptDraw PRO
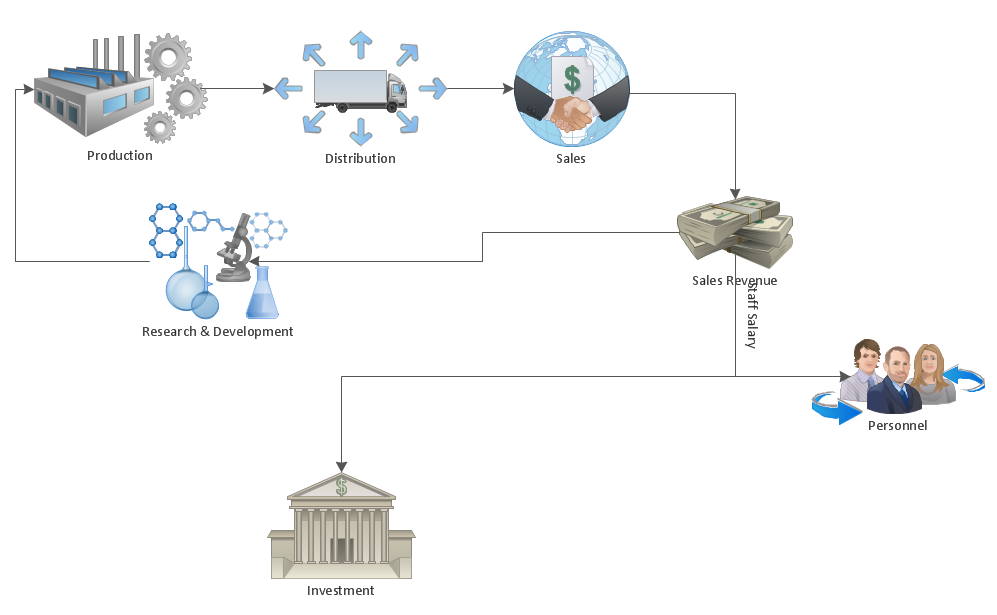
With the help of a workflow diagram you can visually describe the tasks, documents, people responsible for execution at each stage of workflow. Modern workflow diagrams have a specific focus on quality control. This can apply to the quality of inputs and outputs related to a process, or to the actual efficiency of the workflow itself. Different sectors of business use different diagramming techniques, and this has given rise to a number of methods that have become recognized in their own right as industry standards. ConceptDraw PRO, with the Workflow Diagrams solution, is ideal for creating diagrams of this type. Its RapidDraw technology takes the strain from diagram arrangement, allowing users to create their process steps with a single click, ideal for generating the many repeatable tasks that can make up a workflow. The Workflow Diagrams solution complements this feature with a library of selected icons to represent various steps.HelpDesk
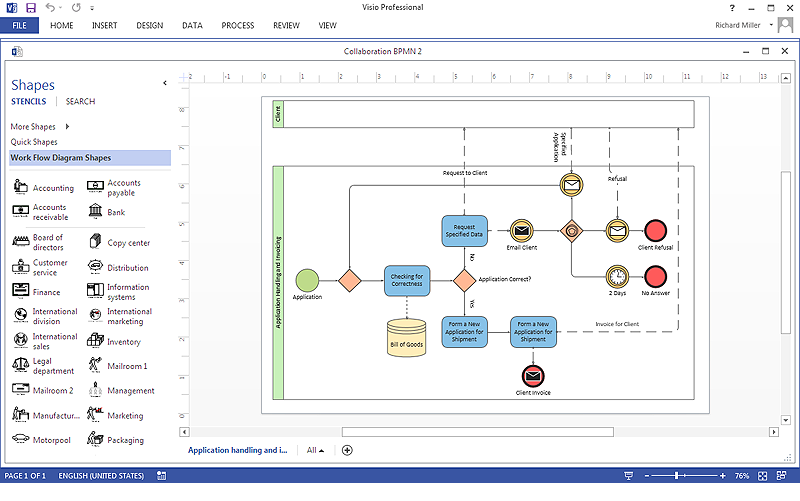
How To Create a MS Visio Workflow Diagram Using ConceptDraw PRO
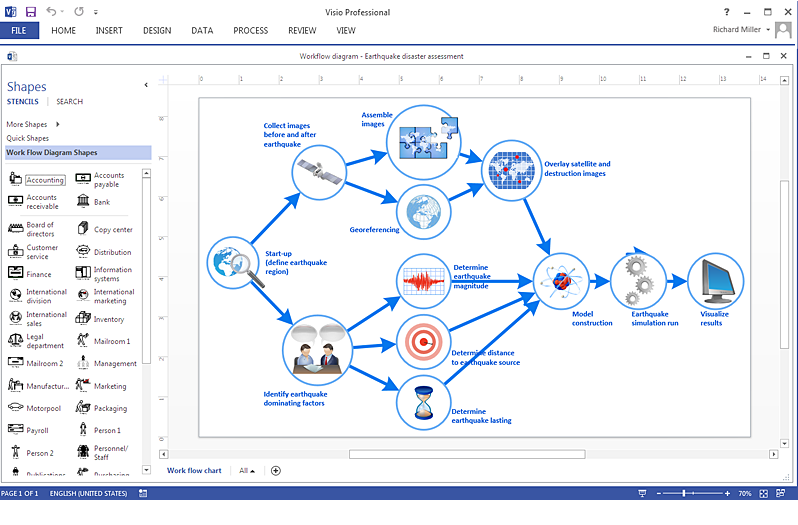
A workflow diagram shows a working process as a set of related events that follow each other in a particular order.They are usually created as flowcharts, with shapes that represent steps in the process connected by arrows that indicate the next step. Making a business process diagram involves many elements that can be managed using ConceptDraw PRO. The ability to design workflow diagrams is delivered by the Workflow Diagrams solution. ConceptDraw PRO allows you to easily create workflow diagrams and then make a MS Visio file from your diagrams. Using ConceptDraw PRO, you can export your workflow diagrams to MS Visio VSDX and VDX files.HelpDesk
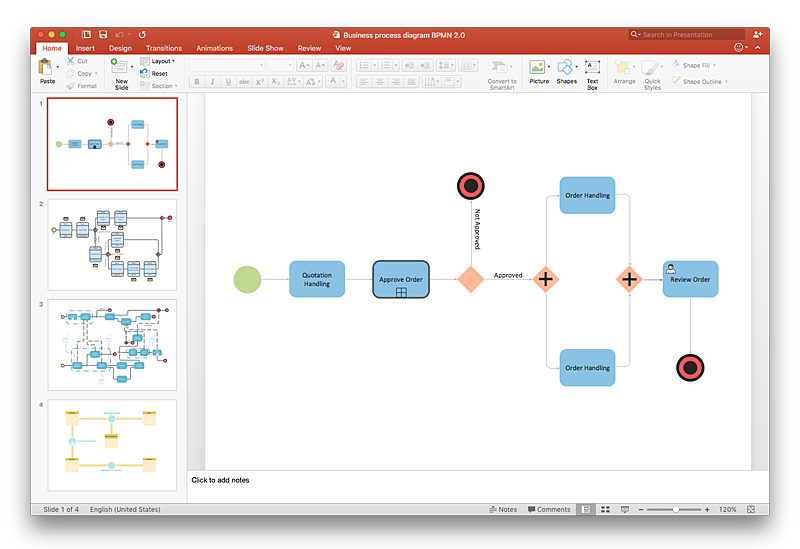
How To Make a PowerPoint Presentation of a Business Process Model Using ConceptDraw PRO
The most effective way of organizing and modeling a business process is to use a visual format. The visual approach to a business process modeling or analizing enables each point to be displayed clearly and compendiously. To reach the professional norms necessary for business process diagrams, it's better to use ConceptDraw Business Process Mapping solution. It delivers an extensive choice of process mapping tools to help quality management and help improve business workflows. The export facilities of ConceptDraw PRO help make short work of presenting the business process model by export business process diagrams to MS PowerPoint.HelpDesk
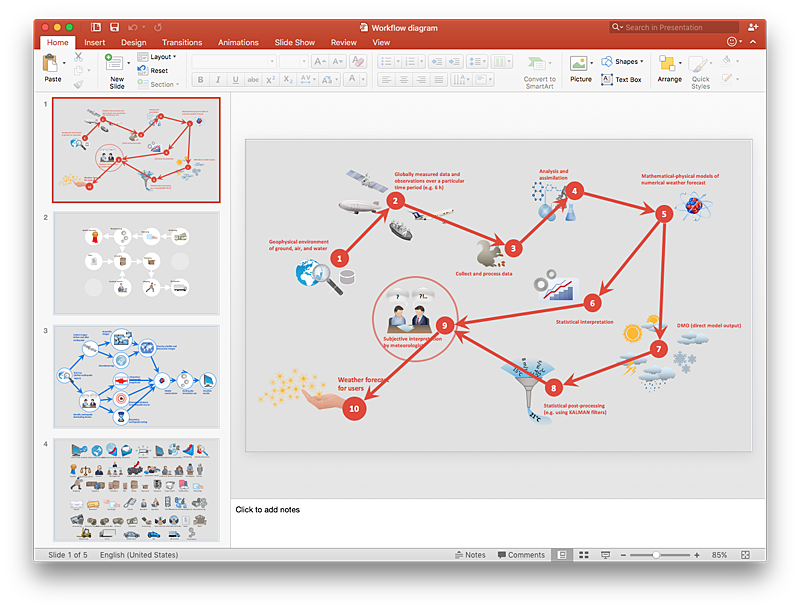
How to Add a Workflow Diagram to a PowerPoint Presentation Using ConceptDraw PRO
Making workflow diagrams in PowerPoint can help to describe the process within your organization as well as making comprehensive analysis presentations for sales or management and also can be used in other presentations and business documentation.HelpDesk
How to Create an IDEF0 Diagram for an Application Development
IDEF0 methods are intended to model the functions of a process, creating a graphical model that displays: what controls the function, who makes it, what resources are used and how they are connected with other functions. The IDEF0 tool is used to model the decisions, actions, and activities of a software system during the development process . IDEF0 diagram graphically depicts a model of a desired version of the application. ConceptDraw PRO allows you to create and communicate the IDEF0 diagrams of any complexity.HelpDesk
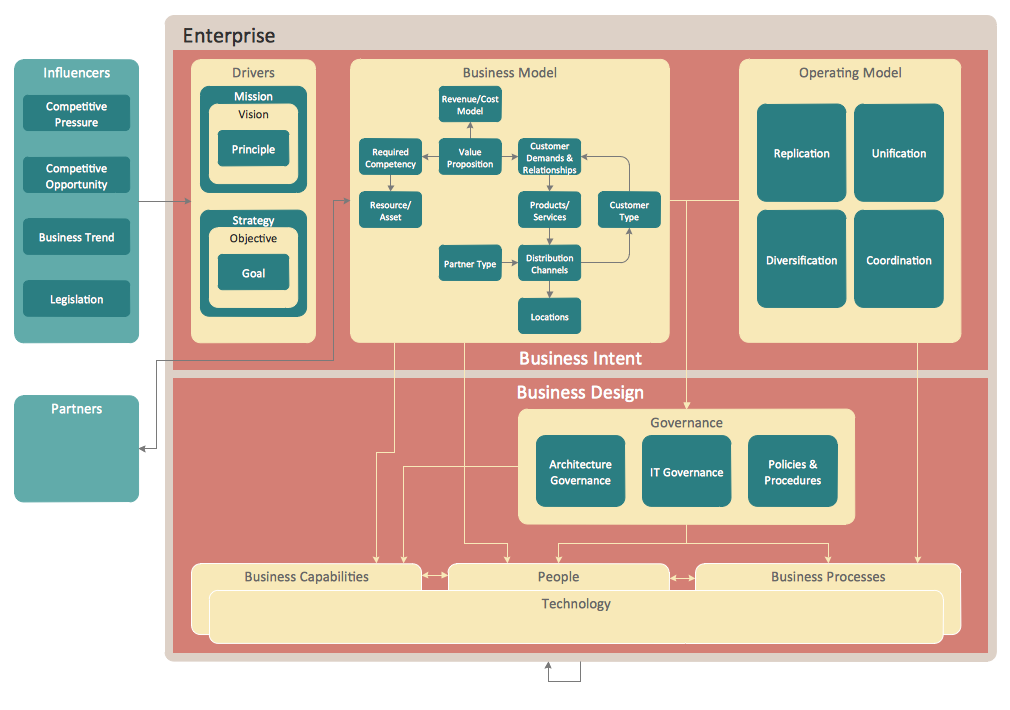
How to Create an Enterprise Architecture Diagram in ConceptDraw PRO
An Enterprise Architecture (EA) diagram is used to display the structure and operations of an organization.It is used to analyze and document an organization and its business functions, along with the applications and systems on which they are implemented. The aim of an enterprise architecture diagram is to determine how an organization can effectively achieve its current and future objectives. The Enterprise Architecture often uses diagrams to support the decision-making process. ConceptDraw PRO allows you to design Enterprise Architecture diagrams of any complexity.HelpDesk
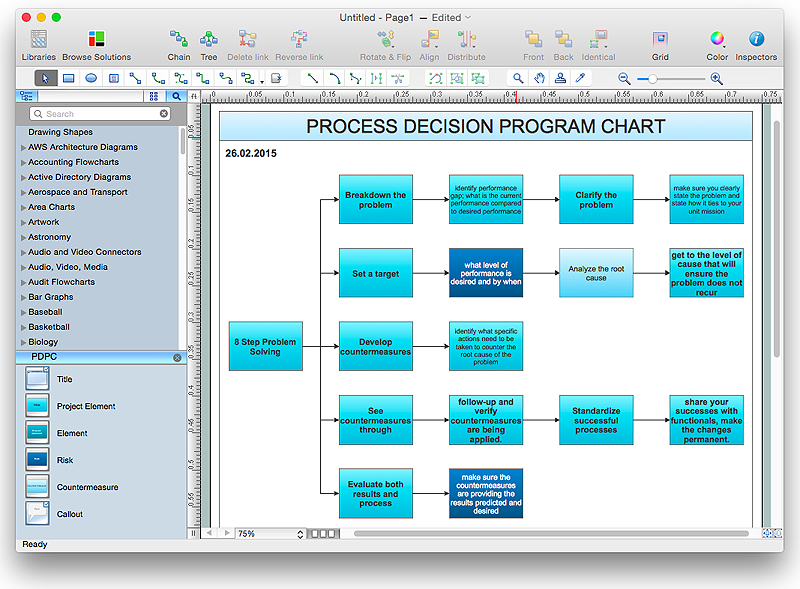
How To Create Risk Diagram (PDPC)
Article on how to identify possible risks when carrying out corrective actions, and define preventive actions
HelpDesk
How to Create Flowchart Using Standard Flowchart Symbols
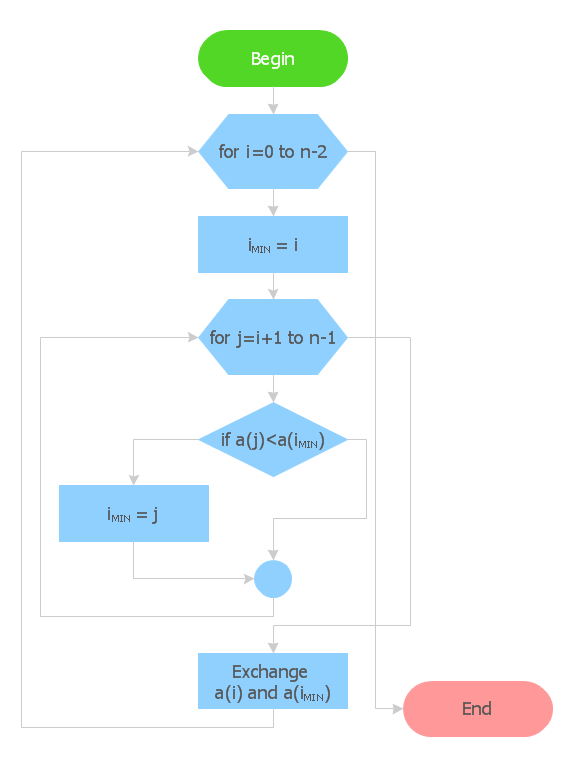
Flowcharts are used to display an algorithm for consistent execution of certain steps. Flowchart is probably the easiest way to make a graphical representation of any process. Flowcharts use the set of standard geometric symbols and arrows to define relationships. ConceptDraw PRO allows you to create professional flowchart quickly and easily. The ability to create flowcharts is contained in the Flowcharts solution. The solution provides a set of special tools for creating flowcharts.
 Business Process Diagrams
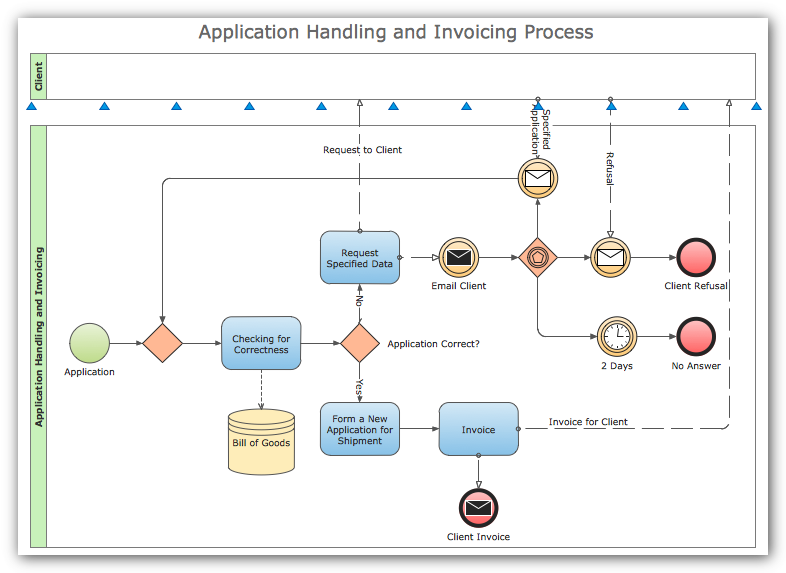
The Business Process Diagram Solution extends ConceptDraw PRO v10 BPMN software with its RapidDraw interface, templates, samples, and libraries based on the BPMN 1.2 and BPMN 2.0 standards. This powerful solution permits you to visualize easily both simple and complex processes, as well as design business models. The Business Process Diagram solution allows one to quickly develop and document in detail any business processes at any stage of a project’s planning and implementation.
HelpDesk
How To Convert a Business Process Diagram to Adobe PDF Using ConceptDraw PRO
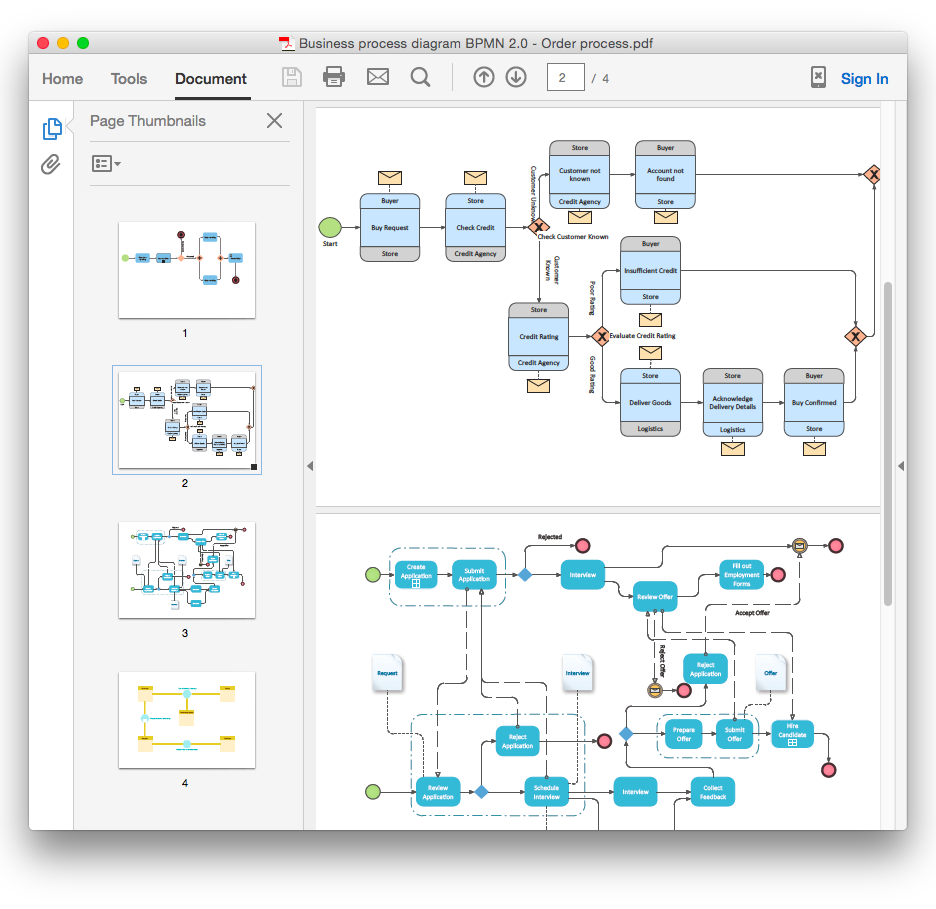
ConceptDraw PRO allows you to easy exchange your business process diagrams between different computers with different operating systems and applications using it's export capabilities. You can get clear business process documentation in pdf format and avoid any problems while communicating it with stakeholders.HelpDesk
How To Create the Interaction (Relation) Diagram
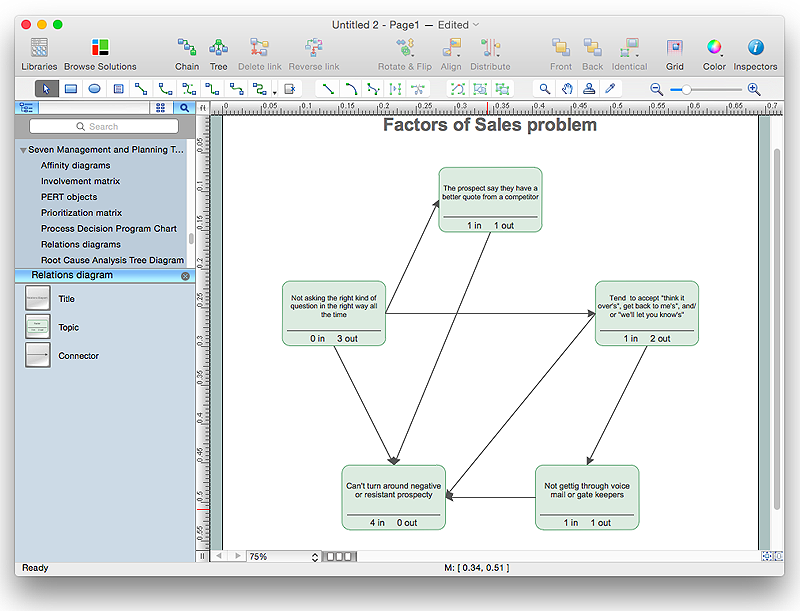
Identify relationships between factors affecting a problem using interaction (relation) diagram. The ability to create a Relation diagram from a mind map is supported by the ConceptDraw Seven Management and Planning Tools solution.HelpDesk
How to Draw a Scatter Diagram Using ConceptDraw PRO
Scatter Diagrams are used to visualize how a change in one variable affects another. A Scatter Diagram displays the data as a set of points in a coordinate system. It combines these values into single data points and displays them in uneven intervals. A Scatter Diagram can be very useful to for identifying relationships between variables, for example the relationship of price and quality rating. Making a Scatter Diagram involves many different elements that can be managed using ConceptDraw Scatter Diagram solution.HelpDesk
How to Create a UML Diagram Using ConceptDraw PRO
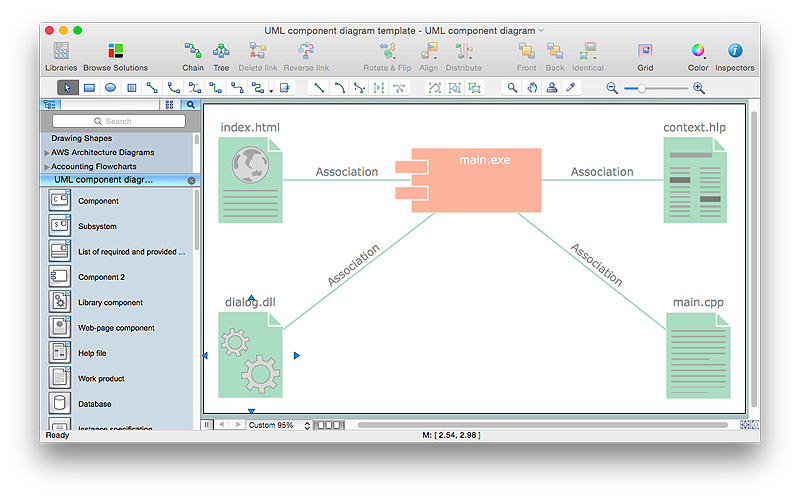
ConceptDraw PRO is a perfect tool to draw UML Diagrams.
HelpDesk
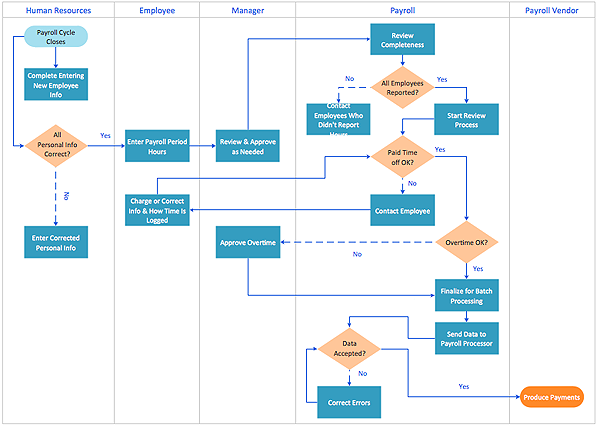
How to Use a Cross - Functional Flowcharts Solution
Cross-functional process is a process that involves multiple divisions, each of which makes its part of the entire company workflow. For example: product development, lead management , client orders processing – and other critical processes. Using a Cross-Functional flowchart is a clear way of showing each team member’s responsibilities and how processes get shared or transferred between different teams and departments.The Cross-Functional flowchart is a clear way to visualize the document flow in your organization. The ability to create Cross-functional diagrams is provided by the Cross-Functional Flowcharts solution.
HelpDesk
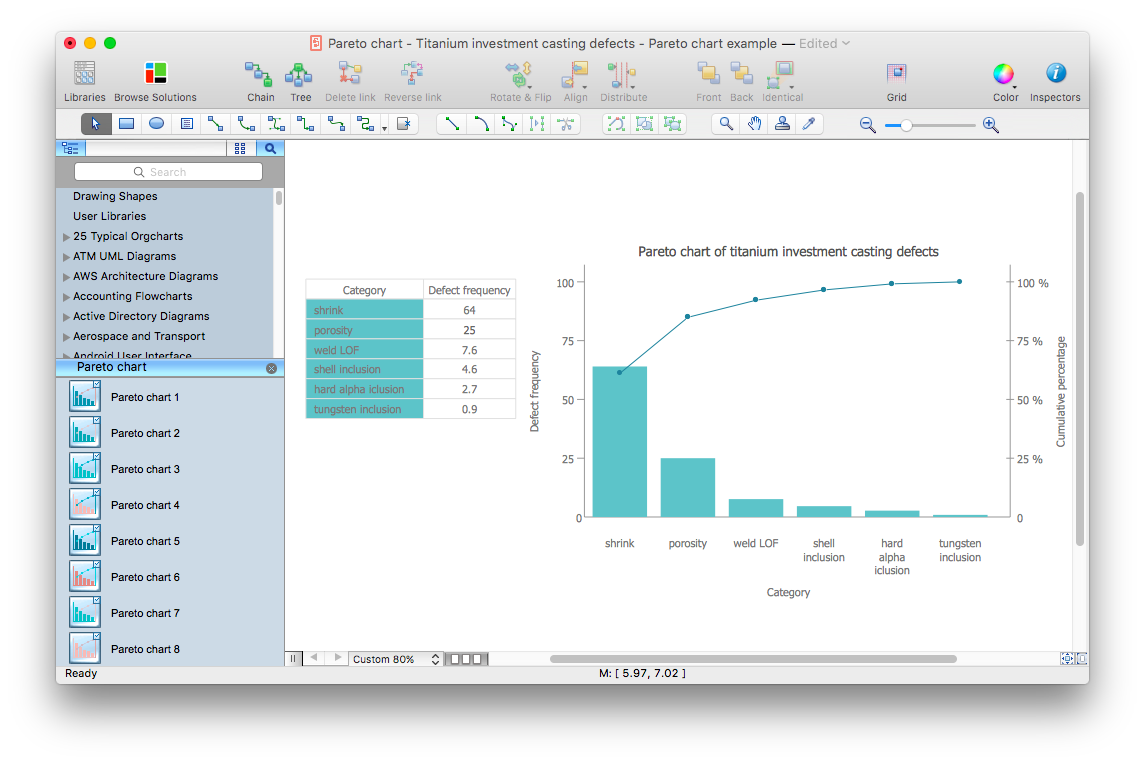
How to Draw a Pareto Chart Using ConceptDraw PRO
The Seven Basic Tools of Quality were picked as effective visual tool-set for identifying the root cause of quality-related problems within the workplace. Seven Basic Tools of Quality comprise of seven diagram that are diverse enough to be used to any business troubleshooting scenario, but simple enough that employees of all types can understand and apply them. One of these tools is a Pareto chart. It combines both a line graph and a bar chart, where the bar chart displays data values, and a line represents a total value. Pareto chart is used for quality control to identify the source of the quality problem.ConceptDraw Seven Basic Tools of Quality solution delivers a big set of vector stencil libraries and samples for each quality control diagram, including a Pareto chart.
HelpDesk
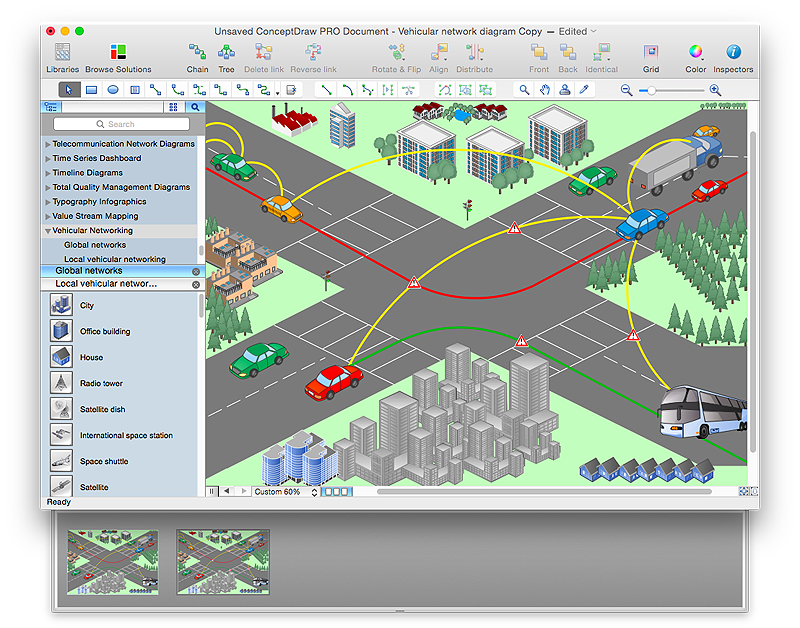
How to Create a Vehicular Network Diagram
ConceptDraw Vehicular Networking solution can help network engineers, network architects to design, analyze and present vehicular network diagrams quickly and efficiently. Solution provides a possibility to swiftly develop conceptual diagrams for vehicular networking. A set of templates and objects delivered with this solution allows making conceptual diagrams of global and local vehicular networks. Using the Vehicular Networking solution makes much easier the work on documenting the Vehicular Networks.
HelpDesk
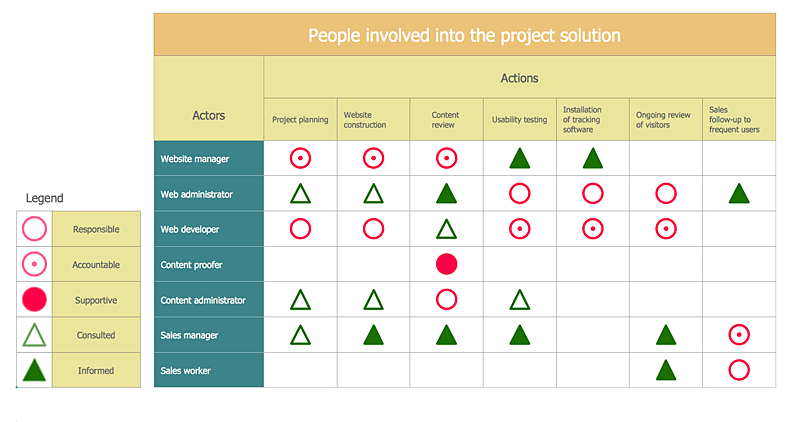
How To Create an Involvement Matrix
The Involvement Matrix can identify the distribution of responsibilities and identify roles in a group or team. This matrix can be used company wide. The Involvement Matrix identifies participants who are involved in corrective actions. The Involvement Matrix is constructed for all highly prioritized corrective actions. It uses symbols to assign who participates, performs, consults, should be informed, checks the work, and accepts the results. Using visual diagrams keeps ideas clear and is very effective when discussing the problem and a description of the solution. They are great at helping to quickly see what stage of the problem-solving effort is currently underway.It defines the participants and their roles. The matrix displays all of the parties involved, defines their level of involvement, and the nature of their participation. The ability to create an Involvement Matrix is supported by the ConceptDraw Seven Management and Planning Tools solution.HelpDesk
How To Create a MS Visio Business Process Diagram Using ConceptDraw PRO
Business process diagrams are specialized types of flowcharts based on the Business Process Model and Notation. The BPMN specification describes the symbols to display business processes in the form of business process diagrams. The main objective of BPMN is to create a standard set of symbols that are understandable to all business users, such as business analysts who create and improve processes, technical developers responsible for implementing processes and managers who take care processes and control them. Making a business process diagram involves many different elements that can be managed using ConceptDraw PRO. The ability to design Business process diagrams is delivered by the Business Process Diagrams solution. ConceptDraw PRO supports export of business process diagrams to MS Visio files. Thus, you can share your business documentation with MS Visio users.- Business Process Reengineering Examples | Business Process ...
- Process Flowchart | Flow chart Example . Warehouse Flowchart ...
- Trouble ticket system - BPMN 2.0 diagram
- Swim Lane Diagrams | Cross-Functional Flowchart (Swim Lanes ...
- Bpmn It Help Desk
- UML sequence diagram - Help desk | Rapid UML | Business ...
- Business Process Diagram | Process Flowchart | Service Desk Free ...
- Collaboration BPMN 2.0 diagram
- Process Flowchart | Workflow Process Example | BPMN 1.2 diagram ...
- Simple Business Process Diagrams
- UML sequence diagram - Help desk | Diagramming Software for ...
- Business Process Diagram | Business Process Modeling with ...
- Choreography BPMN 2.0 diagram - Logistics | Conversation BPMN ...
- UML sequence diagram - Help desk
- Business process diagram BPMN 1.2 - Hiring process | How to ...
- Business process diagram BPMN 1.2 - Hiring process | Business ...
- Application handling and invoicing - Collaboration BPMN 2.0 ...
- Business Process Model Example Pdf
- Design elements - Swimlanes BPMN 2.0 | Business Process ...
- Cab booking public process - Collaboration BPMN 2.0 diagram ...
