Sales Growth. Bar Graphs Example
This sample was created in ConceptDraw PRO diagramming and vector drawing software using the Bar Graphs Solution from Graphs and Charts area of ConceptDraw Solution Park. It is Bar Graphs example, Sales Growth example, Column Chart Example - Sales Report.Column Chart Template
Column chart templates from ConceptDraw collection can help you find the best visual depiction for you data. You can easily modify column chart templates according to data you want to visualize.How To Create Restaurant Floor Plan in Minutes
Developing Floor Plans, Design Drawings, Plans of Furniture Placement for restaurants and cafes is one of the most responsible and important steps at their construction and designing. Selection of favorable design, the right style of furniture and decors largely determine the success and atmosphere of the institution. The restaurant floor planner ConceptDraw PRO is a perfect choice for architects and designers. Enhanced with Cafe and Restaurant Floor Plans solution it offers a lot of extensive vector symbol libraries and building plan elements for drawing Restaurant floor plans, Restaurant layouts, Restaurant furniture layouts, Cafe floor plans, Bar area floor plan, Fast food restaurant plan, etc. With ConceptDraw PRO you don't need to be an artist to create great-looking restaurant floor plan drawings in minutes, all needed drawing tools are delivered by Building Plans area solutions. Construct your own general plan of restaurant's premises, choose the furniture for your taste from the Cafe and Restaurant Floor Plans solution libraries and arrange it on the plan as you desire fast and easy. ConceptDraw PRO has many of the features found in Visio for Mac such as Drawing, Connection, Shape and Editing Tools.
Column Chart Software
ConceptDraw Column Chart software allows drawing column charts using predesigned objects or drawing tools. In ConceptDraw Column Chart software you can find a complete set of column chart tools and objects.HelpDesk
How to Determine what Information to be Displayed in the Project Resource List
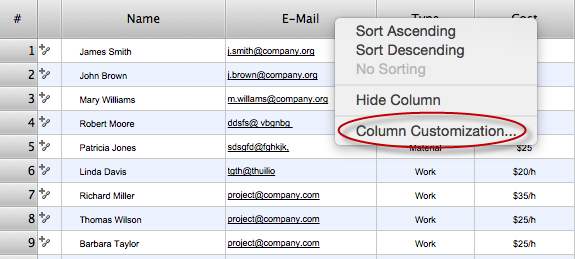
After you create a project task list it is necessary move to resource planning. You need to determine and assign resources on each task. There are several types of resources defined in ConceptDraw PROJECT: work, material, cost and equipment. The columns of a project Resource List in ConceptDraw PROJECT displays the information you need to capture about each resource in your project.
Bar Chart Examples
Complete set of bar chart examples is produced using ConceptDraw software. Surfing bar chart examples you can find an example that is the best for your case.HelpDesk
How to Customize the Columns in Your Project File
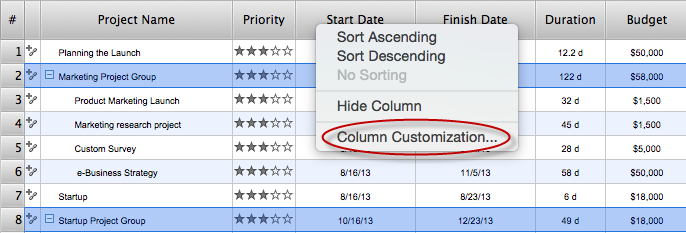
Some ConceptDraw PROJECT users need to start new projects from their custom default page. In this post we tell you how to make it.How to Create a Column Chart
The question how to create a column chart have a simple answer. Use ConceptDraw tips to find out how to create a column chart depicts your data the best way.Polar Graph
This sample shows the Polar Graph. The Polar Graph is a graph in the polar coordinate system in which the each point on the plane is defined by two values - the polar angle and the polar radius. The certain equations have very complex graphs in the Cartesian coordinates, but the application of the polar coordinate system allows usually produce the simple Polar Graphs for these equations.HelpDesk
What Information to be Displayed in the ConceptDraw PROJECT Gantt Chart View
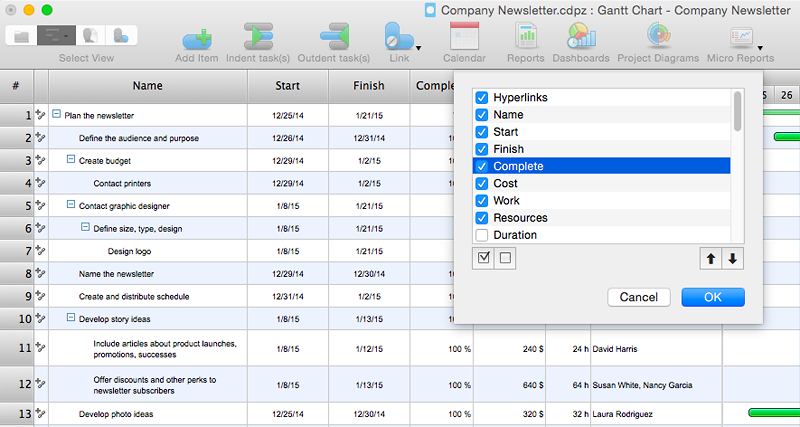
What information can can contain the project task list? Gantt Chart view is a graphical representation of a project outline that allows one to allocate tasks.You can customize a project’s tasks list view to include the columns you need to meet your information requirements. The columns of the ConceptDraw PROJECT Gantt view contain the information you want to capture about each task in your project. The following article details what information can be contained in the columns of a project outline:<
HelpDesk
What Information can be Displayed in the Multiproject Dashboard View
What information can can contain the projects list
HelpDesk
How to Draw a Matrix Organizational Chart with ConceptDraw PRO
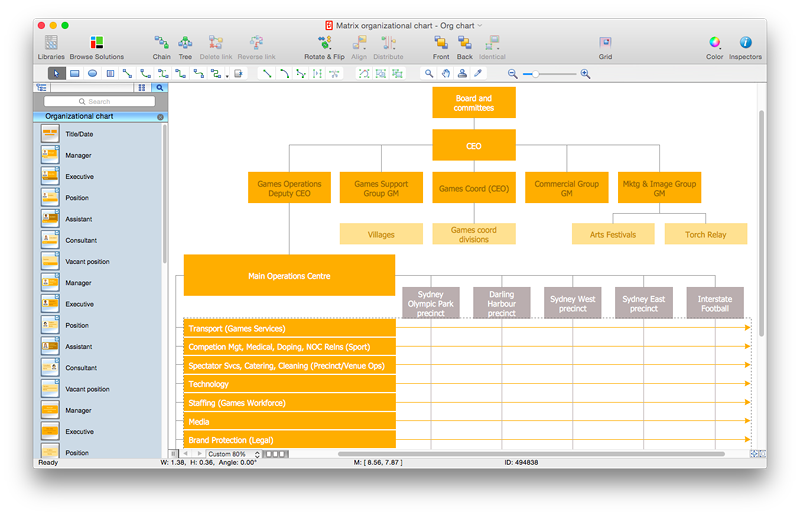
There are a number of moments which are influenced on how the organizational structure of a certain business needs to be, how complex, and which type it should keep. The matrix organizational structure is atypical because it brings together employees and managers from different departments to work toward accomplishing a goal. This structure is commonly found in businesses that have more than one line of reportage. For instance, a company might contain an engineering department with engineering managers who workers report to. However, these workers might also have to liaise with different product or project managers depending on current tasks. Some form of matrix organization is found in most large-scale modern businesses. It is one of the most complicated reporting structures. You can easily build a clear matrix organizational chart in ConceptDraw PRO using templates from ConceptDraw Solution Park.Online Collaboration via Skype
Collaborating with co-workers is very important, not only in order to get things done effectively, but also to keep in touch with the outside world. Great way for business collaboration is Skype.
HelpDesk
How to Create a SIPOC Diagram
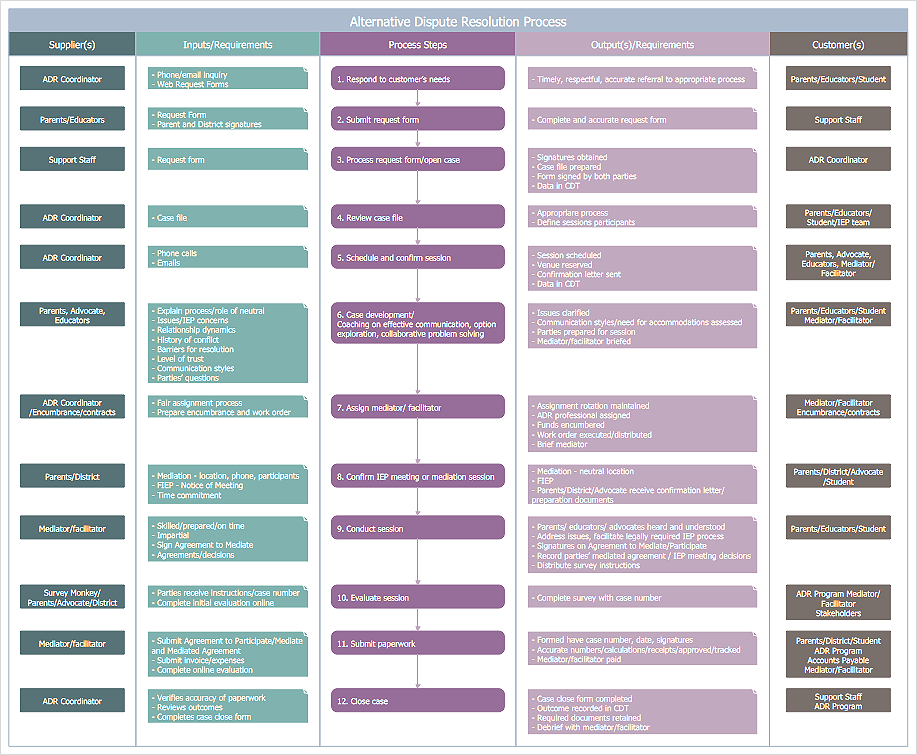
SIPOC (suppliers, inputs, process, outputs, customers) diagram is focused on the quality of a business process inputs and outputs. SIPOC diagram has a form of a segmented table that gives comprehensive outline for each category. SIPOC diagram depicts the start and end of a process, and the relationships between a company and its suppliers. SIPOC diagram is an important part of the Six Sigma methodology. With its Business Process Mapping solution, ConceptDraw PRO offers a power set of process mapping tools to empower quality management within an organization.Bar Chart Template for Word
All these bar chart templates are included in the Bar Graphs solution. You can quickly rework these bar graph templates into your own charts by simply changing displayed data, title and legend texts.- Business Plan Bar Graph
- Business Graphs Examples
- Examples Of Business Plan Charts
- Cafe and Restaurant Floor Plan | Bar Chart Template for Word ...
- Business Plan Template With Graphs And Charts
- Example Of Business Plan
- Sample Business Plan
- Business Plans Graphs And Bar Charts
- Sales Growth. Bar Graphs Example | Bar Diagrams for Problem ...
- Create Graphs and Charts | Sales Growth. Bar Graphs Example ...
- Column Graph For Business
- Laboratory equipment - Vector stencils library | Chemistry Symbols ...
- Drawing Of Business Plan Template Charts And Graphs
- Company Bar Graphs
- Business Charts Examples
- Bar Graph | Bar Graphs | Double bar graph - Template | _bar Graph_
- Bar Chart Software | Bar Chart Examples | How to Create a Bar ...
- Sample Business Plan Template
- Business Graphs With Data Examples
- Free Business Charts And Graphs


